 Nabanita Mandal
 Soumya Lipsa Rath
95% of researchers rate our articles as excellent or good
Learn more about the work of our research integrity team to safeguard the quality of each article we publish.
Find out more
ORIGINAL RESEARCH article
Front. Phys. , 05 January 2024
Sec. Biophysics
Volume 11 - 2023 | https://doi.org/10.3389/fphy.2023.1320437
This article is part of the Research Topic Interaction and Dynamics of Biological Molecules View all 5 articles
The effect of temperature on SARS-CoV-2 is frequently debated upon. There is evidence of temperature sensitivity of the viral proteins; however, how heat influences the protein–protein interaction between a SARS-CoV-2 protein and the human angiotensin-converting enzyme 2 (ACE2) receptor remains to be elucidated. Here, we studied the receptor-binding domain of the surface glycoprotein of SARS-CoV-2 wild type and variants of concern bound to the human ACE2 receptor at different temperatures through atomistic simulations. We found that although there were no major conformation changes in the protein complexes at high temperatures, the dynamics of the proteins significantly increased. There was loss of protein–protein contacts and interaction energies. Thus, the protein–protein interaction was found to be rather strong. This study would be useful for viral protein studies and the design of peptide-based vaccines and therapeutics.
The pandemic caused by SARS-CoV-2 distresses individuals even 4 years after the first report of the infection. The disease transmission is influenced by various factors including population density, immunity, local healthcare facilities, and climate [1]. The seasonality of the coronaviruses is established. SARS, the predecessor of SARS-CoV-2, occurred during the onset of winter in 2002; only negligible cases were reported at 30°C. Similarly, the number of COVID-19 cases peaked during winter every year [2]. Due to the sustenance of infection for over 2 weeks and population density, the disease spread continues in the subtropical regions owing to the survival of the virus on surfaces and air droplets [3]. The virus has spread to several countries with varying climatic conditions; however, the influence of temperature in its transmission cannot be denied [4]. Specifically, hot and humid weather conditions reduce its survival though its transmissibility is not completely lost [5]. Research has been focused on the development of various chemical, physical, and biological interventions to inactivate the virus [6]. Formaldehyde, b-propiolactone, and TRIzol are the commonly used chemical deactivators, and vaccines are the most commonly used biological treatment [7]. Physical treatment strategies include far-UV light, membrane filtration, cold plasma, and thermal inactivation [8]. Thermal deactivation is one of the most used techniques against the virus; the virus infectivity is reduced by almost 100-fold. Innovative strategies such as heating masks and warm air exposure help inactivate the virus in the upper respiratory tract [9].
At the molecular level, temperature could alter the structure of viral proteins, envelope, membrane lipids, or nucleic acids. However, viruses, similar to other microorganisms, have a natural strategy to adapt to different environmental changes [10]. Different proteins respond to temperature changes differently. Few proteins denature due to the loss of hydrogen bonds and secondary structure changes, while several others are thermostable [7]. SARS-CoV-2 viral proteins are exceptionally stable [11]. However, recent clinical studies have shown that temperature directly influences the protein–protein association between the viral Spike protein and the human angiotensin-converting enzyme 2 (ACE2) receptor [12]. Specifically, at temperatures above 38°C, their association weakens [13]. Functional and biophysical assays show that the dissociation kinetics of the wild-type (WT) Spike receptor-binding domain (RBD)–ACE2 complex at lower temperatures was slower [2]. This indirectly indicates a higher affinity of the virus for the host at lower temperatures. However, a single mutation at N501Y, as observed in the α variant of SARS-CoV-2, makes it more stable at warmer temperatures [14].
SARS-CoV-2 has undergone several mutations in its structure and continues to evolve and evade therapeutic interventions including drugs and antibodies [15]. These variants of concern (VOCs) harbor mutations in important viral proteins such as proteases and surface spike glycoproteins [16]. The surface glycoprotein of SARS-CoV-2, also known as Spike, is of particular interest since it has several mutations in its structure [17]. These mutations occur at several sites of the protein; however, the mutations between residues 333 and 527 that comprise the receptor-binding domain influence the complex formed between the Spike and human receptor protein [18]. The Spike protein is stable and sensitive at high temperatures [19]. Proteins generally denature at high temperatures; however, this virus adopts a unique strategy to survive by compacting the structure of this protein and masking the RBD at high temperatures [20]. This restricts the viral protein from binding the human ACE2 receptor found in several tissues of the respiratory, digestive, renal, and other systems [21, 22].
The RBD of the Spike protein binds with the ACE2 receptor in the lung epithelia to enter the host cell. To form a stable complex, it interacts with the host cell protein through intermolecular salt bridges, hydrogen bonds, and hydrophobic interactions [23]. Approximately 14 residues of the RBD domain, which are present at the top of the complex, are involved in the binding with ACE2 [7]. The behavior and infectivity rate of the virus at different weather conditions have been studied extensively; however, only a negligible change was observed in the structure of ACE2 [24, 25]. Temperature influences the activity and virulence of the virus; however, there is a lack of understanding of the molecular-level changes in the viral protein–host receptor interaction with increasing temperatures [26]. “It is important to understand whether high temperature can disrupt the ACE2–RBD interaction.” [27]. Hence, to understand the stability and dynamics of the protein–protein interaction, we performed atomistic molecular dynamics (MD) simulations of WT and VOCs at different temperatures [28, 29].
The SARS-CoV-2 spike glycoprotein sequence was obtained from RCSB (PDB ID 6LZG), and the RBD structure was extracted from chain B and residues ranging from Tyr333 to Pro527 [9]. The complex consists of two chains, ACE2 and RBD, having 596 and 209 residues, respectively [30]. Thirteen residues were missing from the N-terminal of ACE2; however, they do not directly play a role in the interaction with the RBD; therefore, they were not modeled [31]. This structure was considered the WT system. The RBD sequences of the variants were obtained by mutating the residues using PyMOL. Multiple-sequence alignment was performed using Clustal Omega, to understand the position of the mutations. Following alignment of the RBD sequences, the variants, namely, Alpha (B.1.1.7), Beta (B.1.351), Gamma (P.1), Delta (B.1.167.2), and Omicron (B.1.159), were generated by mutating specific residues in the WT Spike protein using Modeller 10.1 [32]. The modeled structures were compared with the existing crystal structures (PDB IDs, 7EKF, 7VX4, 7NXC, 7WBQ, and 7WK6 corresponding to the crystal structures of Alpha, Beta, Gamma, Delta, and Omicron). The following RMSDs were obtained: 1.5 Å, 1.65 Å, 1.70 Å, 1.35 Å, and 1.4 Å [33]. The models were devoid of glycan residues; this was in accordance with earlier observations by Amaro et al. that glycans are not directly involved in the interaction between the RBD and ACE2 [34]. To understand the effect of mutations at different temperatures, we carried out atomistic MD simulations of the WT and the five variants at temperatures 310, 315, 320, 330, and 340 K, respectively, to detect the variations from body temperature with that of temperatures found in some hot springs.
Atomistic MD simulations were performed using the GROMACS MD simulation software package with the CHARMM36 force field parameters [35, 36]. Initially, the structure was solvated with TIP3P water molecules and neutralizing ions in a cubic box of dimensions, 10 nm × 10 nm × 10 nm [37]. For charge neutralization, 24 ions were randomly used to replace the solvent molecules. To avoid any bad contacts created due to mutations and the addition of water and ions, the systems were subjected to energy minimization in the steepest descent and further in conjugate gradients for 2000 steps [38]. Initially, position restraint was placed on the CA atoms of the proteins, which were gradually reduced and completely removed after equilibration. Periodic boundary conditions were implemented during the simulations. The systems were gradually heated from 0 to 310, 315, 320, 330, and 340 K for 200 ps [39]. Subsequently, they were equilibrated at 310, 315, 320, 330, and 340 K in an NVT ensemble, using the modified Berendsen thermostat for approximately 500 ps. They were then equilibrated in an NPT ensemble at 1 atmospheric pressure using the Parrinello–Rahman barostat for 1 ns [40]. For all the equilibration and subsequent production runs, a time step of 2 fs was used. After the convergence of potential energy and density, production simulation was performed; the coordinates were saved at an interval of every 1,000 ps at the respective temperatures [40]. The particle mesh Ewald method was used to treat the long-range electrostatic interactions [41].
Principal component analysis (PCA) was used for studying the dynamics of the protein; it represents the dominant motions of the protein in two steps [42]. In the first step, the covariance matrix was calculated. Subsequently, the matrix was diagonalized. The covariance matrix was calculated based on a group of protein structures, which was given by the equation
where xi and xj represent the atomic coordinates and the brackets represent the average of the group of protein structures. The diagonal of the matrix was calculated from the following equation:
where A is the eigenvector and
The total binding energy and the binding energy between the RBD and ACE2 for the WT and VOCs (Alpha, Beta, Gamma, Delta, and Omicron) was calculated using the molecular mechanics/Poisson–Boltzmann surface area (MM/PBSA) [43]. Here, the binding energy of the target ligand was defined as follows:
where ΔGprotein, ΔGcomplex, and ΔGligand are the total free energies of the protein, the complex, and the ligand (here, protein), in the solvent, respectively. The free energy of each separate entity was represented as follows:
where EMM is the average molecular mechanic’s potential energy in vacuum and Gsolvation is the free energy of solvation. TS is the entropic augmentation of free energy in vacuum, and S and T are the entropy and temperature, respectively. EMM comprises bonded and non-bonded terms, which involve both the electrostatic (Eelec) and the van der Waals (Evdw) interactions. The solvation free energy considers both the electrostatic and non-electrostatic (Gpolar and Gnonpolar) components [43]. The binding free energy for all the complexes was calculated from the last 10 ns of the simulation trajectories by taking 50 frames and calculating the average binding energy value and standard deviation. VMD and PyMOL were used for visualization of all trajectories. All analyses were performed using GROMACS tools [44, 45].
Dynamic cross-correlation between the residues was calculated using correlationplus software [46]. Dynamic cross-correlation for two residues, i and j, can be calculated as follows:
where
Following the minimization and equilibration of the complexes, we generated five systems at different temperatures for each of the variants and performed atomistic MD simulation for 100 ns each (Supplementary Table S1). SARS-CoV-2 RBD comprises five antiparallel beta sheets, β1, β2, β3, β4, and β7, which are twisted around each other with short interconnected loops and helices that form the core of the RBD. There is an extended insertion, which contains the short β5 and β6 strands, along with the α4 and α5 helices and the β4−β7 loops. This extended insertion forms the receptor binding-motif (RBM), which contains residues that bind to the human ACE2 receptor (Figure 1). The ACE2 protein is ellipsoidal and is composed mainly of alpha helices (Figure 1). The extracellular region comprises two domains: a metalloprotease domain and a carboxy terminal domain. The RBD binds with the carboxy terminal domain. Mutations in the RBD residues E484, L452, R454, K458, and T478 have a strong influence on the binding affinity of the RBD for the ACE2 receptor protein [29].
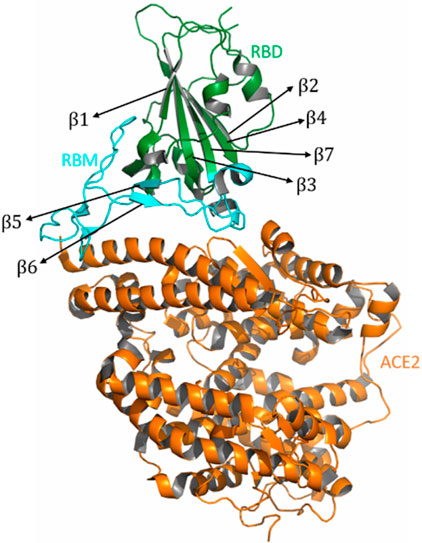
FIGURE 1. Structure of the RBD/ACE2. The RBD region is shown in green color, the ACE2 region is shown in orange color, and the RBM region is shown in cyan color. The figure shows the alpha helices and the beta sheets present in the RBD region.
To check whether RBD/ACE2 in the WT and VOCs have equilibrated properly, we studied the evolution of RMSDs over the simulation time. The RMSD changes with respect to the starting conformation were not markedly different, indicating no major conformational changes in any of the complexes (Table 1). However, as the temperature increased, there was a marginal increase in the values. The complex contained both the RBD and ACE2; therefore, the individual RMSD values were studied. The RBDs of Alpha, Delta, Omicron, and WT were comparatively stable (Supplementary Figure S1). However, slight variations were observed for the Beta and Gamma RBDs. ACE2 was very stable for all variants at different temperatures, with respect to the starting structure (Supplementary Figure S2). Therefore, based on the complex and individual protein RMSDs, we confirmed that all the systems were well equilibrated.
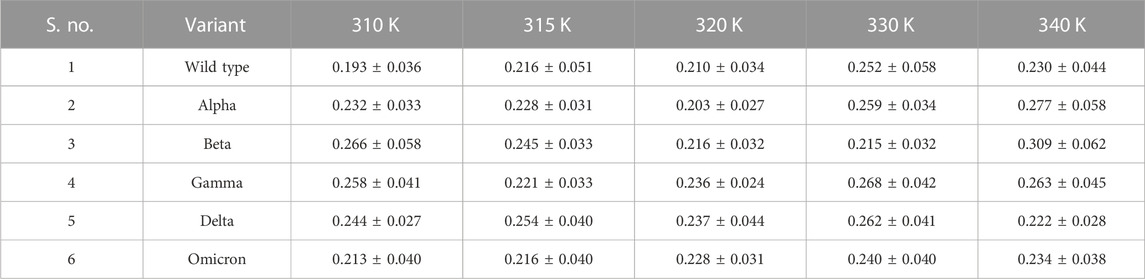
TABLE 1. Average RMSD values of RBD/ACE2 complexes at different temperatures.
Root mean square fluctuation (RMSF) of C-alpha was used to evaluate the difference in the fluctuation of the protein backbone atoms. The RBD region of Spike ranges from 333 to 527. In the RMSF, distinct peaks were observed between residues 355 and 380 in all the systems. However, these two peaks correspond to the β1−β2 and β2−β3 region of the RBD. In the complete Spike protein, the dynamics of this region is not expected to be this high; however, due to solvent accessibility and lack of glycan moieties, there was a greater flexibility in the region. In the remaining part of the RBD region, which comprises the RBM ranging between residues 438 and 506, we monitored the average fluctuations during the last 10 ns of the simulation as a function of temperature (Supplementary Figure S3). All the variants displayed higher peaks at 330 K and 340 K. In the WT, Alpha, and Delta complexes, the RBD did not show much difference at different temperatures. However, at 340 K, significantly higher peaks were observed in the RBM region in the Beta, Gamma, and Omicron systems. The alteration in the primary sequence was expected to cause changes in the structural behavior and protein–protein interaction; however, the average RMSF at different temperatures exhibited similar fluctuations. This indicated that the overall protein structure does not undergo major changes. The RMSF of the C-alpha atoms of ACE2 exhibited marked stability across the variants at different temperatures, compared to that of the RBD (data not shown).
To study the dynamics of the RBD with respect to the ACE2 receptor, a PCA was performed by extracting data from the last 10 ns of the trajectory. We studied the distribution of the first two principal components, PC1 and PC2, of the RBD and ACE2 individually at different temperatures (Supplementary Figures S4, S5). The dynamics of both RBD and ACE2 increased with the increase in temperature; we focused on understanding the protein–protein interfacial dynamics that would help predict the complex stability. We assessed the dynamics of the RBM region alone at different temperatures for the WT and the VOCs (Figure 2). At 310, 315, and 320 K, the RBM exhibited lesser dynamics (Figures 2A–C). However, as the temperature increased, at 330 K and 340 K, the dynamics increased (Figures 2D, E). To evaluate the differential conformations in the RBM, we extracted structures of the RBD/ACE2 complex at different positions. When we move toward the left of the origin along the first principal component, the overall structure and the number of contacts remain similar to those in the crystal structure (Figures 3A, B; Supplementary Figure S6). However, as we move toward the right, there was a loss of contacts (Figures 3C, D). The changes in conformation were mostly observed around the Y453−K353 and Y501−Q42 residues that had moved further away in the right conformation. Therefore, at the origin and toward the left, the RBD is more compact and closer to ACE2 than that at the right, with a greater number of interprotein contacts. This increase in dynamics toward the right side of the PCA plot started at 330 K and was more prominent at 340 K. In addition, the interprotein contact maps revealed that under different temperatures, the contact patterns changed markedly.
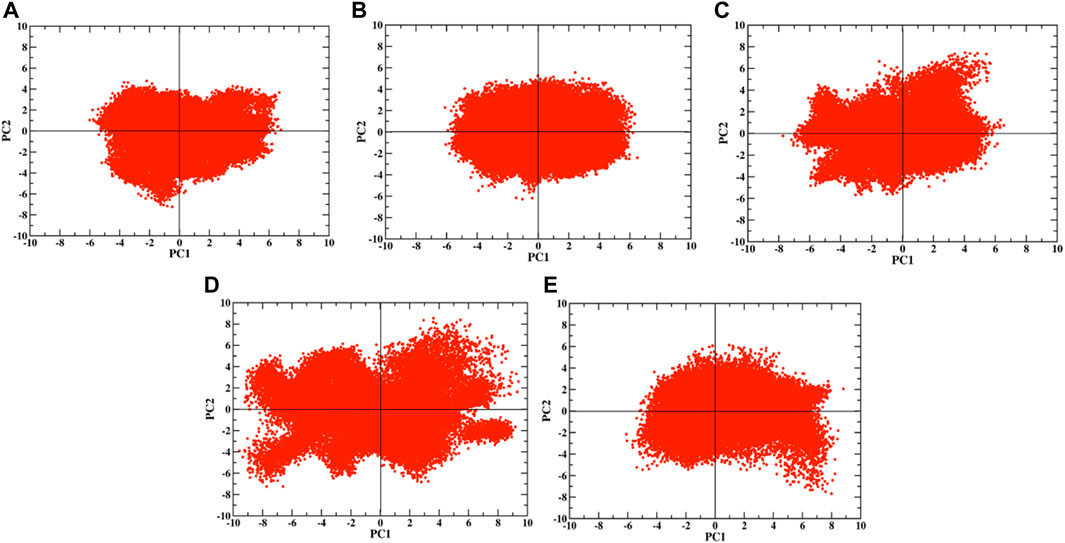
FIGURE 2. PCA plots at (A) 310 K, (B) 315 K, (C) 320 K, (D) 330 K, and (E) 340 K for the RBM region.
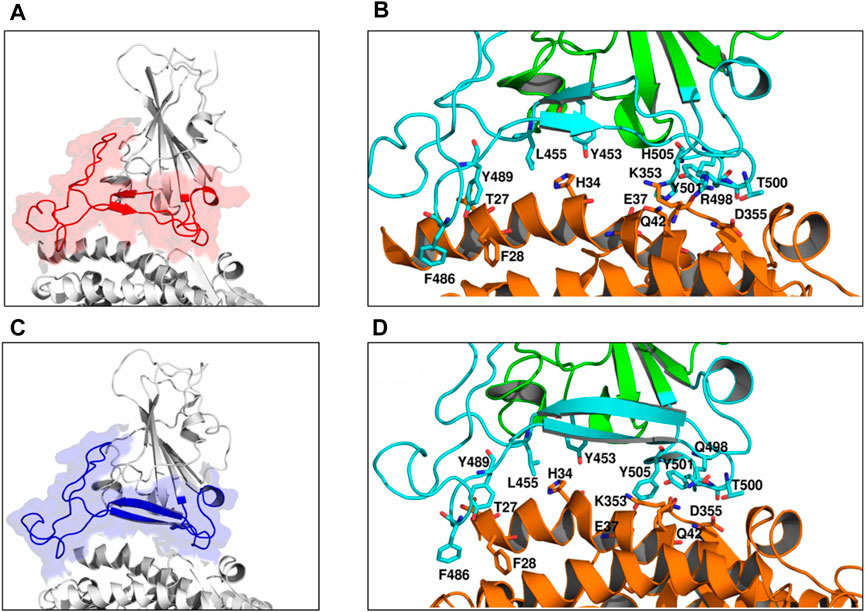
FIGURE 3. Differential conformations of the RBD/ACE2 complex. Toward the (A) left of the origin along PC1, (B) a greater number of contacts were seen. (C) Toward the right side along the PC1 axis, (D) few contacts were lost. The interface region is highlighted in red and blue colors in (A) and (C), respectively. Interface residues are shown as sticks and colored by CPK.
To qualitatively observe the difference in dynamics with the change in temperature, porcupine plots were constructed based on PC1 for the RBD/ACE2 complex at 310 K, which is around room temperature, and at 340 K, where maximum complex dynamics was observed. The red cones in Figure 4 represent the magnitude and directions of the vectors at every C-alpha position of each complex; both structures show remarkable difference in the direction and magnitude of the vectors. At 310 K, the structures exhibit very less movement. The cones are mostly prominent at the loop regions near the edge of the complexes. However, at the RBM–ACE2 interface, the cones are small and mostly directed in the same direction. In contrast, at 340 K, high dynamics is observed in both RBD and ACE2. Most of the ACE2 cones are in the anticlockwise direction, and RBD cones are in the clockwise direction. This signifies opposing movements. However, at the interface region, we did not observe any opposing dynamics. The vectors of the interacting helices of ACE2 had adapted the anticlockwise movements of the RBD, which was different from that of the rest of the protein. Therefore, at higher temperatures, the dynamics of the RBD/ACE2 complex is very high; this could gradually lead to the loss of contacts between the proteins.
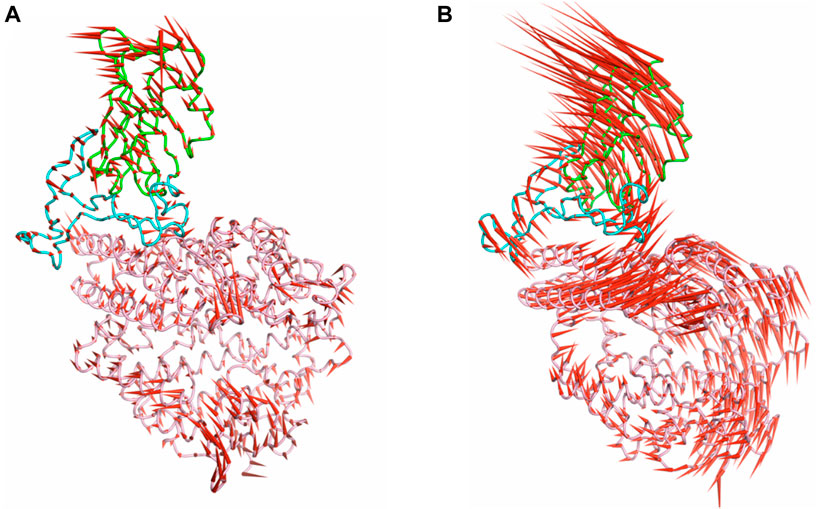
FIGURE 4. Porcupine plots generated from the PCA for the (A) wild type at 310 K and (B) Beta at 340 K. The red color cones indicate the magnitude and direction of the eigenvectors from the C-alpha atoms.
To understand the difference in binding affinities, we made a systematic comparison of the binding energies of the RBD and ACE2. The total binding energies were calculated using the MM/GBSA method (Figure 5). Omicron has the highest binding energy with ACE2. However, as the temperature increases, the binding energy reduces. WT and Alpha showed the lowest binding energies at all temperatures. The affinity increased with temperature in the WT; however, this was not significant. Similarly, the affinity of Beta and Delta increased with temperature. Alpha and Gamma exhibited a −50 kcal/mol and −300 kcal/mol reduction in binding energy, in the comparison between 310 K and 340 K, respectively. The variation of the van der Waal’s, electrostatic energy, polar solvation energy, and binding energy for WT, Alpha, Beta, Gamma, Delta, and Omicron at different temperatures is shown in Supplementary Figure S7. From the figure, it is clear that electrostatic energies followed by van der Waal’s energy are the major contributing factors toward the protein–protein interaction. Mutations in the variants lead to differential surface electrostatics, dynamics, and binding energies.
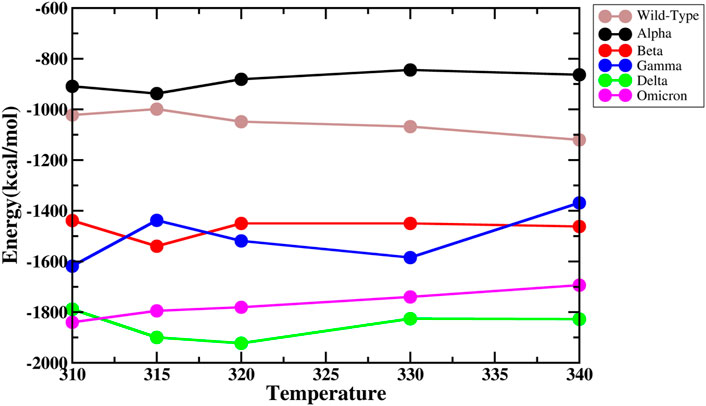
FIGURE 5. Total binding energies of the complexes at different temperatures.
Eight residues each from the RBD and ACE2 participate in the most crucial contacts for enabling the protein–protein complex formation [11]. Therefore, we checked for the interaction energies of these eight residues, particularly in the RBD and ACE2, using MM/GBSA residue-wise decomposition (Figure 6A). Residues from the RBD included L455, Y453, F486, Y489, Q498, T/N501, and Y505. The residue N501 is mutated to Y501 in Alpha, Beta, Gamma, and Omicron, while the residue Y505 is mutated to H505 in case of Omicron. The residues exhibited a favorable interaction energy of approximately 310 K in all cases. When the temperature increased, the interaction energy reduced. In WT, all the residues, except for L455, had reduced interaction energy at 340 K. In Alpha, Beta, and Delta variants, the residues 453, 489, 498, 500, 501, and 505 exhibited remarkable reduction in energies, while in Gamma, this was observed for the residues 498, 500, 501, and 505. In Omicron, reduction in energy was observed for all the interacting residues of the RBM, except for H505. The residues F28, Y473, K353, D355, E37, Q42, T27, and H34 from ACE2 interact with the RBD (Figure 6B). In all the systems, except Omicron, the residues K353, D355, E37, Q42, T27, and H34 exhibited reduced energies of interaction at high temperatures. The reduction was relatively less for Delta; Omicron showed a mixed behavior. The residues F28, Y473, E37, T27, and H34 showed reduced interaction energies. However, K353 and Q42 showed a significant gain in interaction energy. The energy of D355 remained almost similar despite the change in temperature. Overall, the interaction energies reduce with the increase in temperature.
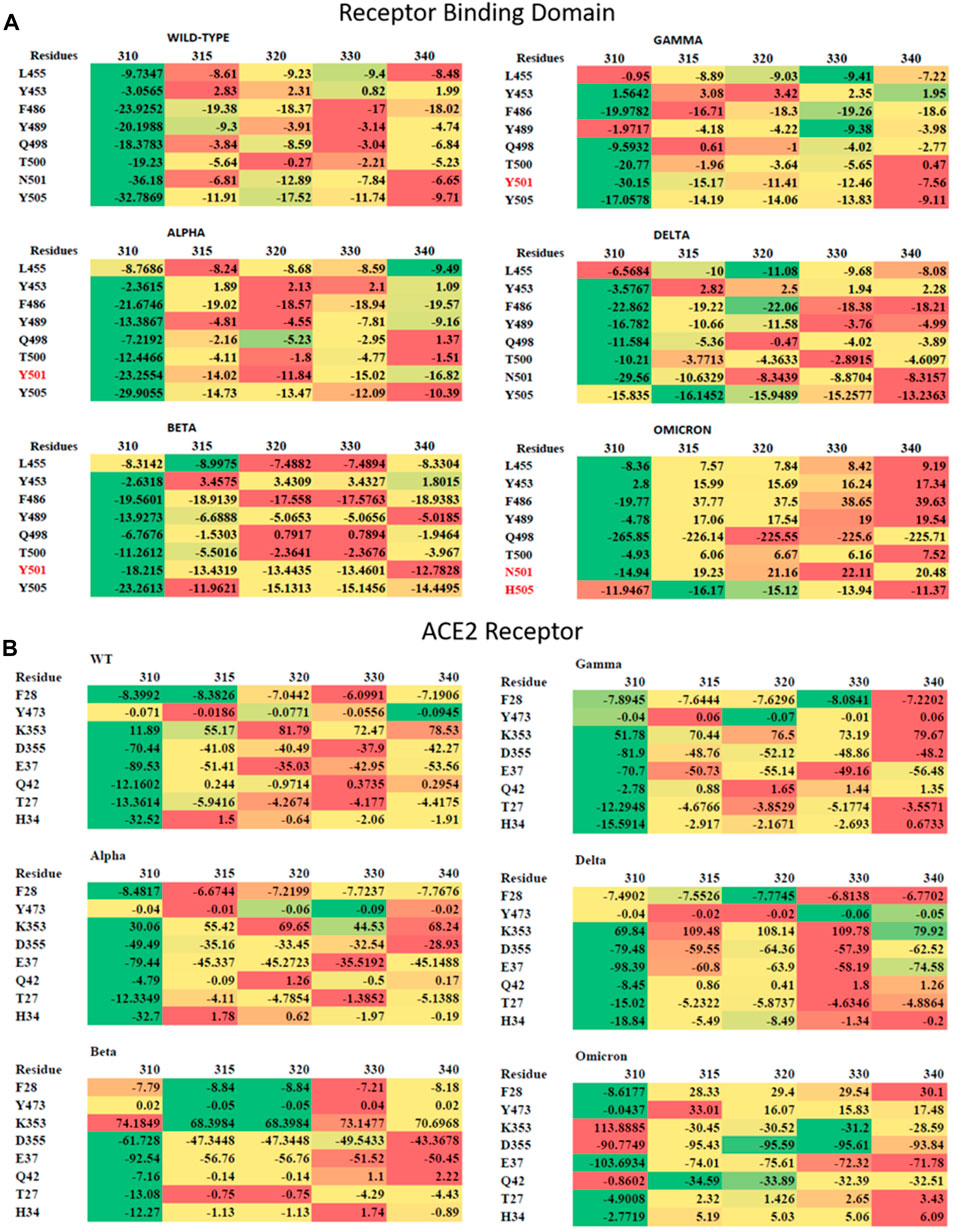
FIGURE 6. Residue-wise interaction energies for (A) the RBD and (B) ACE2 are shown in the form of a heatmap. The residues of the RBD, which are mutated in the variants, are shown in red color. The lowest values are shown in green color, the median values are shown in yellow color, and the highest values are shown in red color.
We investigated the coupled motions between the C-alpha atoms of the RBD and ACE2 at all temperatures for the WT and the VOCs, by evaluating the last 10 ns of the equilibrated trajectory. The pairwise correlation calculated based on linear mutual information was normalized and visualized using a correlation map. A higher value indicated a higher signal between the residue pairs. Figure 7 shows the DCCM plots for all the systems at 310, 320, 330, and 340 K; 315 K was omitted for maintaining a uniform assessment. With the increase in temperature, there was an increased correlation between the RBD and ACE2. It was especially high for Alpha and Beta systems, followed by that for Delta, Gamma, WT, and Omicron. Omicron and WT complexes show very less correlated movement even at temperatures as high as 340 K. When the DCCM plots for the systems with low and high correlations were compared (Figure 8), the RBM region paired with the contacting ACE2 residues showed the least correlation in all the systems, irrespective of the dynamics of the rest of the system. This indicated that the RBD and ACE2 interaction was very strong and stable, resisting disruption even with increasing temperatures [47, 48].
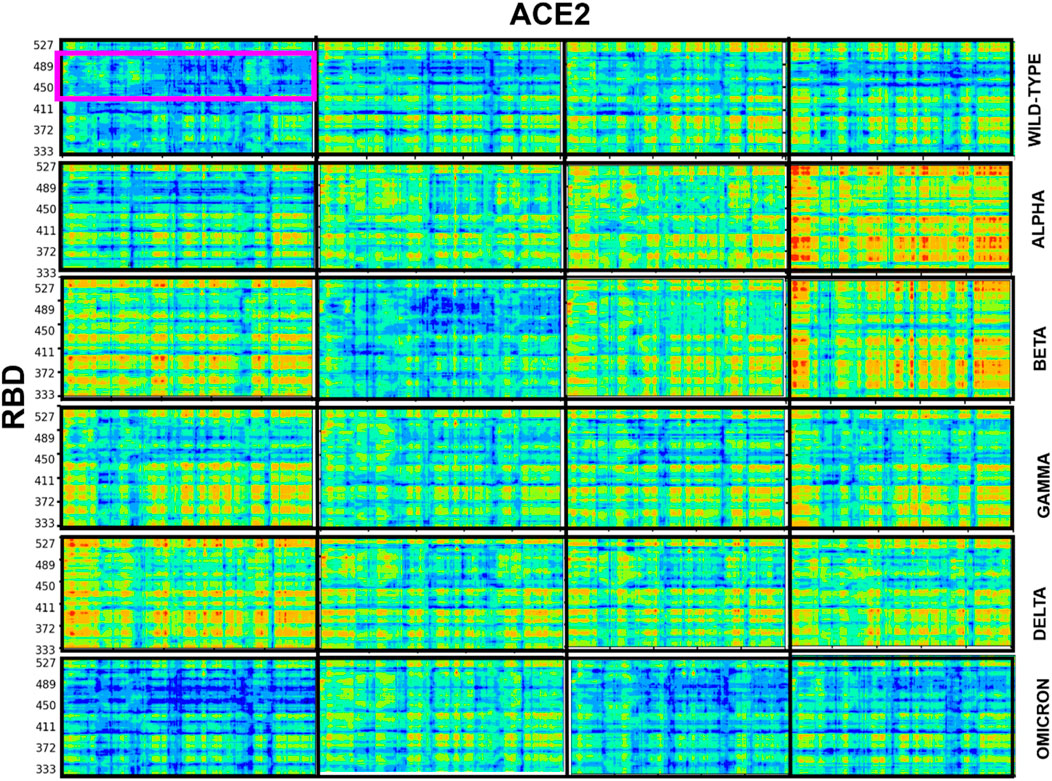
FIGURE 7. Dynamic cross-correlation matrix of the RBD with respect to the ACE2 protein for all the systems. The blue region indicates the region of zero correlation between the residues, and the red region indicates relatively high correlation between the corresponding residues. The RBM region is highlighted in a magenta rectangle in the wild-type system at 310 K to show the relatively low correlation.
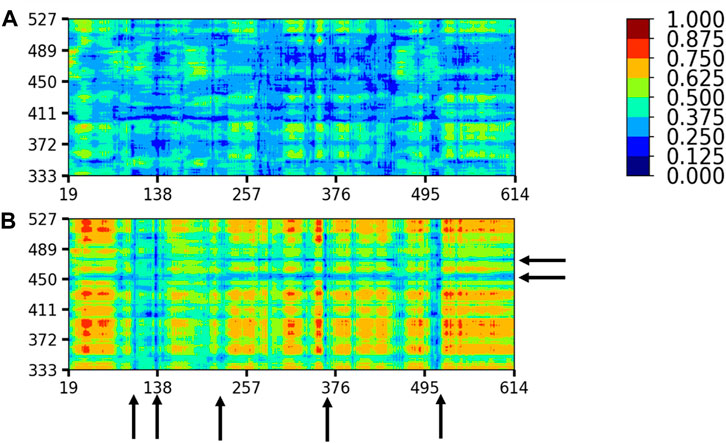
FIGURE 8. Differential dynamics between the RBD and ACE2 as seen in (A) the wild type at 310 K and (B) Beta at 340 K. The black arrows show the residues with zero or very less correlation. Color coding is similar to Figure 7.
The seasonality of viral outbreaks is not novel; viruses propagate at certain favorable external conditions including temperature and salts. Here, we studied the effect of temperature on the interaction between the SARS-CoV-2 Spike protein and human ACE2 receptor. The RBD was taken as a representative structure of the Spike protein, and hACE2-bound complexes of the WT and variants of concern were simulated using all-atom molecular dynamics simulations at different temperatures. All systems were stable without any marked conformational changes. However, the overall dynamics changed with the increase in temperatures. This increase in dynamics was observed in both the domains of the complex; however, the interdomain dynamics did not show such differences. Few of the interprotein interactions were found to have been lost as the temperature increased. Residue-wise decomposition for the interface residues clearly showed an overall reduction of per-residue interaction energy with the increase in temperatures, in nearly all the systems. Thus, even at temperatures as high as 340 K, the Spike-RBD did not dissociate from the ACE2 receptor. This study presents a detailed molecular picture of the effect of temperature on the SARS-CoV-2/ACE2 complex. Notably, using different experimental techniques, Prevost et al. found an increased association between the RBD and ACE2 at lower temperatures indicating a higher viral attachment. However, the N501Y mutation found in VOCs was not showing similar behavior. This also shows the differential RBD–ACE2 association due to mutation [49]. Similarly, the Omicron sub-lineages also exhibited an enhanced binding to the ACE2 receptor at lower temperatures [50]. Temperature-dependent changes in the RBD domain of the Spike protein have also been studied earlier by Rath and Kumar [51]. However, the RBD–ACE2 shows completely different dynamics as per our observations. The temperature range chosen in this study varies from the body temperature range of around 37°C till 70°C, and as per some of the recent studies, SARS-COV-2 is viable at high temperatures, which matches well with our findings [52]. Additional studies with variation in other external conditions such as pH or ion concentration could be studied. This study provides strong evidence that heat alone might not prove sufficient to reduce the host–virus interaction and could be further applied in the design of preventive PPE kits, in laboratory studies, or repurposing existing drugs [53].
The raw data supporting the conclusion of this article will be made available by the authors, without undue reservation.
NM: data curation, formal analysis, investigation, methodology, validation, visualization, and writing–original draft. SR: conceptualization, investigation, resources, supervision, and writing–review and editing.
The author(s) declare financial support was received for the research, authorship, and/or publication of this article. The authors thank CPDA, NIT Warangal for the funding support.
The authors declare that the research was conducted in the absence of any commercial or financial relationships that could be construed as a potential conflict of interest.
All claims expressed in this article are solely those of the authors and do not necessarily represent those of their affiliated organizations, or those of the publisher, the editors, and the reviewers. Any product that may be evaluated in this article, or claim that may be made by its manufacturer, is not guaranteed or endorsed by the publisher.
The Supplementary Material for this article can be found online at: https://www.frontiersin.org/articles/10.3389/fphy.2023.1320437/full#supplementary-material
1. Duffy S. Why are RNA virus mutation rates so damn high? Plos Biol (2018) 16(8):e3000003. doi:10.1371/journal.pbio.3000003
2. Hu B, Guo H, Zhou P, Shi ZL. Characteristics of SARS-CoV-2 and COVID19. Nat Rev Microbiol (2021) 19:141–54. doi:10.1038/s41579-020-00459-7
3. Yang TJ, Yu PY, Chang YC, Hsu STD. D614G mutation in the SARS-CoV-2 spike protein enhances viral fitness by desensitizing it to temperature-dependent denaturation. J Biol Chem (2021) 297:101238. doi:10.1016/j.jbc.2021.101238
4. Islam SKR, Prusty D, Manna SK. Structural basis of fitness of emerging SARS-COV-2 variants and considerations for screening, testing and surveillance strategy to contain their threat. medRxiv preprint (2021). doi:10.1101/2021.01.28.21250666
5. Otto SP, Day T, Arino J, Colijn C, Dushoff J, Li M, et al. The origins and potential future of SARS-CoV-2 variants of concern in the evolving COVID-19 pandemic. Curr Biol (2021) 31(14):R918–29. doi:10.1016/j.cub.2021.06.049
6. Taylor PC, Adams AC, Hufford MM, de la Torre I, Winthrop K, Gottlieb RL. Neutralizing monoclonal antibodies for treatment of COVID-19. Nat Rev Immunol (2021) 21:382–93. doi:10.1038/s41577-021-00542-x
7. Lan J, Ge J, Yu J, Shan S, Zhou H, Fan S, et al. Structure of the SARS-CoV-2 Spike receptor-binding domain bound to the ACE2 receptor. Nature (2020) 581:215–20. doi:10.1038/s41586-020-2180-5
8. Yan R, Zhang Y, Li Y, Xia L, Guo Y, Zhou Q. Structural basis for the recognition of SARS-CoV-2 by full-length human ACE2. Science (2020) 367(6485):1444–8. doi:10.1126/science.abb2762
9. Wang Q, Zhang Y, Wu L, Niu S, Song C, Zhang Z, et al. Structural and functional basis of SARS-CoV-2 entry by using human ACE2. Cell (2020) 181(4):894–904.e9. doi:10.1016/j.cell.2020.03.045
10. Francesca S, Melania M, Paola LM, Milena F. Body localization of ACE-2: on the trail of the keyhole of SARS-CoV-2. Front Med (2020) 7:594495. doi:10.3389/fmed.2020.594495
11. Spinello A, Saltalamacchia A, Magistrato A. Is the rigidity of SARS-CoV-2 spike receptor-binding Motif the hallmark for its enhanced infectivity? Insights from all-atom simulations. J Phys Chem Lett (2020) 11:4785–90. doi:10.1021/acs.jpclett.0c01148
12. Odolczyk N, Marzec E, Winiewska-Szajewska M, Poznański J, Zielenkiewicz P. Native structure-based peptides as potential protein-protein interaction inhibitors of SARS-CoV-2 spike protein and human ACE2 receptor. Molecules (Basel, Switzerland) (2021) 26(8):2157. doi:10.3390/molecules26082157
13. Ma Y, Pei S, Shaman J, Dubrow R, Chen K. Role of meteorological factors in the transmission of SARS-CoV-2 in the United States. Nat Commun (2021) 12:3602. doi:10.1038/s41467-021-23866-7
14. de Haan CA, Rottier PJ. Molecular interactions in the assembly of coronaviruses. Adv Virus Res (2005) 64:165–230. doi:10.1016/S0065-3527(05)64006-7
15. Mittal A, Manjunath K, Ranjan RK, Kaushik S, Kumar S, Verma V. COVID-19 pandemic:Insights into structure, function, and hACE2 receptor recognition by SARS-CoV-2. Plos Pathog (2020) 16(8):e1008762. doi:10.1371/journal.ppat.1008762
16. Wong NA, Saier MH. The SARS-coronavirus infection cycle: a survey of viral membrane proteins, their functional interactions and pathogenesis. Int J Mol Sci (2021) 22(3):1308. doi:10.3390/ijms22031308
17. Kuo L, Hurst-Hess KR, Koetzner CA, Masters PS. Analyses of coronavirus assembly interactions with interspecies membrane and nucleocapsid protein chimeras. J Virol (2016) 90(9):4357–68. doi:10.1128/JVI.03212-15
18. Guan WJ, Ni ZY, Hu Y, Liang WH, Ou CQ, He JX, et al. Clinical characteristics of coronavirus disease 2019 in China. N Engl J Med (2020) 382:1708–20. doi:10.1056/nejmoa2002032
19. Huang C, Wang Y, Li X, Ren L, Zhao J, Hu Y, et al. Clinical features of patients infected with 2019 novel coronavirus in Wuhan, China. Lancet (2020) 395(10223):497–506. doi:10.1016/S0140-6736(20)30183-5
20. Kumar S, Nyodu R, Maurya VK, Saxena SK. Host immune response and immunobiology of human SARS-CoV-2 infection. In: Coronavirus disease 2019 (COVID-19) (2020). p. 43–53. doi:10.1007/978-981-15-4814-7_5
21. Cecilia C, Wang H, Ebrahimi OV. Adjustment to a “new normal:” coping flexibility and mental health issues during the COVID-19 pandemic. Front Psychiatry (2021) 12:353. doi:10.3389/fpsyt.2021.626197
22. Peck MK, Lauring SA. Complexities of viral mutation rates. J Virol (2021) 92:e01031–17. doi:10.1128/JVI.01031-17
23. Ponzoni L, Bahar I. Structural dynamics is a determinant of the functional significance of missense variants. PNAS (2018) 115:4164–9. doi:10.1073/pnas.1715896115
24. Xiaofeng Z, Jiumeng S, Ziqing Y, et al. Comparison of severe acute respiratory syndrome coronavirus 2 spike protein binding to ACE2 receptors from human, pets, farm animals, and putative intermediate hosts. J Virol (2021) 94:e00831–20. doi:10.1128/JVI.00831-20
25. Martí D, Torras J, Bertran O, Turon P, Alemán C. Temperature effect on the SARS-CoV-2: a molecular dynamics study of the spike homotrimeric glycoprotein. Comput Struct Biotechnol J (2021) 19:1848–62. doi:10.1016/j.csbj.2021.03.037
26. Doremalen N, Bushmaker T, Morris DH, Holbrook MG, Gamble A, Williamson BN, et al. Aerosol and surface stability of SARS-CoV-2 as compared with SARS-CoV-1. N Engl J Med (2020) 382:1564–7. doi:10.1056/NEJMc2004973
27. Zou L, Ruan F, Huang M, Liang L, Huang H, Hong Z, et al. SARS-CoV-2 viral load in upper respiratory specimens of infected patients. N Engl J Med (2020) 382(12):1177–9. doi:10.1056/NEJMc2001737
28. Peeri NC, Shrestha N, Rahman MS, Zaki R, Tan Z, Bibi S, et al. The SARS, MERS, and novel coronavirus (COVID-19) epidemics, the newest and biggest global health threats: what lessons have we learned? Int J Epidemiol (2020) 49(3):717–26. doi:10.1093/ije/dyaa033
29. Mandal N, Padhi AK, Rath SL. Molecular insights into the differential dynamics of SARS-CoV-2 variants of concern. J Mol Graphics Model (2022) 114:108194. doi:10.1016/j.jmgm.2022.108194
30. Kirchdoerfer RN, Cottrell CA, Wang N, Pallesen J, Yassine HM, Turner HL, et al. Pre-fusion structure of a human coronavirus spike protein. Nature (2016) 531(7592):118–21. doi:10.1038/nature17200
31. Yap TF, Liu Z, Shveda RA, Preston DJ. A predictive model of the temperature-dependent inactivation of coronaviruses. Appl Phys Lett (2020) 117(6):060601. doi:10.1063/5.0020782
32. Webb B, Sali A. Comparative protein structure modeling using MODELLER. Curr Protoc Bioinformatics (2016) 54:5.6.1–2. doi:10.1002/cpps.20
33. Venkatakrishnan AJ, Fonseca R, Anthony KM, Scott A, Hollingsworth AC, Hilger D, et al. Uncovering patterns of atomic interactions in static and dynamic structures of proteins. bioRxiv (2019). doi:10.1101/840694
34. Casalino L, Gaieb Z, Goldsmith JA, Hjorth CK, Dommer AC, Harbison AM, et al. Beyond shielding: the roles of glycans in the SARS-CoV-2 spike protein. ACS Cent Sci (2020) 6(10):1722–34. doi:10.1021/acscentsci.0c01056
35. Abraham M, Murtola T, Schulz R, Páll S, Smith JC, Hess B, et al. GROMACS: high performance molecular simulations through multi-level parallelism from laptops to supercomputers. SoftwareX (2015) 1–2:19–25. doi:10.1016/j.softx.2015.06.001
36. Brooks BR, Brooks CL, MacKerell AD, Nilsson L, Petrella RJ, Roux B, et al. CHARMM: the biomolecular simulation program. J Comput Chem (2009) 30:1545–614. doi:10.1002/jcc.21287
37. Mark P, Nilsson L. Structure and dynamics of the TIP3P, SPC, and SPC/E water models at 298 K. The J Phys Chem A (2001) 105(43):9954–60. doi:10.1021/jp003020w
38. MacKerell AD, Bashford D, Bellott M, Dunbrack RL, Evanseck JD, Field MJ, et al. All-atom empirical potential for molecular modeling and dynamics studies of proteins. J Phys Chem B (1998) 102(18):3586–616. doi:10.1021/jp973084f
39. Makov G, Payne MC. Periodic boundary conditions in ab initio calculations. Phys.Rev B (1995) 51(7):4014–22. doi:10.1103/PhysRevB.51.4014
40. Ke Q, Gong X, Liao S, Duan C, Li L. Effects of thermostats/barostats on physical properties of liquids by molecular dynamics simulations. J Mol Liquids (2022) 365:120116. doi:10.1016/j.molliq.2022.120116
41. Darden T, York D, Pedersen L. Particle mesh Ewald: an N·log(N) method for Ewald sums in large systems. J Phys Chem B (1993) 98:10089–92. doi:10.1063/1.464397
42. David CC, Jacobs DJ. Principal component analysis: a method for determining the essential dynamics of proteins. Methods Mol Biol (2014) 1084:193–226. doi:10.1007/978-1-62703-658-0_11
43. Kumari R, Kumar R. Open source drug discovery consortiumg_mmpbsa-a GROMACS tool for high-throughput MM-PBSA calculations. J Chem Inf Model (2014) 54(7):1951–62. doi:10.1021/ci500020m
44. Humphrey W, Dalke A, Schulten K. VMD: visual molecular dynamics. J Mol Graph (1996) 14(1):33–8. doi:10.1016/0263-7855(96)00018-5
45. DeLano W. The PyMOL molecular graphics system, version 1.2r3pre. United States: Schrödinger, LLC (2010).
46. Tekpinar M, Neron B, Delarue M. Extracting dynamical correlations and identifying key residues for allosteric communication in proteins by correlationplus. J Chem Inf Model (2021) 61(10):4832–8. doi:10.1021/acs.jcim.1c00742
47. Yu H, Dalby PA. Exploiting correlated molecular-dynamics networks to counteract enzyme activity-stability trade-off. Proc Natl Acad Sci U S A (2018) 115(52):E12192–E12200. doi:10.1073/pnas.1812204115
48. Kasahara K, Fukuda I, Nakamura H. A novel approach of dynamic cross correlation analysis on molecular dynamics simulations and its application to Ets1 dimer–DNA complex. PLOS ONE (2014) 9:e112419. doi:10.1371/journal.pone.0112419
49. Prévost J, Richard J, Gasser R, Ding S, Fage C, Anand SP, et al. Impact of temperature on the affinity of SARS-CoV-2 Spike glycoprotein for host ACE2. J Biol Chem (2021) 297(4):101151. doi:10.1016/j.jbc.2021.101151
50. Gong SY, Ding S, Benlarbi M, Chen Y, Vézina D, Marchitto L, et al. Temperature influences the interaction between SARS-CoV-2 spike from Omicron subvariants and human ACE2. Viruses (2022) 14(10):2178. doi:10.3390/v14102178
51. Rath SL, Kumar K. Investigation of the effect of temperature on the structure of SARS-CoV-2 spike protein by molecular dynamics simulations. Front Mol Biosci (2020) 7:583523. doi:10.3389/fmolb.2020.583523
52. Abraham JP, Plourde BD, Cheng L. Using heat to kill SARS-CoV-2. Rev Med Virol (2020) 30(5):e2115. doi:10.1002/rmv.2115
Keywords: SARS-CoV-2, VOCs, RBD, ACE2, temperature
Citation: Mandal N and Rath SL (2024) Evaluating the Spike–hACE2 interactions in the wild type and variants of concern of SARS -CoV-2 at different temperatures. Front. Phys. 11:1320437. doi: 10.3389/fphy.2023.1320437
Received: 12 October 2023; Accepted: 14 December 2023;
Published: 05 January 2024.
Edited by:
Mohana Priya Arumugam, Vellore Institute of Technology, IndiaReviewed by:
Parimal Kar, Indian Institute of Technology Indore, IndiaCopyright © 2024 Mandal and Rath. This is an open-access article distributed under the terms of the Creative Commons Attribution License (CC BY). The use, distribution or reproduction in other forums is permitted, provided the original author(s) and the copyright owner(s) are credited and that the original publication in this journal is cited, in accordance with accepted academic practice. No use, distribution or reproduction is permitted which does not comply with these terms.
*Correspondence: Soumya Lipsa Rath, c2xyYXRoQG5pdHcuYWMuaW4=
Disclaimer: All claims expressed in this article are solely those of the authors and do not necessarily represent those of their affiliated organizations, or those of the publisher, the editors and the reviewers. Any product that may be evaluated in this article or claim that may be made by its manufacturer is not guaranteed or endorsed by the publisher.
Research integrity at Frontiers
Learn more about the work of our research integrity team to safeguard the quality of each article we publish.