 Andrey Zakharov
 Daria Ponomareva1,3,4
 Elena Petukhova
 Piotr Bregestovski
- 1Department of Physiology, Kazan State Medical University, Kazan, Russia
- 2Laboratory of Neurobiology, Kazan Federal University, Kazan, Russia
- 3Institute of Neuroscience, Kazan State Medical University, Kazan, Russia
- 4Aix-Marseille Université, INSERM, Institut de Neurosciences des Systèmes (INS) UMR1106, Marseille, France
Current research uses various fluorescent biosensors to measure ion concentrations, neuronal activity, or cellular components in biological preparations. Several free solutions are available to researchers for recording or analysing fluorescent signals. However, when using different software packages, there are great difficulties in converting data between them. Problems also arise with linking and coordination of individual hardware devices into a single measurement system. Our paper presents useful software that allows to avoid most of these problems. It enables the recording, online visualization and preliminary analysis of fluorescent signals in brain cells and other experimental models. We describe and test software optimized for ratiometric measurements. The program selects device operating modes that allow reliable changes in illumination wavelength, camera image capture, and online graphical visualization of fluorescent signal amplitudes or ratiometric data. The performance of the software was successfully tested on mouse brain using two experimental models; i) simultaneous monitoring of intracellular chloride and hydrogen in transgenic mice expressing genetically encoded biosensor; ii) recording changes in reactive oxygen species during synaptic stimulation of neurons in mouse hippocampal slices. This software allows to overcome the incompatibility of the devices used and reduce the cost of experimental measurements. The software is completely original, easy to use and may be of interest to many scientists involved in the analysis of light-controlled signals in a variety of experimental models, including drug screening, epilepsy models, and other applications. The software is open-source product and can be obtained via GitHub: https://github.com/AndreyZakharovExp/DriveLEDs.
1 Introduction
Modern studies of function of cells and cellular communications require a constant expansion of experimental approaches: from electron microscopy and electrophysiology to crystal structure and fluorescence analysis. Thanks to the achievements of molecular genetics and chemical synthesis, in recent years, such areas as optogenetics, optopharmacology, and optosensory have been developed, which make it possible to study the functions of cells, control their activity, and measure the concentrations of ions and other cellular components using light [1–3]. Registration and analysis of light-induced and fluorescent signals require the creation of specialized programs that effectively provide selective stimulation with light of various wavelengths, as well as the reception and processing of information [4–6]. In world practice, there are free access programs, as well as many commercial programs created to service various types of video cameras, controllers for supplying light, as well as processing the results obtained [7–9]. It has been also developed software for analysis of dynamic fluorescence imaging data [10–12]. However, various experimental models and tasks, as well as specific configurations of installations, require the creation of personalized programs. It is often the case that the custom software developed by one team cannot easily be incorporated by other laboratories because the data are acquired differently or researches use specific set of experimental equipment.
Consequently, the lack of a simple, easy to use resource for recording and online validation of acquired information limits the effectiveness of obtaining reliable experimental results. In addition, advancement in scientific research is ensured not only by the creation of fundamentally new measurement tools, but also by reducing the cost of known techniques and providing free access to them for researchers. One of the ways to develop hardware-analytical research tools is to create tools with an open architecture and open software code. This would allow multiple teams to make their own changes to the algorithms of equipment operation and data processing programs, providing a quick search for the most optimal ways to conduct research procedures.
To address this need, we created a new software package for controlling of experimental equipment, recording and online analysis of fluorescent processes in living cells. The program allows to selects device operating modes that provide reliable changes in illumination wavelength and intensity, camera image capture, and online graphical visualization of fluorescent signal amplitudes or ratiometric data. Using brain slices from wild-type and transgenic mice expressing a genetically encoded biosensor of hydrogen and chloride [13], we successfully tested the performance of the software using two experimental models: i) simultaneous monitoring of intracellular chloride (Cl−) and hydrogen (H+) during synaptic stimulation; ii) recording changes in reactive oxygen species during synaptic stimulation of mouse hippocampal neurons.
The presented software package is completely original; the tool is quite simple and easy to use. It may be of interest for the analysis of many types of fluorescent signals in various experimental models, including drug screening, epileptic disorders and other studies. The created software package ensures the most efficient (in terms of performance) use of the hardware capabilities without the need to use additional switching and matching devices. The software is open-source and freely available on GitHub, so users can make changes to suit their needs and contribute to the improvement and expansion of the toolbox.
2 Materials and methods
2.1 Animals
Experiments were performed on laboratory ICR CD-1 outbred mice of both genders and transgenic mice, strain C57BL/6N, expressing ClopHensor [13]. All animal protocols and experimental procedures were approved by the Local Ethics Committee of Kazan State Medical University (N742.13.11.84 and N1045-72) and by the INSERM Ethics Committee for Animal Experimentation (#30-03102012). The mice had free access to food and water and were exposed to natural fluctuations in day length. The animals had not participated in any previous procedures.
2.2 Experimental setup for fluorescence imaging
Fluorescence images were acquired using an upright microscope Olympus BX51WI equipped with the iXon Life 897 EMCCD camera (Andor, Oxford Instruments, Abingdon, United Kingdom), a 4-Wavelength LED Source (LED4D001, Thorlabs, Newton, NJ, United States) accompanied with a Four-Channel LED Driver (DC4100, Thorlabs), a quad-band filter set (Cat# 9403, Chroma, Foothill Ranch, CA, United States), and a water-immersion objective (60 magnification, 1 numerical aperture; LumPlanFL N, Olympus, Tokyo, Japan) (Figure 1A).
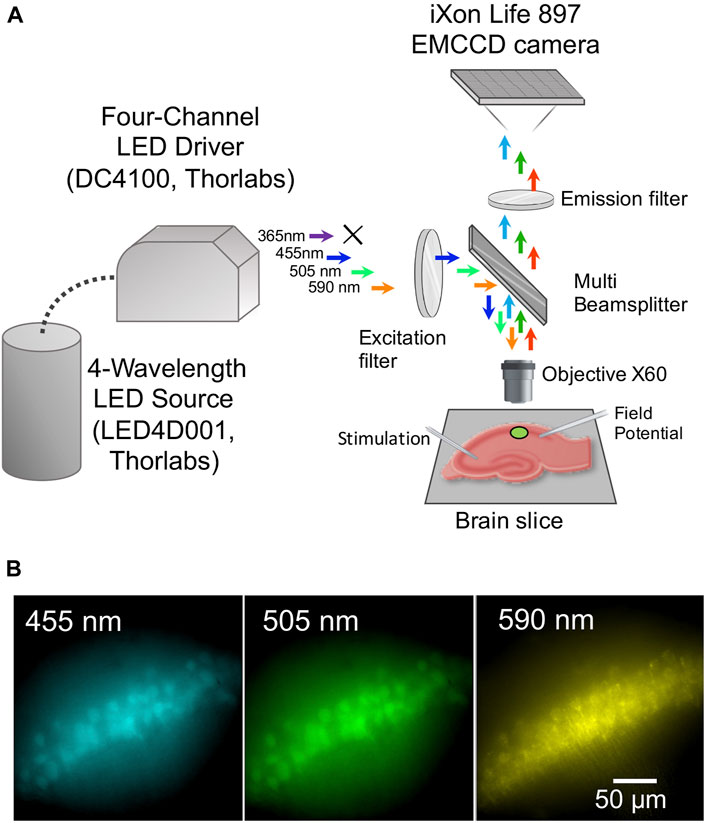
FIGURE 1. Experimental setup and fluorescence of brain neurons of transgenic mice expressing a genetically encoded biosensor. (A) Scheme of the experimental setup. (B) Micrographs of pyramidal cells in the CA1 hippocampal region of a mouse brain slice, expressing ClopHensor, under illumination with excitation light wavelengths of 455 nm (recorded at 460–485 nm), 505 nm (recorded at 527–550 nm) and 590 nm (recorded at 600–620 nm).
2.3 Monitoring of intracellular Cl− and H+ in brain slices from transgenic mice expressing ClopHensor
The 4-Wavelength LED Source was supplied by light-emitting diodes (LEDs) with wavelengths of 365, 455, 505, and 590 nm, the last three of which were used in our study.
The lighting power and the order of turning on the LEDs were adjusted via the DC4100 driver. Fluorescence from the blue channel (455 nm excitation) was detected from 460 to 485 nm, green channel (505 nm excitation) from 527 to 551 nm, and red channel (590 nm excitation) from 600 to 680 nm.
Fluorescent emission was recorded continuously from the hippocampal CA1 pyramidal cells (Figure 1B) with a sampling interval of 1–10 s. To induce rapid changes in fluorescence through synaptic stimulation of Schaffer collaterals, a glass bipolar electrode filled with ACSF was placed in the stratum radiatum of the CA2 hippocampal area.
2.4 Monitoring of pH using BCECF
To load the dye in neurons, hippocampal slices were stained with 10 µM BCECF-AM for 40 min in the oxygenated ACSF. Then the dye was washed off and slices were superfused with normal ACSF for at least 40 min to allow esterases to cleave AM and stabilise intracellulat pH. For fluorescent monitoring, slices were transferred to an optical recording chamber mounted on the stage of an upright microscope (Olympus BX51WI).
Changes in pH were determined by calculating the ratio of the two emission signals obtained after illumination with light at 455 and 505 nm (recorded emission wavelength above 600 nm). Changes in intracellular pH were induced by tetanic stimulation (100 Hz for 20 s).
2.5 Monitoring the formation of reactive oxygen species (ROS)
CellRox Orange is cell-permeant dye, that exhibits fluorescence upon oxidation by ROS. To load cells with the dye, sagittal hippocampal slices of 20–34-days-old mice were transferred into a microchamber with 2 mL ACSF containing 5 µM of the ROS-sensitive fluorescent dye CellRox Orange.
Slices were incubated at room temperature with oxygenation for 40 min and then 40 min in regular ACSF. For fluorescence monitoring, slices were placed in a recording chamber superfused with oxygenated ACSF at 32°C. Fluorescent intensity was recorded at an excitation of 505 nm, a duration of 700 ms, and a frequency of 1 Hz.
2.6 Software development
The software was developed in C++ using Embarcadero RAD Studio XE2 (C++ Builder). The Andor Software Development Kit (Oxford Instruments, United Kingdom) and the NI VISA runtime engine (National Instruments, United States) for the Windows platform were linked to provide correct work of the Andor and Thorlabs hardware.
3 Results
3.1 Problem statement
Creators of software packages that provide recording and analysis of cell fluorescent signals are faced with a number of tasks and problems. In particular, it is necessary:
1. To control a light generator that provides illumination at different wavelengths, with different durations and intensities.
2. To control the process of capture by the CCD-camera of the fluorescent signals emitted by the cells.
3. To display graphs of the received signals on the computer screen during the experiment and also perform subsequent detailed analysis.
Here, we announce a new, user-friendly and open source program which allows to perform all these tasks.
3.2 Measurement algorithm
The measurement procedure carried out within the framework of the studies for which the program was developed, involves periodic short-term illumination of the preparation at one of the available wavelengths using the Thorlabs DC4100 device and measuring the intensity of the response light using the Andor iXon 897 high-speed camera. At the same time, it is necessary to minimize the duration and intensity of illumination, but so that a signal of sufficient magnitude accumulates during the exposure. Another obvious requirement for the measurement procedure is the beginning of the exposure on the CCD strictly after setting the specified glow intensity of the selected diode and turning off the lighting strictly after the end of the exposure.
The general scheme of the measurement algorithm is divided into the following stages: 1) preparation of the LED system; 2) formation of the luminous flux; 3) image capture; 4) data analysis; 5) visualization; 6) data storage (Figure 2A).
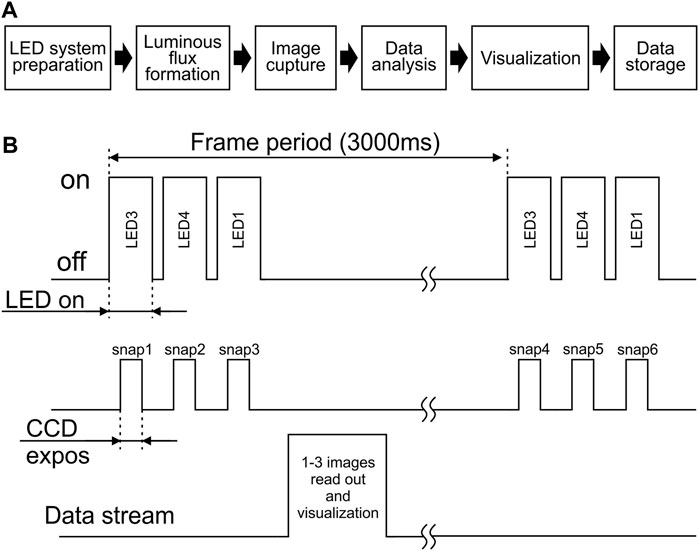
FIGURE 2. Schematic presentation of the measuring procedure. (A) Main steps of the measurement algorithm. (B) General scheme for switching on/off the diodes and CCD matrix of the camera.
To implement this scheme, the experimenter independently selects the number of acquisition frames (one frame includes the measurement of fluorescents signals at single activation of all selected LEDs), the time interval between successive frames, the duration of exposure and duration of the diodes illumination (Figure 2B).
The necessary delays between the commands to turn on and off the diodes and the camera are embedded in the program code and are hidden from the user.
3.3 Preparation of the LED system
The peculiarity of the Thorlabs DC4100 lighting system is that the physically switching the selected LED requires a long time to complete the power circuit. With such delays (>100 ms), the time scatter between measurements at different wavelengths increases significantly, which can lead to a ratiometric errors.
For this reason, the necessary diodes are switched before the entire measurement procedure begins, and the desired brightness at each wavelength is selected through a programmable light intensity setting that is controlled by voltage inside the Thorlabs DC4100 device.
The “LED Configuration” section of the main program window (Figure 3A) allows you to select; i) required diodes (column “use”); ii) order of diodes activation (column “order”); iii) the light level when switched on (column “Voltage”) and iv) duration of the active state (column “LED On”) separately for each LED.
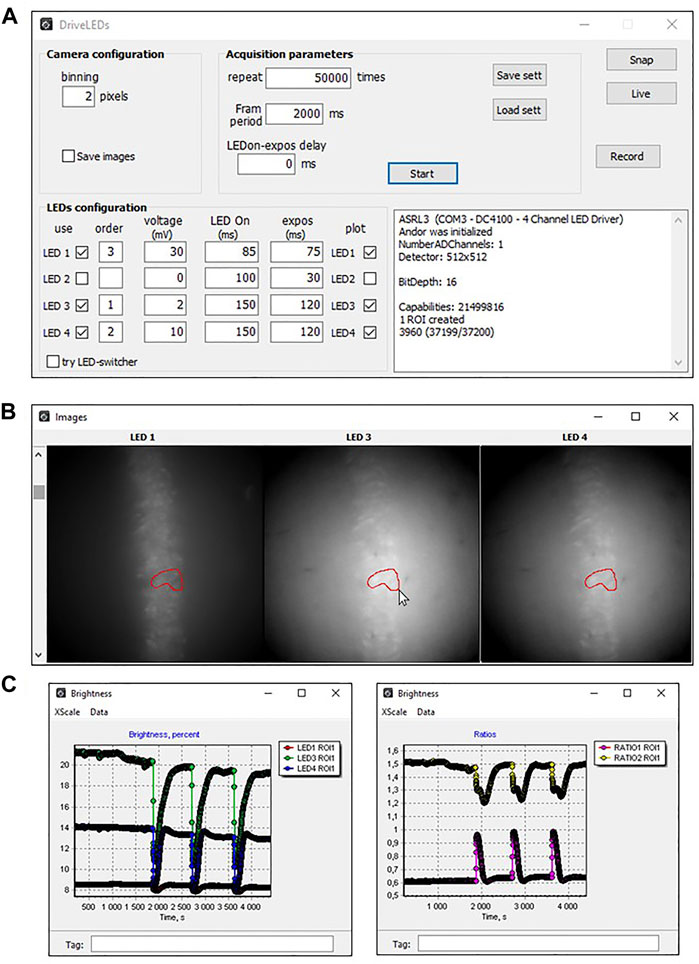
FIGURE 3. View of DriveLED program windows when recording fluorescence from hippocampal neurons of mice expressing ClopHensor. (A) An example of a set of parameters used to register changes in fluorescence intensity of hippocampal slice neurons expressing ClopHensor. (B) Actual images of hippocampal neurons expressing ClopHensor illuminated with 3 diodes: LED1—590 nm, LED3—505 nm, LED4—455 nm. (C) Traces of fluorescence changes of each channel (left) and their ratios (right), recorded online. Ratios were calculated as RpH = ∆F505nm/∆F455nm (top trace) and RCl = ∆F590nm/∆F455nm (bottom trace). Sharp changes in fluorescence are induced by stimulation of Shaffer collaterals, causing the synaptic release of neurotransmitter and changes in Cl− and H+ concentrations.
One can check the readiness of the LED system for measurement by checking the “try LED switch” checkbox. In this case, all diodes with the “LED” flags (the “use” column) and non-zero luminosities by the amplitude of the controlling voltage (the “voltage” column) will turn on.
3.4 Formation of luminous flux
After setting the number of frames and the period between them in the “Acquisition parameters” section (Figure 3A), one must click the “Start” button to begin the measurement. When the “Start” button is pressed, first of all, the voltages on all LEDs are reset and the unused LEDs are physically turned off, while the used LEDs are turned on. Then, in accordance with the specified order of switching on the diodes, a command is sent to the illuminator to supply the appropriate voltage to the first diode. The supply voltage is reset to zero after the ON-time has expired. Time is counted according to the processor time with an accuracy of microseconds. The process is then repeated for the next diodes in turn. After a pause between frames, the entire sequence is repeated.
3.5 Image capture
The minimum delay time between the command to turn on the diode and the command to turn on the exposure to the camera’s CCD sensor is 1,3 milliseconds, and the time required to achieve a steady-state level of illumination of the diodes does not exceed 100 microseconds (https://tech-led.com/wp-content/uploads/2017/09/SMBB525V-1100-021.pdf). The delay ensures that the image begins to be exposed when it has reached a steady-state intensity.
The duration of exposure is set for each wavelength separately, which allows you to obtain the optimal intensity for each wavelength channel. The exposure duration is maintained by the camera hardware and exactly corresponds to the specified values. Transferring images from the camera’s memory buffer to the computer occurs during a pause between frames. This approach reduces the time between exposures at different wavelengths, thereby reducing the error in ratiometric measurements for fast processes.
3.6 Data analysis and graphical visualization
Before starting measurements, the researcher selects the required number of regions of interest (ROI). The Figure 3B shows the view of the preparation after illumination with three LEDs (LED1, LED3, and LED4) and an example of the ROI outlined by the researcher in one of the images, which automatically displayed in the remaining images. The data received from the camera are immediately subjected to preliminary analysis and displayed online on the screen in the form of a graph (Figure 3C).
During the experiment, the researcher can alternatively visualize the results as plots of fluorescence intensity for each wavelength (Figure 3C, left graph) or results from ratiometric analysis (Figure 3C, right graph). This provides visual feedback on the results obtained and allows, if necessary, to modify the experimental procedure. During subsequent offline analyses of the results obtained, one can select any number of ROIs and construct the corresponding graphs.
3.7 Data storage
Images are saved to the computer’s hard drive as they are received in the pauses between frames in “tiff” format. This approach makes it possible not to overload the computer’s RAM during long-term experiments and increases the reliability of storing measurement results. After the last frame of measurement is completed, or when the “Stop” button is pressed, the experiment stops. If the “Stop” button was pressed before the scheduled end of the measurements, the measurement is completed for all the diodes involved and only then the program ends.
After that, according to the number of diodes involved, the procedure for saving the results of image processing into text files is started. Each file contains the turn-on time of the diode, the fluorescence intensity of the object in each ROI and text labels entered by the researcher (addition of new drug, wash, etc.)
Users can also review the collected data. The “reCalc” buttons call up a dialog for opening selected images (Files reCalc) or all images in the directory (Dir reCalc). After selecting the images, it is necessary to determine the appropriate ROI and press the “Start” button.
3.8 Examples of fluorescent signals recording using DriveLEDs software
To test the reliability and efficiency of the software, we used DriveLEDs to record and analyze fluorescence data in several experimental models.
3.8.1 Three wavelength excitation recording of Cl− and H+ in neurons of transgenic mice expressing ClopHensor
In experiments aimed to monitor concentrations of intracellular Cl− and H+ in neurons of brain slices, we used transgenic mice expressing ClopHensor [13]. This biosensor consists of a modified enhanced green fluorescent protein E2GFP (ion sensitive) linked to monomeric DsRed (mDsRed) through a flexible 20 amino acid linker [14–16]. It was previously shown [14] that excitation spectra of ClopHensor collected at different pH values (from 5.9 to 8.4) in the absence of Cl−, demonstrate maximal changes in fluorescence emission intensity in the wavelength region 500–510 nm, as well as presence of isosbestic point (≈458 nm) at which the emission intensity of E2GFP is independent of pH (Figure 4A, left).
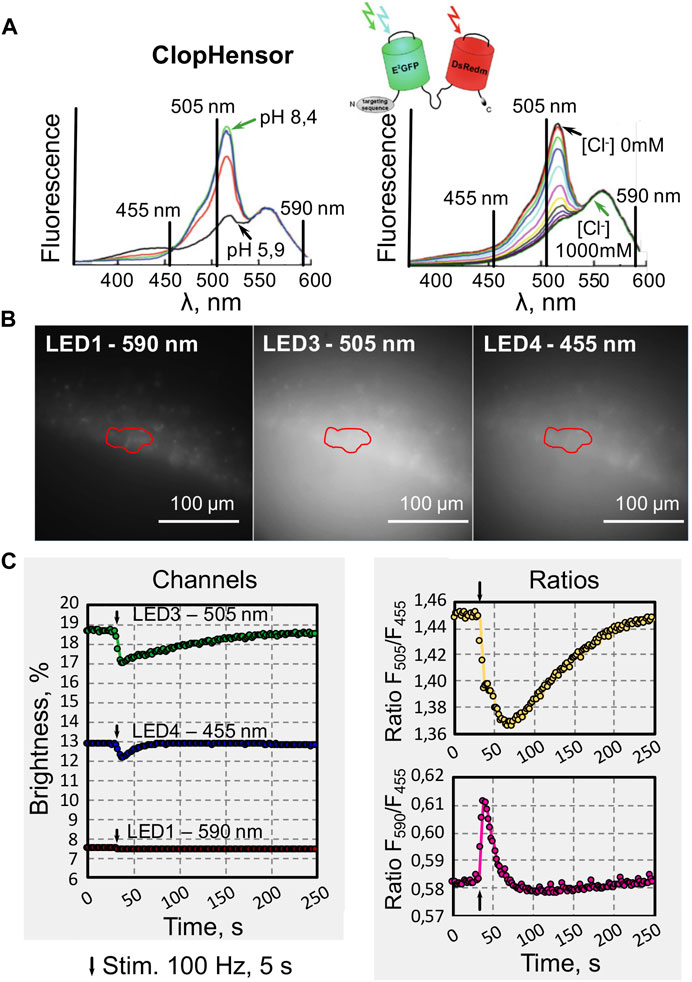
FIGURE 4. Examples of recording changes in the fluorescence intensity of hippocampal neurons from slices of transgenic mice expressing a biosensor for simultaneous monitoring of Cl− and H+ (ClopHensor). (A) Schematic representation of ClopHensor design and its excitation spectra at different pH values (5.9–8.4) in the absence of Cl− (left) and with increasing Cl− concentration (0–1 M) and constant pH = 6.9 (right) (modified from [14]). The vertical lines indicate the wavelength of LEDs used in our experiments. (B) Examples of images obtained from the СA1 area of a hippocampal slice with a selected region of interest (ROI) recorded during excitation using LEDs with different wavelengths (as indicated). (C) Online plot of fluorescence changes (left) evoked by synaptic stimulation of hippocampal CA1 neurons recorded at three different wavelengths: 505 nm (green), 455 nm (blue) and 590 nm (red). Online visualization of ratiometric data (right) of the same record illustrating changes in Cl− (top) and H+ (bottom) concentrations during synaptic stimulation (black arrows indicate stimulation moments).
Emission spectra of the ClopHensor construct after excitation collected at pH 6.9 and [Cl−] from 0 to 1 M are shown in Figure 4A, right graph. The presence of an isosbestic point makes it possible to perform ratiometric analysis of changes in H+ concentration, as well as assessment of pH-independent changes in Cl− concentrations. In addition, at wavelengths above 543 nm, the signals of both fluorescent proteins, E2GFP and mDsRed, are independent of pH- and Cl−-(Figure 4A). This allows for additional ratiometric analysis.
In total, to simultaneously record changes in the concentrations of H+ and Cl−-, the preparation should be successively excited in three wavelength ranges:
1) 485–510 nm—for recording pH-and Cl−-dependent E2GFP signal.
2) 455–460 nm—for recording pH-independent E2GFP signal (isosbestic point, when E2GFP’s emission intensity does not depend on pH).
3) above 540 nm: for recording Cl−-and pH-independent mDsRed signals.
Changes in concentrations of H+ and Cl− ions can be estimated using the following ratios:
Our setup is equipped with light-emitting diodes (LEDs) at wavelengths of 365, 455, 505, and 590 nm. For H+ and Cl− analysis, we used three wavelength channels (455, 505, and 590 nm) and the illumination intensity was controlled using the DC4100 driver. So, under the conditions of our experiment, the change in the concentrations of H+ and Cl− ions was assessed using the following relationships:
Microphotographs of hippocampal neurons obtained in the DriveLEDs program during illumination with the indicated diodes are presented in Figure 4B and in Figure 4C (left). An example of online visualization of fluorescent signal intensities induced by sequential illumination of ClopHensor-expressing neurons in mouse hippocampal brain slice is shown.
The level of steady-state fluorescence depends on the duration and intensity of each LED illumination. This also depends on the spectral properties of the ClopHensor when illuminated with different wavelengths. High frequency stimulation of Shaffer collaterals leads to massive activation of glutamatergic synapses, causing depolarization of neurons and, as a consequence, an increase in intracellular Cl− and H+. This is manifested by a decrease in fluorescence recorded at illumination by LED 3 (505 nm) and LED 4 (455 nm). As expected from excitation spectra of ClopHensor (Figure 4A), the fluorescence level upon activation of LED 1 (590 nm) did not change during the synaptically induced increase in intracellular Cl− and H+ concentrations.
Using ratios Eqs 3 and 4 the system determines the rations corresponding to changes in Cl− and H+ concentrations (Figure 4C, right). The experimenter can observe online, during recording, either the traces for each channel or the ratios, switching between graphs at will.
3.8.2 Two wavelength excitation recording of intracellular H+
As another experimental approach to testing the DriveLEDs software, we analyzed pH changes by calculating the ratio of the two emission signals. A pH-sensitive dye, 2′,7′-Bis(2-carboxyethyl)-5(6)-carboxyfluoresceinacetoxymethyl ester (BCECF-AM) was used for this purpose (Figure 4A). This dye provides ratiometric monitoring of the intracellular H+ concentration under dual excitation, because BCECF-AM excitation spectra obtained at different pH values have an isosbestic point that can be used to normalize the fluorescence data (Figure 5A, right) [17].
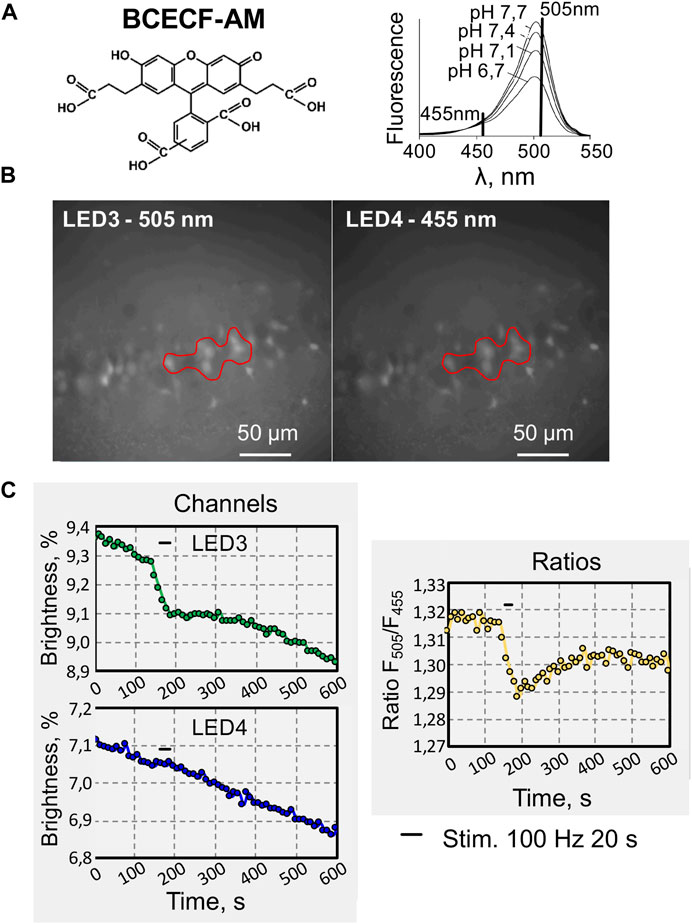
FIGURE 5. An example of recording changes in fluorescence intensity when using two excitation wavelengths of a fluorescent dye. (A) Chemical structure (left) of 2′,7′-Bis (2-carboxyethyl)-5 (6)-carboxyfluoresceinacetoxymethyl ester (BCECF-AM), cell-permeable, dual-excitation ratiometric pH indicator. Excitation spectra (right) of BCECF collected at different pH values (modified from [17]). (B) Micrographs of hippocampal CA1 pyramidal cells loaded with BCECF-AM, under illumination with excitation wavelengths of 505 nm and 455 nm. (C) Online traces of recording fluorescence intensity changes evoked by high-frequency electrical stimulation (200 μA, 100 Hz for 20 s) of hippocampal CA1 neurons. Recording at two wavelengths: 505 and 455 nm (left) and also for their ratio (F505nm/F455nm, right).
BCECF pH measurements were determined by calculating the pH-dependent emission intensity ratio when it was excited at 505 nm (LED 3) compared to the emission intensity when it was excited at 455 nm, the pH-independent point (LED 4) (Figure 5B). Since BCECF-AM is highly susceptible to bleaching, the fluorescence intensity recorded on both channels, continuously declined (Figure 5C). Tetanic stimulation of Shaffer collaterals caused reversible decrease of fluorescence on the pH-sensitive channel (505 nm) (Figure 5C, green trace), indicating acidification of neurons, whereas this effect was absent when excitation was carried out at a wavelength of 455 nm, close to the isosbestic point (Figure 5C, blue trace). The ratiometric trace shows acidification of hippocampal neuros upon synaptic stimulation (Figure 5C, yellow trace).
3.8.3 Single wavelength excitation recording of reactive oxygen species (ROS)
To test the program, we also used the fluorescent dye CellRox Orange and recorded the emission signals under single wavelength excitation illumination.
CellRox Orange is cell-permeable dye, that alters fluorescence when oxidized by ROS. The excitation and emission spectra are presented on Figure 6A. We excited the dye with a wavelength of 505 nm (Figure 6B) and recorded the emission in the long wavelength range above 600 nm.
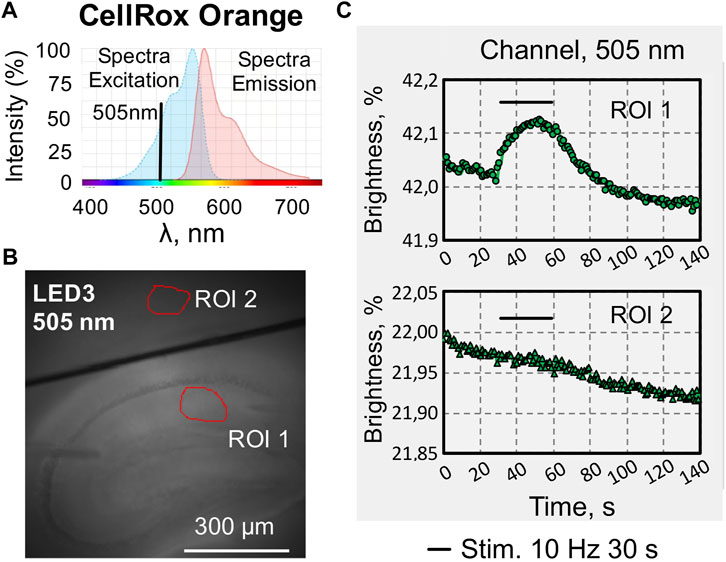
FIGURE 6. An example of recording changes in fluorescence intensity when using a fluorescent dye of one wavelengths excitation. (A) Excitation and emission spectra of CellRox Orange, a cell-permeant dye that exhibits enhanced fluorescence upon oxidation by reactive oxygen species (ROS) (modified from (www.thermofisher.com/order/catalog/product/C10443). (B) Photo of a sagittal slice of the hippocampus loaded with CellRox Orange with selected regions of interest in the stratum radiatum of CA1 hippocampal zone (ROI1), and in the cortex (ROI2), which was used as a reference zone for synaptic activation of hippocampal neurons. (C) Online graphs of changes in CellRox Orange fluorescence evoked by synaptic stimulation of Shaffer collaterals. Recording in the hippocampal CA1 area (ROI1, top graph) and in the cortex (ROI2, bottom graph).
Changes of CellRox Orange fluorescence were recorded on brain slices in the stratum radiatum of the hippocampal CA1 area (Figure 6C, top graph) and in the cortex (Figure 6C, bottom graph). Intracellular changes in ROS (increase in fluorescence intensity) evoked by stimulation of Shaffer collaterals in the hippocampus were calculated taking into account the reference zone in the cortex, where synaptic stimulation did not cause changes in fluorescence.
These examples illustrate the effectiveness, visual simplicity, and ease of use of the DriveLEDs program in various types of experimental tasks.
4 Discussion
The purpose of this work was to develop an open-source tool-box for: i) efficient control of LEDs that provide illumination of multiple specified wavelengths; ii) control of a highly sensitive camera for recording light images; iii) preliminary online analysis of recorded information; iv) online visualization of plots of raw or ratiometric fluorescence data; v) convenient offline image analysis.
Initially, the need to create new software tools arose from our own need to perform simultaneous recording changes in intracellular concentrations of hydrogen (H+) and chloride (Cl−) ions. These ions play an important role in the functioning of various cell types [18–20]. For fluorescent analysis of intracellular pH and Cl−, chemically synthesized and genetically encoded sensors providing monitoring of each of these ions have been created [21–24]. However, changes in intracellular concentrations of H+ and Cl− are interrelated [15,25,26]. This created the need for simultaneous recording changes in the intracellular concentrations of these ions.
This problem was resolved by creating a genetically encoded sensor called ClopHensor, consisting of an H+ and Cl− sensitive variant of green fluorescent protein (E2GFP) and a red fluorescent protein (mDsRed) that is insensitive to these ions [14]. This design has been shown to allow simultaneous monitoring of H− and Cl− in a variety of experimental models [14,27]. Moreover, we recently created a line of transgenic mice expressing ClopHensor in neurons [13]. To register and analyse the fluorescent signals recorded in the brain slices of these transgenic mice and in other preparations, it was necessary to create a specialized program.
There are several free solutions available to researchers via the Internet for recording and analyzing fluorescent signals. For instance, image processing and analysis tool, based on ImageJ-Fiji/MATLAB® software, to evaluate calcium homeostasis in cardiomyocytes [5] and the open-source tool-box for motion correction, segmentation, signal extraction, and deconvolution of calcium imaging data [11] were proposed. Also, earlier work describes open source Python package that facilitates common analysis tasks related to fluorescence imaging [10]. This package includes, in particular, correction of motion artifacts occurring during in vivo imaging with laser-scanning microscopy and segmentation of imaged fields into regions of interest (ROIs). However, when using different software packages, difficulties arise in converting data between them and combining in one package the tasks of monitoring experimental instruments and efficient data processing: including their online visualization.
To visualize fluorescent signals, our setup uses a highly sensitive Andor camera (iXon 897, Oxford Instruments), and to illuminate brain slices with different wavelengths, we are using a 4-wavelength high-power LED source LED4D001 (Thorlabs, United States). However, standard Andor software does not allow control of the LED source, and the manufacturer’s ThorLabs software cannot collect images. To solve this problem, we have created a set of software tools that provide a solution for efficient communication with available equipment.
Our DriveLEDs software was developed in C++. For this program to work correctly, one need an IBM architecture computer running Windows 7 operating system or higher. The amount of RAM must be at least 4 GB, and the free volume of the permanent storage must be at least 1 GB. The DriveLEDs program is suitable for use in the integrated system of any microscope equipped with the following serial devices: cameras manufactured by Andor (in particular iXon) and illuminators from Thorlabs (for example, DC4100). The operation of the program is based on the use of appropriate drivers and assumes compatibility with any equipment provided by these drivers.
The performance of the software was tested using a genetically encoded sensor for simultaneous monitoring of Cl− and H+ in neurons of transgenic mice, and using two chemical dyes to monitor changes in ROS and pH in brain slices of hippocampal neurons. It demonstrated good performance allowing the recording and online analysis of fluorescent signals using a 1-, 2-, or 3-wavelength excitation protocols.
Our results demonstrate that the created software facilitates the control of hardware, allows preliminary online analysis and visualisation of recorded data, as well as convenient offline analysis. Proposed open-source tool-box can be applied to perform analysis of fluorescent signals in a variety of experimental models, including drug screening, epilepsy models, and other applications. It is also possible to modify the software package for other sets of equipment. More precise configuration of the program for other devices is possible by making appropriate changes to the program code (available at https://github.com/AndreyZakharovExp/DriveLEDs).
Data availability statement
The original contributions presented in the study are included in the article/Supplementary Material, further inquiries can be directed to the corresponding author.
Ethics statement
The animal study was approved by the study was conducted according to the Guide for the Care and Use of Laboratory Animals (NIH Publication No. 85–23, revised 1996) and the European Convention for the Protection of Vertebrate Animals used for Experimental and other Scientific Purposes (Council of Europe No. 123; 1985). All animal protocols and experimental procedures were approved by the Local Ethics Committee of Kazan State Medical University. The study was conducted in accordance with the local legislation and institutional requirements.
Author contributions
AZ: Conceptualization, Methodology, Software, Writing–original draft. DP: Data curation, Formal Analysis, Methodology, Visualization, Writing–original draft, Writing–review and editing. EP: Formal Analysis, Methodology, Writing–original draft. PB: Conceptualization, Funding acquisition, Methodology, Project administration, Supervision, Validation, Writing–original draft, Writing–review and editing.
Funding
The author(s) declare financial support was received for the research, authorship, and/or publication of this article. This study was supported by the Russian Science Foundation (Grant: 18-15-00313).
Acknowledgments
We thank the Embassy of France in the Russia for providing a scholarship for DP.
Conflict of interest
The authors declare that the research was conducted in the absence of any commercial or financial relationships that could be construed as a potential conflict of interest.
The author(s) declared that they were an editorial board member of Frontiers, at the time of submission. This had no impact on the peer review process and the final decision.
Publisher’s note
All claims expressed in this article are solely those of the authors and do not necessarily represent those of their affiliated organizations, or those of the publisher, the editors and the reviewers. Any product that may be evaluated in this article, or claim that may be made by its manufacturer, is not guaranteed or endorsed by the publisher.
Abbreviations
LED, Light Emitting Diode; CCD, Charge-Cupled Device; PC, Personal Computer; ROI, Region Of Interest; RAM, Random Access Memory; ROS, Reactive Oxygen Species; ACSF, Artificial Cerebrospinal Fluid.
References
1. Sun Y, Li M, Cao S, Xu Y, Wu P, Xu S, et al. Optogenetics for understanding and treating brain injury: advances in the field and future prospects. Int J Mol Sci (2022) 23(3):1800. doi:10.3390/ijms23031800
2. Paoletti P, Ellis-Davies GC, Mourot A. Optical control of neuronal ion channels and receptors. Nat Rev Neurosci (2019) 20(9):514–32. doi:10.1038/s41583-019-0197-2
3. Bregestovski P, Maleeva G, Gorostiza P. Light induced regulation of ligand gated channel activity. Br J Pharmacol (2018) 175(11):1892–902. doi:10.1111/bph.14022
4. Stelzer EH, Strobl F, Chang BJ, Preusser F, Preibisch S, McDole K, et al. Light sheet fluorescence microscopy. Nat Rev Methods Primers (2021) 1(1):73. doi:10.1038/s43586-021-00069-4
5. Fassina L, Assenza MR, Miragoli M, Isidori AM, Naro F, Barbagallo F. Cell shortening and calcium homeostasis analysis in adult cardiomyocytes via a new software tool. Biomedicines (2022) 10(3):640. doi:10.3390/biomedicines10030640
6. Bansal A, Shikha S, Zhang Y. Towards translational optogenetics. Nat Biomed Eng (2022) 7:349–69. doi:10.1038/s41551-021-00829-3
7. Bergsman JB, Krueger SR, Fitzsimonds RM. Automated criteria-based selection and analysis of fluorescent synaptic puncta. J Neurosci Methods (2006) 152(1-2):32–9. doi:10.1016/j.jneumeth.2005.08.008
8. Bacia K, Kim SA, Schwille P. Fluorescence cross-correlation spectroscopy in living cells. Nat Methods (2006) 3(2):83–9. doi:10.1038/nmeth822
9. Dunsing V, Petrich A, Chiantia S. Multicolor fluorescence fluctuation spectroscopy in living cells via spectral detection. Elife (2021) 10:e69687. doi:10.7554/elife.69687
10. Kaifosh P, Zaremba JD, Danielson NB, Losonczy A. SIMA: Python software for analysis of dynamic fluorescence imaging data. Front neuroinformatics (2014) 8:80. doi:10.3389/fninf.2014.00080
11. Cantu DA, Wang B, Gongwer MW, He CX, Goel A, Suresh A, et al. EZcalcium: open-source toolbox for analysis of calcium imaging data. Front Neural circuits (2020) 14:25. doi:10.3389/fncir.2020.00025
12. Bogachev MI, Volkov VY, Markelov OA, Trizna EY, Baydamshina DR, Melnikov V, et al. Fast and simple tool for the quantification of biofilm-embedded cells sub-populations from fluorescent microscopic images. PLoS One (2018) 13(5):e0193267. doi:10.1371/journal.pone.0193267
13. Diuba AV, Samigullin DV, Kaszas A, Zonfrillo F, Malkov A, Petukhova E, et al. CLARITY analysis of the Cl/pH sensor expression in the brain of transgenic mice. Neuroscience (2020) 439:181–94. doi:10.1016/j.neuroscience.2019.07.010
14. Arosio D, Ricci F, Marchetti L, Gualdani R, Albertazzi L, Beltram F. Simultaneous intracellular chloride and pH measurements using a GFP-based sensor. Nat Methods (2010) 7:516–8. doi:10.1038/nmeth.1471
15. Bregestovski P, Arosio D. Green fluorescent protein-based chloride ion sensors for in vivo imaging. In: G Jung, editor. Fluorescent proteins II. Berlin, Heidelberg: Springer Berlin Heidelberg (2011). p. 99–124.
16. Ponomareva D, Petukhova E, Bregestovski P. Simultaneous monitoring of pH and chloride (Cl−) in brain slices of transgenic mice. Int J Mol Sci (2021) 22(24):13601. doi:10.3390/ijms222413601
17. Loiselle FB, Casey JR. Measurement of intracellular pH. In: Membrane transporters in drug discovery and development: methods and protocols (2010). 311–31.
18. Chesler M. Regulation and modulation of pH in the brain. Physiol Rev (2003) 83:1183–221. doi:10.1152/physrev.00010.2003
19. Waseem T, Mukhtarov M, Buldakova S, Medina I, Bregestovski P. Genetically encoded Cl-Sensor as a tool for monitoring of Cl-dependent processes in small neuronal compartments. J Neurosci Methods (2010) 193(1):14–23. doi:10.1016/j.jneumeth.2010.08.002
20. Doyon N, Vinay L, Prescott SA, De Koninck Y. Chloride regulation: a dynamic equilibrium crucial for synaptic inhibition. Neuron (2016) 89:1157–72. doi:10.1016/j.neuron.2016.02.030
21. Jankowski A, Kim JH, Collins RF, Daneman R, Walton P, Grinstein S. In situ measurements of the pH of mammalian peroxisomes using the fluorescent protein pHluorin. J Biol Chem (2001) 276 (52):48748–48753.
22. Matlashov ME, Bogdanova YA, Ermakova GV, Mishina NM, Ermakova YG, Nikitin ES, et al. Fluorescent ratiometric pH indicator SypHer2: applications in neuroscience and regenerative biology. Biochim Biophys Acta Gen Subj (2015) 1850 (11):2318–2328.
23. Kuner T, Augustine GJ. A genetically encoded ratiometric indicator for chloride: capturing chloride transients in cultured hippocampal neurons. Neuron (2000) 27 (3):447–459.
24. Markova O, Mukhtarov M, Real E, Jacob Y, Bregestovski P. Genetically encoded chloride indicator with improved sensitivity. J Neurosci Methods (2008) 170 (1):67–76.
25. Casey JR, Grinstein S, Orlowski J. Sensors and regulators of intracellular pH. Nat Rev Mol Cel Biol (2010) 11(1):50–61. doi:10.1038/nrm2820
26. Lodovichi C, Ratto GM, Trevelyan AJ, Arosio D. Genetically encoded sensors for Chloride concentration. J Neurosci Methods (2022) 368:109455. doi:10.1016/j.jneumeth.2021.109455
27. Mukhtarov M, Liguori L, Waseem T, Rocca F, Buldakova S, Arosio D, et al. Calibration and functional analysis of three genetically encoded Cl(-)/pH sensors. Front Mol Neurosci (2013) 6:9. doi:10.3389/fnmol.2013.00009
Keywords: fluorescent sensors, software, acquisition, measurement system, illumination, images capturing, brain slices, intracellular pH and chloride
Citation: Zakharov A, Ponomareva D, Petukhova E and Bregestovski P (2023) DriveLEDs: software for synchronous control and video acquisition of fluorescent signals. Front. Phys. 11:1283684. doi: 10.3389/fphy.2023.1283684
Received: 26 August 2023; Accepted: 08 December 2023;
Published: 21 December 2023.
Edited by:
Nikolaos Cheimarios, NovaMechanics Ltd., CyprusReviewed by:
Fengjuan Wang, Southeast University, ChinaGerd M. Seibold, Technical University of Denmark, Denmark
Copyright © 2023 Zakharov, Ponomareva, Petukhova and Bregestovski. This is an open-access article distributed under the terms of the Creative Commons Attribution License (CC BY). The use, distribution or reproduction in other forums is permitted, provided the original author(s) and the copyright owner(s) are credited and that the original publication in this journal is cited, in accordance with accepted academic practice. No use, distribution or reproduction is permitted which does not comply with these terms.
*Correspondence: Piotr Bregestovski, cGJyZWdlc0BnbWFpbC5jb20=