 Kyongok Kang
- Forschungszentrum Juelich, Institute of Biological Information Processing, (IBI-4), Biomacromolecular Systems and Processes, Juelich, Germany
This paper presents the microscopic dynamics of the concentrated suspensions of bovine serum albumin (BSA) proteins and their aggregates by dynamic light scattering (DLS) experiments. The effects of fatty acids binding to BSA, as well as the ionic strength and weak electric field, are discussed for affecting the stability of BSA suspensions against calcium-induced aggregation. By variation of the ionic strength, in the absence of an external electric field, DLS experiments show that monomer–BSA interactions (in the essentially fatty acid-free case) are overall repulsive but that, nevertheless, aggregation occurs to some extent. Also, the diffusive properties of different types of BSA are explored under an applied low-AC electric field by means of in situ electric small-angle depolarized DLS experiments, which reveal a significant decrease of the translational BSA–monomer diffusion coefficient with increasing frequency, while the aggregates indicate orientational motion via rotation on applying an electric field. These observations are interpreted in terms of (localized) orientation interactions obtained as oscillations in the intermediate scattering correlation function, as well as the anomalous slower relaxations as resulting in effective (collective) dynamics between monomeric BSA and their protein aggregates.
1 Introduction
As one of the well-known basic functional proteins, serum albumin (SA) has a wide range of important biological functions as a transporter of metabolites, hormones, drugs, nutrients, and metals that play a role in cellular cross-talk [1, 2]. Of particular interest are the interactions of SAs with solvent and small solutes that can lead to variable protein conformation, deformation, and partial unfolding [3–6]. Bovine serum albumin (BSA), as derived (from cows), is a globular SA protein responsible for a variable oncotic pressure (similar to the colloidal osmotic pressure) of plasma (abundant in mammals) and an apparent viscosity [7], which shows reversible conformational changes in the pH and ionic strength [8]. It acts as a multi-functional allergenic transporter molecule in a wide range of biological solutes, such as metabolites, drugs, nutrients, and metals, by ligand binding with variable SA surface amino acids [2]. SAs also effectively bind halide ions by ion-selectivity, where electrostatic interactions also play an important role. A phase diagram of BSA for a monovalent salt, NaCl, with varying concentrations is reported in [9]. The methylene protons and warfarin in the bridging ligand change the conformation in binding sites [10, 11] for molecular docking, e.g., under a cleavage of DNA. Thus, the possible protein aggregation upon binding to a small molecule/ion is clearly important in biomedical applications.
Recently, BSA has been employed as a tracer contrast agent in brain functional MRI imaging analysis since water–protein interactions are immediately accessible in the proton exchange of hydrogen-NMR [12]. In particular, the water and hydrophilic groups on the protein surface can be determined by the MR frequency shift [13]. For example, the accumulation of albumin in solid tumors and binding of drugs, hormones (regulating the colloidal osmotic pressure of blood), and fatty acids to BSA are reported for regulating the osmotic pressure of blood [14–16] by mimicking the colloidal system. Electromagnetic-induced changes in secondary structures of BSA are also investigated by FTIR spectroscopy to explore bioprotective efficiency [17]. In the native globular BSA structure, the fluorescence of lysine-conjugated fluorescein moieties is quenched, while the proteolytic digestion of highly derivatized BSA enhances fluorescence [18–20]. Hence, maintaining the stability of protein conformation is crucial to prevent any harmful state of protein aggregates. Therefore, the gelation and aggregation of BSAs are often explored in the presence of calcium chloride [21]. Depending on the ionic strength, different interactions play a different role. (i) By lowering the ionic strength, the electrostatic repulsive interactions between charged groups on the BSA surface are enhanced due to an increase in the Debye screening length. In addition, the short-range attractive interactions between hydrophobic sites are reduced since the increased electrostatic repulsion keeps the proteins further apart. (ii) At higher ionic strengths, at elevated calcium chloride concentrations where hydrophobic interactions become dominant, the anisometric distribution of hydrophobic groups over the surface of BSA may give rise to the formation of fibrils and filamentous gels. In this work, the possibility of such local modulations by the external weak electric field is explored.
Here, we present experimental results on the relaxation behaviors for microscopic dynamics of concentrated suspensions of BSA and mixture (in the effect of fatty acids), probed by dynamic light scattering (DLS) in both without and with an electric field. In Section 2, the systems and experimental techniques are introduced. Section 3 discusses the stabilizing/de-stabilizing effect of fatty acids (which bind to BSA) on the calcium chloride-induced aggregation by choosing two different BSA suspensions: one containing no fatty acids (which we refer to as BSA1) and the other containing fatty acids but protease-free (referred to as BSApf). In Section 4, the effect of ionic strength on the aggregation behavior of fatty acid-free, non-protease BSA1 is discussed. In Section 5, the effects on the microscopic dynamics of BSA1 in externally applied electric fields are discussed. Finally, Section 6 presents the summary and conclusion.
2 System and experiments
It is known from the previous literature that the shape and size of BSA [22–24] are hydrated ellipsoid of BSA with (sub) nano–micro seconds in thermal motion [25]. The conformational changes of BSA are studied by a small-angle X-ray scattering study: albumin in solution exists as monomer, dimer, and higher-order aggregates. The share of dimer among the remaining forms is high and reaches 10% of all BSA forms, which is confirmed by the SAXS experiment [26]. The equilibrium monomer-to-dimer ratio could, in principle, be calculated from the amplitudes of the two modes, assuming that higher-order aggregates do not contribute to the scattered intensity. However, the values for the stretching parameter for the slow mode are between 0.75 and 0.90, indicating that there are also higher-order aggregates significantly contributing to the scattered intensity. At a low pH, the conformation transitions of BSA undergo two stages (in the variation of ionic strength): first, a sufficiently low-pH (of 4.1) BSA unfolds, and a second transition occurs by the orientation (at pH 3.6) [22]. Such a stabilization of protein unfolding is due to the presence of fatty acids, possibly forming small aggregates.
The turbidity (and heterogeneity) of BSA solutions has been also found to increase with increasing salt concentration, in which partial aggregation may occur as a result of the diminished screening of electrostatic interactions. In such a case, CaCl2 is reported to be more efficient in reducing electrostatic interactions than NaCl at the same ionic strength [27]. The stabilizing or de-stabilizing effect of fatty acids is then considered in the adsorption of BSA [28] with calcium-induced aggregation, expecting polyunsaturated fatty acids are vulnerable to the oxidation process from the free radical interacting with the carbon–hydrogen dissociation against the methylene position. This coincides with the interest of (de) stabilization of the fatty acid, not only limited to the BSA. The measured dynamic light scattering intensity correlation functions are shown in Figures 1, 2 for the fixed BSA concentration of 50 mg/mL and varying CaCl2 concentrations (at an ionic strength of 40 mM PBS). Since the protease is normally responsible for the cleavage (or breaking) of peptide bonds in proteins, causing the degradation of proteins, it is of interest whether this may lead to different surface treatments of BSA types: BSA1 (fatty acid-free) is considered as the locally asymmetric type and BSApf (protease-free) as the symmetric-shaped one. Experiments are performed over a wide range of concentrations. Scattered intensity correlation functions are fitted to extract the microscopic relaxation behaviors.
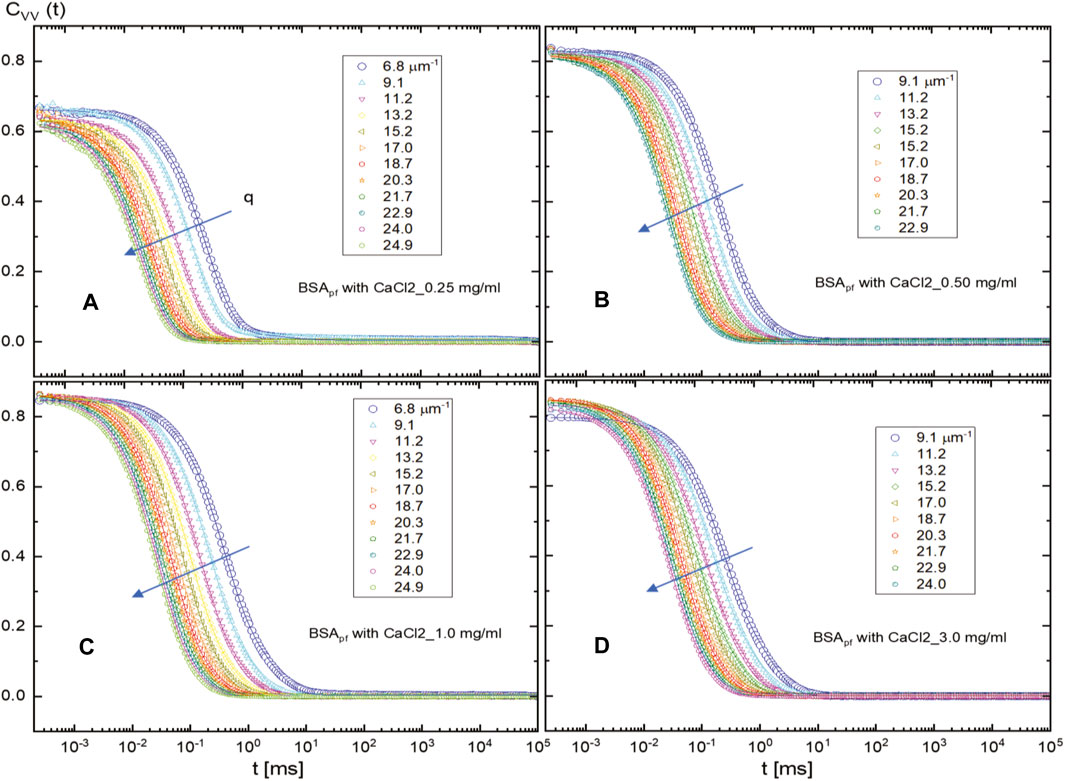
FIGURE 1. Scattered intensity auto-correlation functions of the protease-free BSApf mixture in 40 mM of PBS buffer for various CaCl2 concentrations: (A) 0.25 mg/mL, (B) 0.5 mg/mL, (C) 1.0 mg/mL, and (D) 3.0 mg/mL. The arrow indicates an increase in the scattering wavevector.
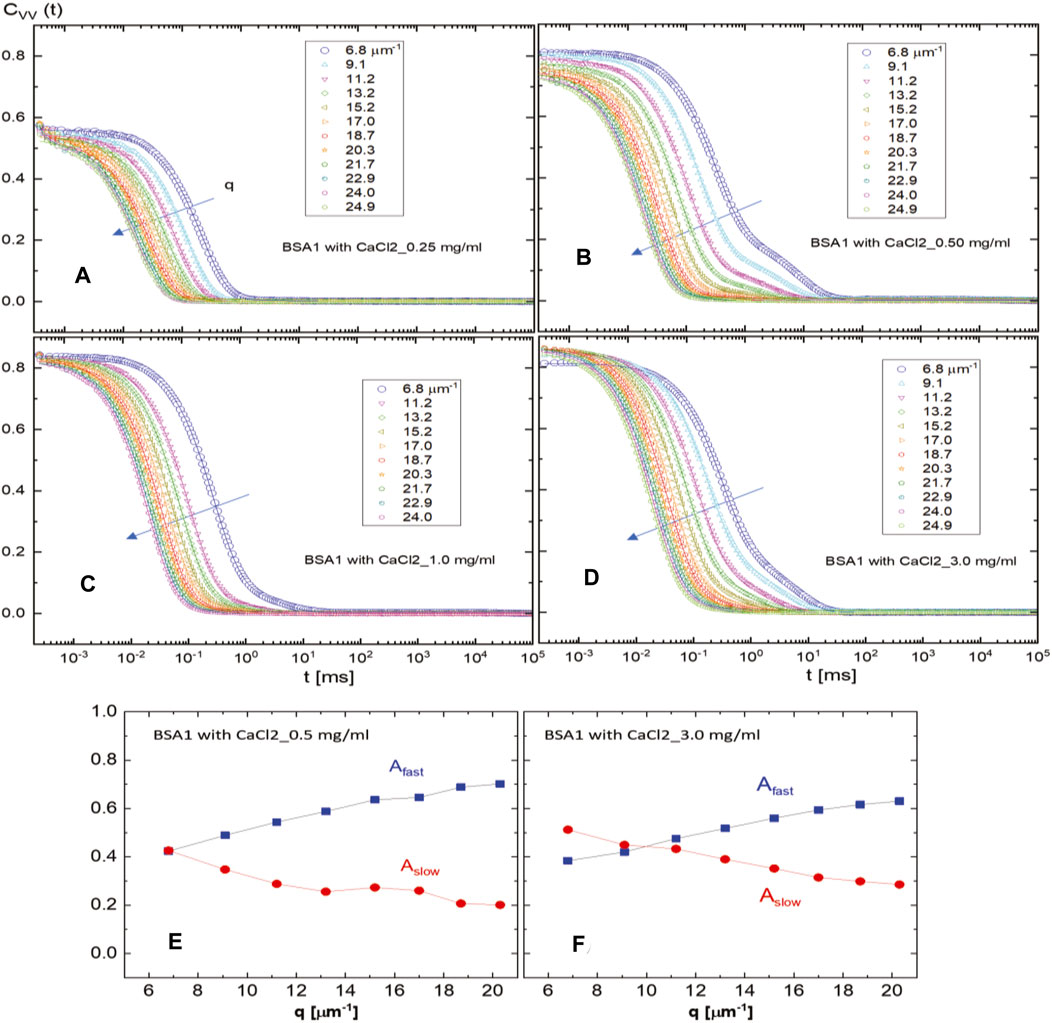
FIGURE 2. Intensity auto-correlation functions for fatty acid-free (non-protease) BSA1 (50 mg/mL) in 40 mM of PBS buffer for various CaCl2 concentrations: (A) 0.25 mg/mL, (B) 0.5 mg/mL, (C) 1.0 mg/mL, and (D) 3.0 mg/mL. The arrow indicates an increase in the scattering wavevector. The scattered field amplitudes of the fast and slow modes are shown for BSA1 with CaCl2 concentrations of 0.5 mg/mL (E) and 3.0 mg/mL (F).
We chose two different types of commercially available BSAs, which we refer to as BSA1 and BSApf, purchased from Sigma Aldrich: BSA1 is essentially fatty acid-free (product number A4612), specifically purified from fatty acids, while BSApf is protease-free (product number A4737), containing a small amount (less than 0.005 units/mg solid) of protease. BSA1, thus, contains essentially no fatty acids and no protease, while BSApf contains fatty acids with a negligible amount of protease. Both types are soluble in water up to 40 mg/mL and 50 mg/mL, respectively, within the pH range of 4.8–7.5 and the given PBS buffer solution. The effect of both CaCl2 concentration and the presence of electric fields on the microscopic dynamics of both types of BSA is investigated. Typically, the commercially available protease assay and the protease fluorescence (detective) kits are processed by azocasein protease substrates and casein fluorescence isothiocyanate, salt-free lyophilized powder form.
To measure and quantify the effect of electric fields on the microscopic dynamics, we perform dynamic light scattering (DLS) experiments using both a conventional ALV-DLS setup (without an electric field) and a home-built in situ electric field small-angle dynamic light scattering setup (with a weak AC sinusoidal electric field), which is the home-built SAeDLS setup [29]. We consider both types of BSA particles in suspensions for a wide range of concentrations (1–105 mg/mL), as well as in the non-protease BSA mixtures of CaCl2 (0.25–3.0 mg/mL). Within a linear response of alternating the orientations of BSA proteins, accessible traits of BSA protein–protein interaction are expected to occur by an additional gentle electric force. Then, the surface-charge density and the potential for arbitrary orientation of protein agates can be affected by localized activities (either an asymmetric or a symmetric conformation) experimentally measured in this work. The results of fittings for both the conventional ALV-DLS setup (without an electric field) and the home-built in situ electric field small-angle dynamic light scattering (with a weak AC sinusoidal electric field) are shown by two dynamical modes. In particular, the fitting function for oscillations in the intermediate scattered correlation function is further found to be interpreted as the localized activities relating to a slow dynamical mode in variations of the weak AC electric field frequencies (5 Hz, 50 Hz, 500 Hz, and 5 kHz) for the field amplitude of 5 V/mm. We have collected scattered intensity auto-correlation functions for both the unpolarized (VV) scheme, CVV (t), in the absence of an electric field, and the (VH)-crossed polarization, CVH (t), in the presence of an in situ electric field. A special note is the different ranges of the scattering wavevector between them: for the SAeDLS, the wavevector is quite smaller (q ∼ 1.8–2.8 μm−1) than that for the conventional ALV-DLS (q ∼ 6.8–25 μm−1).
3 The effect of CaCl2 on the microscopic dynamics of protease-free versus fatty acid-free BSA
In the interest of relative BSA interactions via the particle–particle interaction of BSA aggregates in mixtures for different access of salt concentrations, two types of BSA mixture with CaCl2 at an ionic strength of 40 mM PBS are measured by the scattered auto-correlation function, C(t), in the absence of an external field, by varying the CaCl2 concentration (0.25, 0.5, 1.0, and 3.0 mg/mL), as in Figure 1 and Figure 2, respectively: Figure 1 is for BSApf (in the presence of fatty acids), and Figure 2 is for BSA1 (essentially no fatty acids). The various correlation functions are for scattering wavevectors, as indicated in the figures.
This is analyzed by the fits of auto-correlation functions of light scattering, which is according to
where
The addition of CaCl2 causes a non-monotonic relaxation of the BSA1 type, which is reflected in terms of the scattering field amplitude for the slow relaxation time at the 0.5 mg/mL CaCl2 concentration, as shown in Figure 2B. This effect is most pronounced at the CaCl2 concentration of 1.0 mg/mL, as shown in Figure 2C. At an even higher (3.0 mg/mL) CaCl2 concentration, shown in Figure 2D, a faster relaxation appears, but then, it separates into the fast and slow modes. Actual fits of scattering auto-correlation functions are performed by the sum of the two abovementioned single-stretched exponential functions to extract the diffusion constants for those two modes. Nevertheless, fatty acid-free BSA1 shows a slow mode development, as seen from the fits of the correlation function with two exponentials. As can be seen, there is a slow mode by increasing the CaCl2 concentration for BSA1. The amplitude of the slow mode seems to be non-monotonic, shown in Figures 2E, F as crossing the fast and slow modes, at a higher CaCl2 concentration of 3.0 mg/mL. The overall relaxation rates for the fast and slow modes are plotted in Figure 3, as the dispersion relations at a larger wavevector range (for q ∼ 6.8–25 μm−1) obtained from the fits of the raw intensity auto-correlation functions of light scattering (see Figure 1; Figure 2) in the comparison of both types of BSAs. The fast mode appears to be rather unaffected by the variation of CaCl2 concentration for both BSA types, while the slow mode exhibits non-monotonic dispersion in the square of the wavevector (
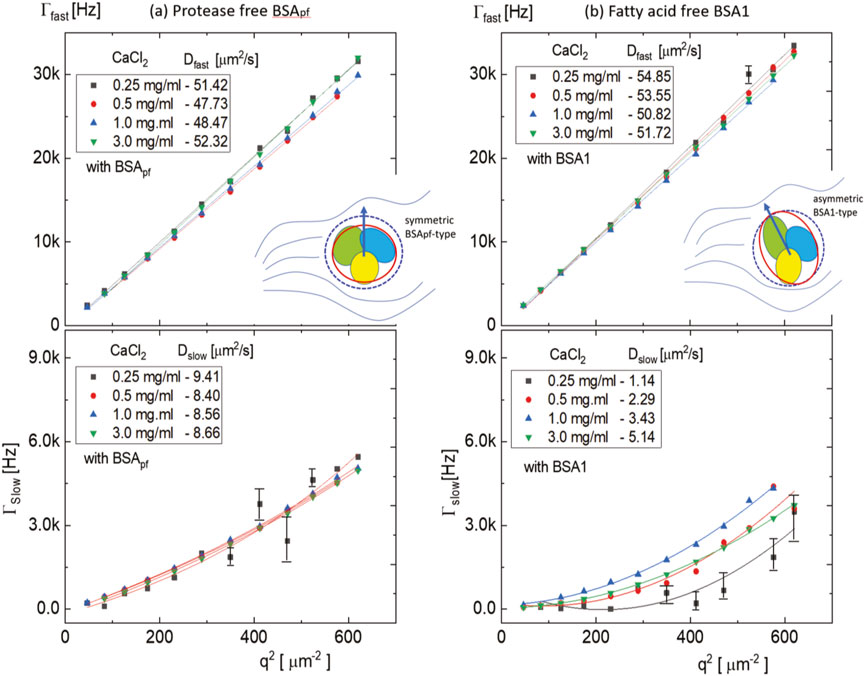
FIGURE 3. Dispersion relations for the fast and slow modes of a middle BSA concentration of 50 mg/mL in 40 mM of PBS buffer with various CaCl2 concentrations (0.25 mg/mL, 0.5 mg/mL, 1.0 mg/mL, and 3.0 mg/mL): (A) for the protease-free BSApf and (B) the non-protease, fatty acid-free BSA1-type. It should be noted that pronounced quadratic dispersion curves are found in the slow mode of BSA1 (see the bottom right). Different colors of figure insets illustrate three distinguishable domains in the BSA structures, where the solid inner red line indicates the shape and the outer blue dotted line indicates an estimated hydrodynamic diameter (see Figure 6). The arrow points to the possible direction of the orientation in the solvent background.
(ii) However, for the slow modes (lower panels Figures 3A, B), the q2-dependence is clearly nonlinear, which may be due to the possible protein aggregation, leading to a very polydisperse suspension. In particular, at lower amounts of CaCl2, larger deviations of relaxations are observed (and pronounced more at the BSA1 type). The slow relaxation rates are a factor VIII smaller in magnitude than for the fast mode, and a far slower diffusion is obtained for the BSA1 type (see the lower panel of Figure 3B). Interestingly, BSApf (Figure 3C) has not much variation of diffusion constants by an increase of CaCl2, while non-protease, fatty acid-free BSA1 shows lower values of slope in Figure 3D. Furthermore, the diffusive motion of slow mode BSA1 is not linear but in a quadratic form, indicating that locally anisotropic symmetry affects the fatty acid-free BSA1 aggregates. It then implies that the degree of aggregation for the BSA1 is more pronounced than that of the BSApf (since the amplitudes are orders of magnitude larger for BSA1). This highly supports the fact that fatty acids stabilize BSA against calcium-induced aggregation by screening the attractive interaction between the proteins, adsorbing to the hydrophobic groups of BSA. The results are quite agreeable with other works in the light-scattering study of the structure of aggregates and gels formed by heat-denatured whey protein isolate and beta-lactoglobulin at neutral pH [30] and the salt-induced aggregation of the globular protein [31]. Therefore, not only the electrostatic interaction in the absence of an electric field [32] but also the degree of local specificity formed as “monodispersed” particle interactions affect the stability of bovine serum albumin by either the symmetric shape of the protease-free BSA protein or the fatty acid-free (asymmetric) BSA1 type.
4 The effect of ionic strength for a concentrated non-protease fatty acid-free BSA1 solution
In the absence of an electric field, the non-protease fatty acid-free BSA1 protein concentration dependence on the microscopic dynamics is obtained at two different ionic strengths of PBS concentrations (115 and 20 mM): (i) First, at a high ionic strength (a PBS concentration of 115 mM), the diffusive behaviors of BSA1 protein are shown in Figure 4A for various BSA1 concentrations with scattering wavevectors that are indicated in the figure. There are again two modes, which are now both diffusive, as evidenced by the linear q2-dependence of the relaxations rates given in Figure 4B. The diffusion constants of the fast mode are increased in the range of 53–68 μm2/s, while the slow mode is decreased from 17 μm2/s to 12 μm2/s, in an increase of the BSA1 concentration for 10 mg/mL, 50 mg/mL, 75 mg/mL, and 100 mg/mL. Also, the relaxation rate for the slow mode is about twice as large as for the calcium-induced aggregates (see Figure 3B), indicating that the linear dimensions of BSA1 protein aggregates may be twice as small. The diffusion of a fast mode is then related to more or less BSA1 monomers, increasing with higher BSA1 concentration, which shows that the monomer–monomer interactions tend to be repulsive. However, the diffusion of the slow mode (of BSA1 aggregates) is obtained to be decreased with an increase in concentration. Despite the overall repulsive monomer interactions, BSA1 aggregation seems to occur as larger at the highest concentration compared to the lowest concentration. This qualitatively occurred as the concentration-dependent BSA aggregation relies on the specific orientations among the particles, such as how the hydrophobic groups face each other.
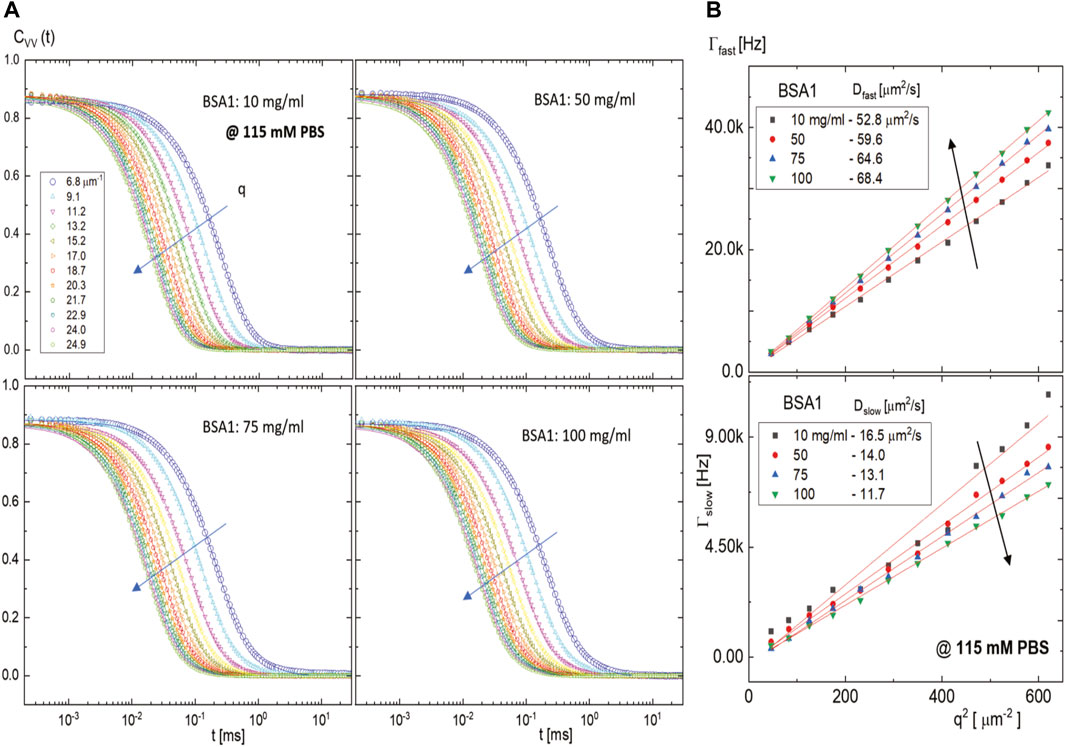
FIGURE 4. Scattered intensity auto-correlation functions of a few fatty acid-free BSA1 solutions at a high ionic strength of 115 mM PBS: (A) for BSA1 concentrations of 10 mg/mL, 50 mg/mL, 75 mg/mL, and 100 mg/mL and (B) the dispersion relations of the fast and slow modes, where the translational diffusion constants are shown in the insets. The arrows in (A) and (B) indicate the increase of the scattering wavevector and the increase/decrease with an increase in BSA1 concentration, respectively.
(ii) By lowering the ionic strength, much extensive BSA1 concentrations are measured for intensity correlation functions at a lower PBS concentration of 20 mM, provided in Figure 5. In particular, Figure 5A shows the scattered intensity correlation functions for BSA1 at a concentration of 24.0 mg/mL by variation of the wavevector. The corresponding monomer relaxation rates are given in Figure 5B, which show not only a much stronger increase but also a wider range in the relaxation rates with an increase in BSA1 concentration as compared to 115 mM of PBS. This is due to the larger Debye length, keeping a larger spatial range of the repulsive electrostatic interactions. The resulting stronger electrostatic repulsions lead to a more pronounced increase of the relaxation rates on increasing the BSA1 concentration. The slow mode shows much the same decrease by approximately 50% between the largest and smallest BSA1 concentrations as for the PBS concentration of 20 mM. The rough estimation of the size of aggregates for the lower PBS concentration of 20 mM is, however, about 40% smaller as compared to the higher PBS concentration of 115 mM (seen from the relaxation times in Figure 4B lower panel; Figure 5C). Thus, larger ranges of the electrostatic monomer–monomer interactions are found at a lower ionic strength, which screens the hydrophobic interactions that lead to the BSA1 aggregation. Figure 6A shows the resulting ratio of amplitude for the slow and fast modes as a function of the BSA1 concentration (at a low ionic strength and PBS concentration of 20 mM). This ratio increases with an increase in BSA1 concentration, which reflects the increasing tendency for aggregation as the protein concentration is increases. Since the relaxation rates are proportional to
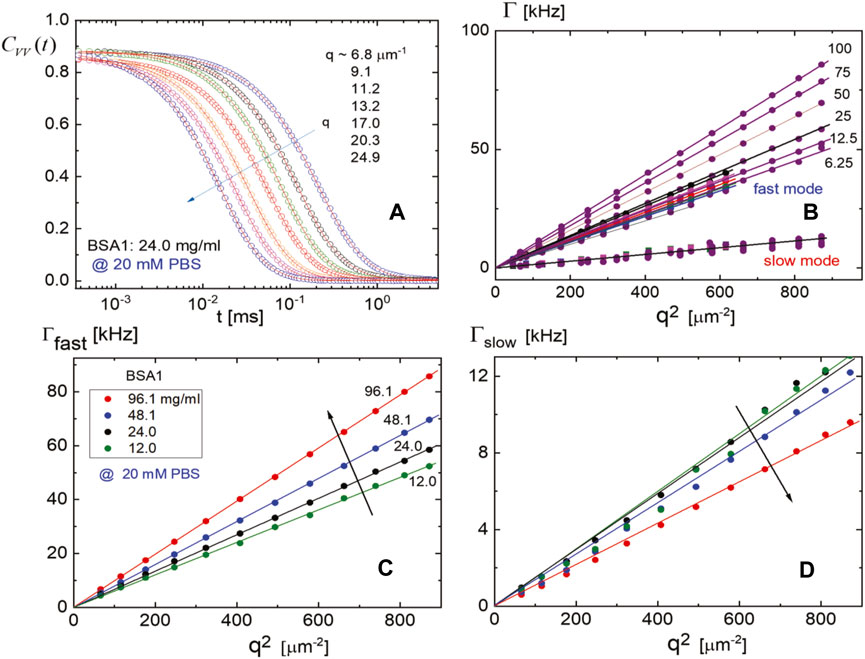
FIGURE 5. Microscopic dynamics of BSA1 at a low ionic strength (of 20 mM PBS buffer): (A) The intensity auto-correlation functions for BSA1 at a concentration of 24 mg/mL with different scattering angles and (B) the dispersion relation of both fast and slow modes for various BSA1 concentrations as a function of squared scattering wavevector q. (C, D) The dispersion relations of the fast (C) and slow (D) modes, where the arrows in (C) and (D) indicate the increase/decrease with an increase in the BSA1 concentration, respectively.
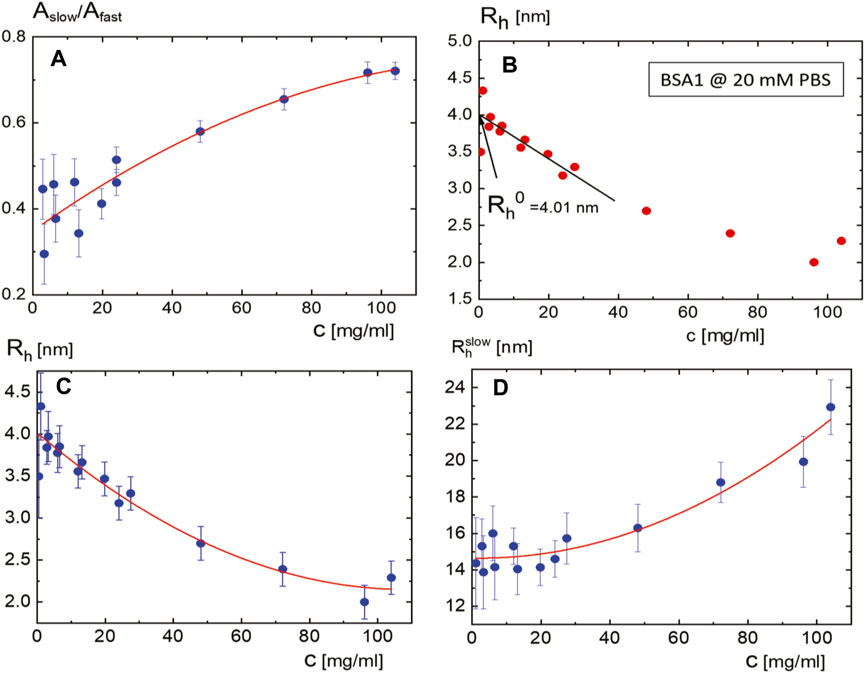
FIGURE 6. (A) Ratio of the amplitudes
5 Non-protease fatty acid-free BSA1 and mixture in electric fields
This section is dedicated to the effect of an external electric field on the translational and rotational microscopic dynamics of non-protease BSA1 proteins, as measured by a small-angle in situ electric field depolarized dynamic light scattering (SAeDLS) process [29]. The depolarized intensity correlation functions are denoted here by CVH (t), where the subscript V stands for vertically polarized incident light and H for the horizontal component of the scattered light, effectively probing the dynamics of both translation and rotation. Rotational dynamics of the proteins can be gained by the depolarized scattered light depending on their instantaneous orientation motions. The normalized intensity auto-correlation functions of the BSA1 solution in the presence of a weak AC external electric field modulation are provided in Figure 7 and Figure 9, respectively. These auto-correlation functions for the BSA1 solution under a field are obtained by in situ electric field small-angle dynamic light scattering (SAeDLS) for a smaller wavevector of q ∼ 1.8–2.8 μm−1. By an increase of the AC electric field frequency, the modulations of scattered field amplitude of the slow mode are found with a proper fit function for the microscopic dynamics of the non-protease BSA1 and mixture with CaCl2.
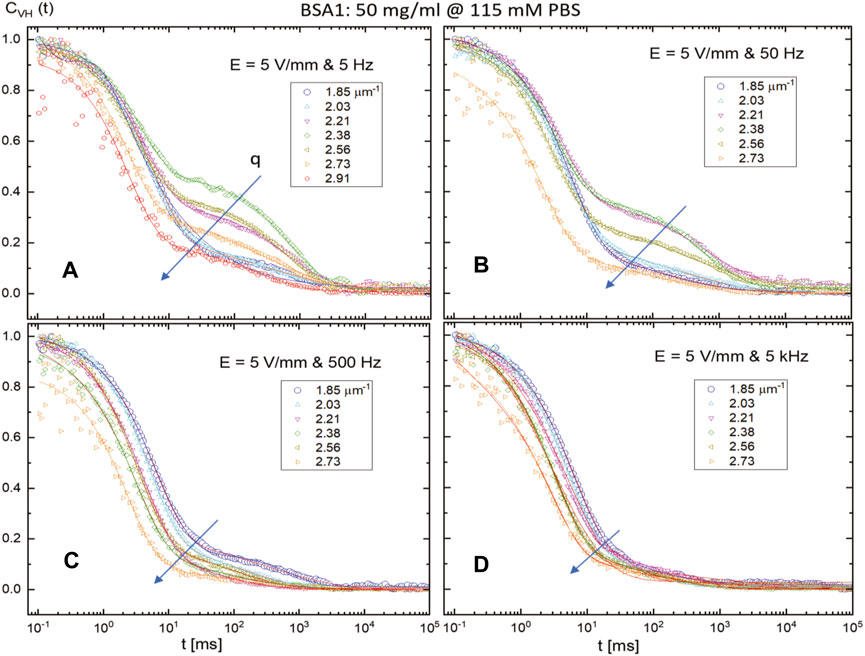
FIGURE 7. Depolarized normalized intensity auto-correlation functions CVH (t) of a BSA1 solution, measured by SAeDLS, with a concentration of 50 mg/mL and at a higher PBS concentration of 115 mM, in the presence of an AC external electric field for various electric field amplitudes (5 V/mm) and frequencies: (A) 5 Hz, (B) 50 Hz, (C) 500 Hz, and (D) 5 kHz. The arrow indicates an increase in the scattering wavevector for the given electric field condition.
5.1 Field-induced dynamics of BSA1 at high ionic strength
Figure 7 shows the normalized intensity auto-correlation functions for different scattering wavevectors for a fixed electric field strength of 5 V/mm with an increasing sinusoidal frequency (as 5 Hz, 50 Hz, 500 Hz, and 5 kHz). The visible electric field responses are observed in normalized depolarized (VH) intensity auto-correlation functions of BSA1 solution (50 mg/mL) at a high (115 mM PBS) ionic strength by a lower range of scattering wavevector (than that previously measured in the ALVDLS). It should also be noted here that CVH (t) is the scattered intensity auto-correlation functions measured under crossed polarization. As it can be seen clearly (in Figure 7), for the case of BSA1 concentration 50 mg/mL and PBS concentration 115 mg/mL, the strong effect of a decrease for slow-mode thermal fluctuations is shown with an increase in the weak external AC electric field for a fixed field amplitude. The length of the arrow in Figure 7 represents the degree of variation in the depolarized correlation functions with an increase in the scattering wavevector for a given electric field condition. Although the electric torque exerted onto the proteins may apparently be too small to lead to additional field-induced rotational motion of the proteins, the slow mode clearly visible in Figure 7 may be mainly due to the presence of BSA1 aggregates.
The corresponding results of field-induced dynamics of BSA1 at high ionic strength are provided in Figure 8. The fast mode is to be decreased in the translation diffusion, while the rotational diffusion is increased (see the intercept values of the asymptotic relaxation rates for an infinitely small wavevector q ∼ 0, in Figure 8A) with an increase in frequency. The translational diffusion coefficient is decreased from 54 μm2/s to 32 μm2/s, while the rotational diffusion incremented slightly from 10 s−1−1 to 14 s−1, with an increase in applied frequency, from 5 Hz to 5 kHz, respectively (see the insets in Figure 8A). Within the experimental error, the dispersion of (slow) rotational motions is obtained from the intercepts of relaxation rate versus q2, interestingly non-monotonic depending on the frequency in Figure 8B. Furthermore, the slow mode turned out to be not a simple diffusion but to show a parabolic dispersion, as
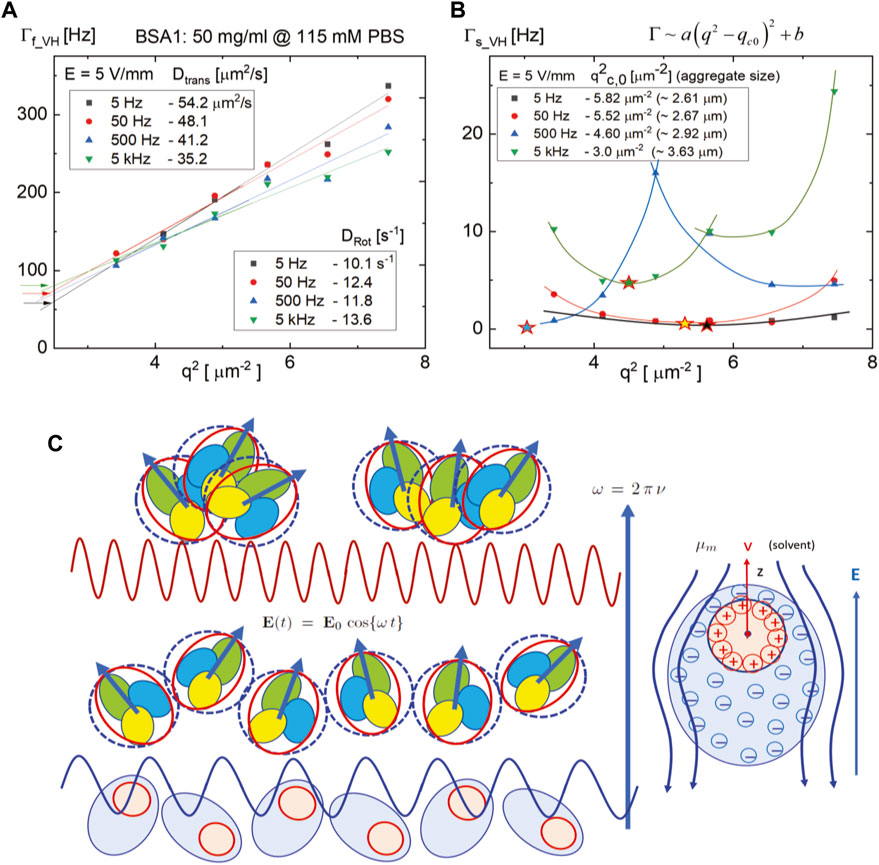
FIGURE 8. Relaxation rates for the fast mode (A) and slow mode (B) of the depolarized intensity correlation functions given in Figure 7 as a function of q2 for four different frequencies, 5 Hz, 50 Hz, 500 Hz, and 5 kHz, at a field strength of 5 V/mm. The coherent wavevector value,
As compared to the polarized correlation functions for the same suspension of BSA1 protein in the absence of an electric field (in Figure 4), the depolarized scattering correlation functions show stronger contribution related to the aggregates (in Figures 7, 8) mostly by field-induced rotational motion of the BSA1 aggregates. This indicates that the dipole–dipole interactions between the proteins are sufficiently strong, leading to an overall average alignment for the BSA1 proteins within the aggregates. Thus, the earlier discussed aggregation of proteins with relative orientations is indeed valid to form re-alignments for BSA1 proteins within aggregates and also to an accumulative electric dipole moment of the aggregates on the addition of monomers. The reason for a decrease (up to a higher frequency of 5 kHz) in rotational contribution measured in CVH (t) is expected to be the fact that orientational motions of the BSA1 aggregates become less deviated to an external field (beyond a few kHz).
5.2 Field-induced dynamics of BSA1 at low ionic strength
More exotic electric responses are obtained in the intermediate depolarized correlation functions, CVH (t), at a fixed lower ionic strength (20 mM PBS) for varying BSA1 concentrations of 25 mg/mL (low), 50 mg/mL (middle), and 100 mg/mL (high), without and with the electric field (of 5 V/mm and 50 Hz) in Figures 9A, B, respectively. The comparison of depolarized correlation functions without (the top panels) and with (the bottom panels) the electric field for a low PBS concentration of 20 mM is shown for three distinctive BSA concentrations that exhibited qualitatively different features in terms of scattered field amplitude for the localized oscillations in the intermediate correlation function. These oscillations are again attributed to the rotational motion of aggregates, and the proper fitting function for including such oscillations at intermediate scattering correlation function is found to be
where
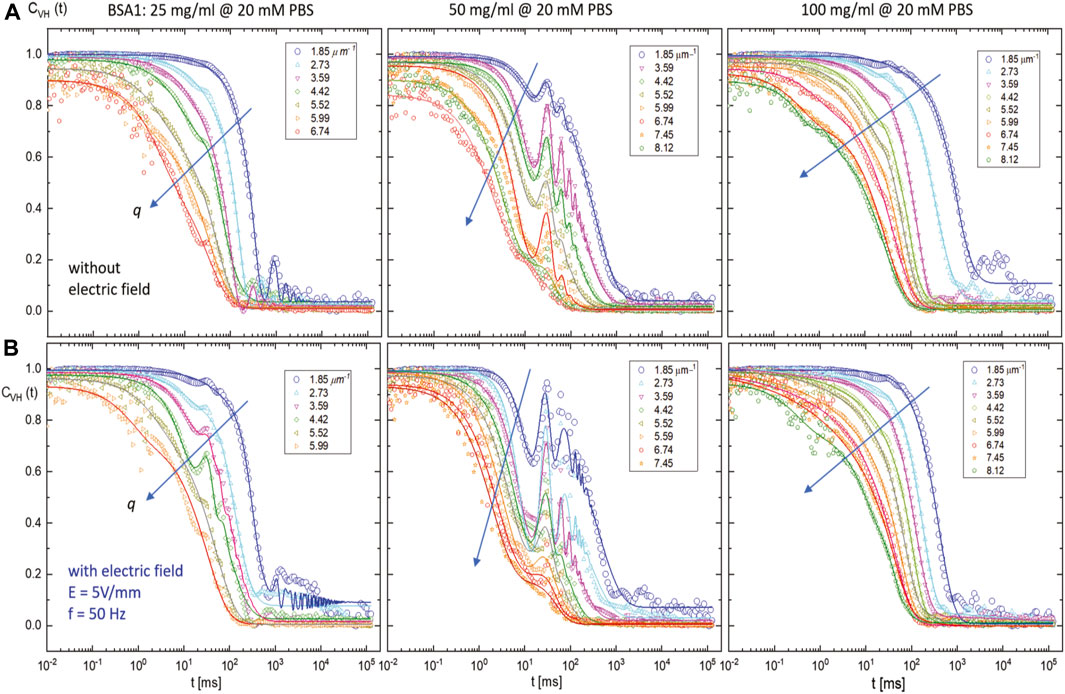
FIGURE 9. Depolarized normalized intensity auto-correlation functions CVH (t) measured by SAeDLS for BSA1 concentrations of 25 mg/mL (left), 50 mg/mL (middle), and 100 mg/mL (right) at a low ionic strength (20 mM PBS): (A) without and (B) with an AC external electric field with a field strength of 5 V/mm and frequency 50 Hz. Lines are the fits by a novel fitting function of CVH(t) in the main text, Eq. 2, which includes the localized intermediate scattering correlation function.
It seemed that the electric field-induced localized oscillations slightly increased in amplitude, up to the middle concentration of BSA (of 50 mg/mL), but then diminished at an even higher concentration (of 100 mg/mL), as shown in Figure 9 (see the rightest panels), in the normalized intensity auto-correlation functions, in the presence of a weak AC external electric field modulation. Intriguingly, slight enhancements of oscillations are also shown when the electric field is applied, particularly in the middle BSA1 concentration. The result of non-monotonic dispersion relations for the comparison of dynamical modes of BSA1 protein (25 mg/mL, 50 mg/mL, and 100 mg/mL) at lower ionic strength (of 20 mM PBS), without and with the electric field, is also shown in Figure 10, where the data points are obtained from the aforestated correlation function. The outcome dispersion relation can be expressed by
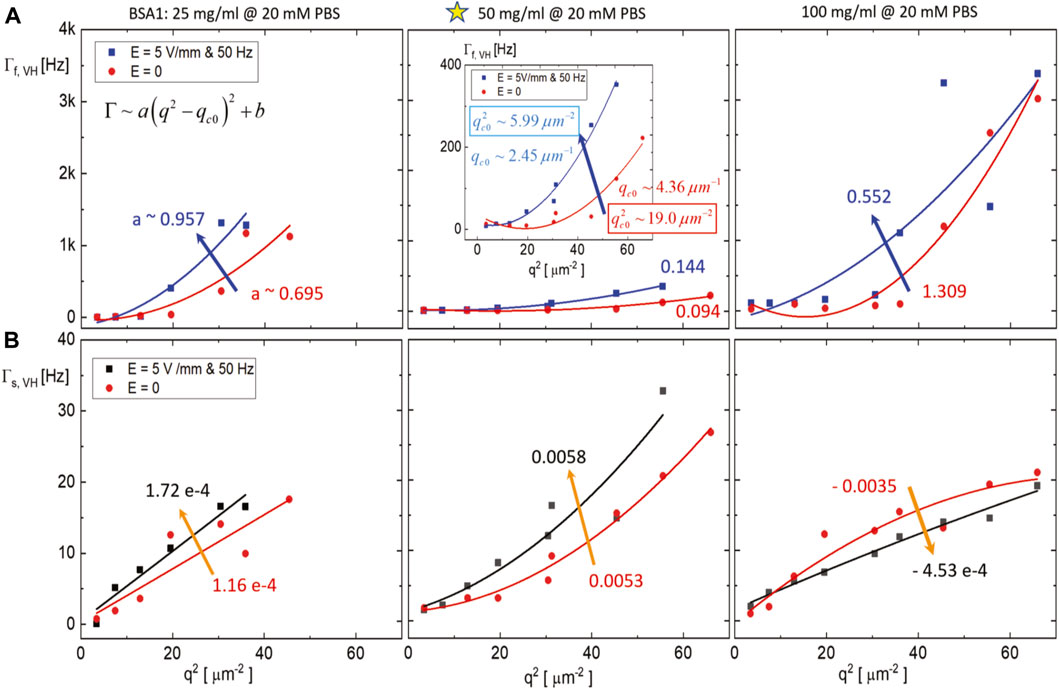
FIGURE 10. Result of non-monotonic dispersion relations for the comparison of dynamical modes of BSA1 protein (25 mg/mL, 50 mg/mL, and 100 mg/mL, for the 20 mM PBS), without and with the electric field, obtained from the correlation functions (in Figure 9): (A) The fast-mode and (B) the slow-mode relaxation rate as a function of the squared scattering wavevector. The lines are the fits, and the numbers indicate the slope of a parabolic dispersion that the arrow points when the field is applied.
It is then clear that abnormal diffusion processes are pronounced at the lower ionic strength (20 mM PBS) for BSA1 protein suspensions (as around the water-soluble concentration, i.e., 50 mg/mL), measured in the fast and slow modes (see the Figure 10). Also, the electric field effects are visualized by the relaxation rates that are relatively broader at low wavevectors, at higher BSA1 concentration at 100 mg/mL up to
Finally, to verify further electric effect of the localized activities for BSA1 proteins and aggregates for observing any existing size-dependent responses, the mixture of concentration as the BSA1 protein of 50 mg/mL, with CaCl2 of 3 mg/mL (at a high ionic strength of 115 mM PBS), is explored under external fields for the variations of few small scattering wavevectors. In the absence of a field, the auto-correlation functions and corresponding dispersion relations are as shown in Figure 2D and Figure 3B, respectively. The raw intensity auto-correlation functions of depolarized light scattering, CVH (t), are presented in Figure 11 in the presence of an external field, with a frequency of 10 Hz (left) and 100 Hz (right). The insets are shown for the corresponding intensity traces in the variation of the wavevector q. The uniqueness of depolarized light scattering, CVH (t), happens at a particular wavevector value of q ∼ 2.21 μm−1, and the corresponding size of the BSA aggregate is approximately d ∼ 2.84 μm, which may be coherence length (few tens of larger than the actual sizes of BSA1 protein aggregates) for the field-induced undulation of aggregates in mixture with localized oscillations present, by an increased signal to noise ratio at a higher frequency of 100 Hz. Therefore, the electric effect affecting dynamical modes is consistent at a lower ionic strength, such as the thick electric double-layer deformation and possibly by the electro-osmotic flow of BSA1 condensates. Also, the anomalous behavior of relaxation rates can be then attributed to a relatively large extent of the electric double layer accompanied by the electro-osmotic flow under an external electric field. However, in general, developing a theory including hydrodynamics still demands quite an effort.
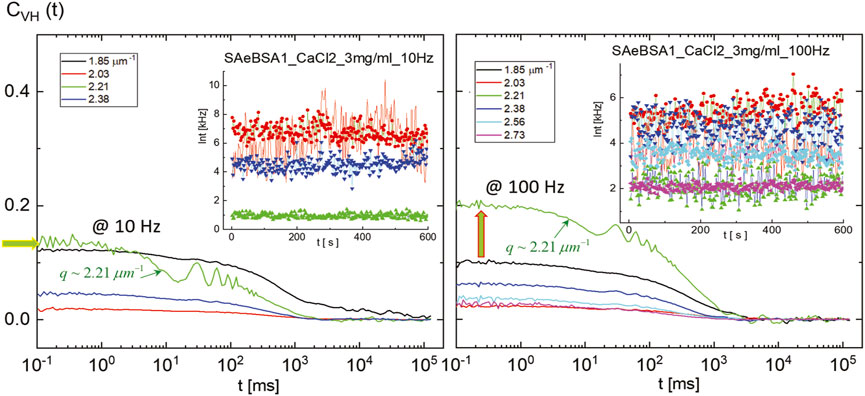
FIGURE 11. Raw intensity auto-correlation functions of depolarized light scattering CVH (t) measured by SAeDLS, for the BSA1 protein (50 mg/mL) mixture with CaCl2 (3 mg/mL) at an ionic strength of 115 mM PBS in the presence of an external field with 10 Hz (left) and 100 Hz (right). The insets are scattered intensities in time for given small wavevectors. It should be noted that there is a unique increase of the signal-to-noise ratio at a particular wavevector, q ∼ 2.21 μm−1, and the corresponding aggregate size of d ∼ 2.84 μm, seen at higher frequency 100 Hz, as the most probable collective length scales at longer-time BSA1 protein aggregates.
6 Summary and conclusion
Here, in this work, the cooperative microscopic dynamics of BSA-condensate (monomer) or protein aggregates are discussed in the absence and presence of a weak, low-AC electric field, measured by both conventional ALV dynamic light scattering (in equilibrium) and in situ external AC electric field small-angle dynamic light scattering (SAeDLS in non-equilibrium). The dynamic light scattering experiments are interpreted in terms of interactions between BSA monomers. Two relaxation modes have been observed in each of the dynamic light scattering (DLS) intensity correlation functions: a fast mode corresponding to the diffusive motion of BSA monomers and a slow mode due to the presence of aggregates.
Interestingly, the electric field-induced localized oscillations are observed in the intermediate scattering correlation function for the collective microscopic dynamics of BSA proteins and the protein aggregates, which are found to be fitted by a noble fitting function. The comparisons of relaxation behaviors in dynamical modes (of a fast and a slow mode) are presented for interacting BSAs in solution at a high and a low ionic strength by the localized interaction of two comparable types of BSAs (BSA1 and BSApf) in the mixture, with varying amounts of CaCl2.
To summarize the results, (i) first, the observed stabilizing effect of fatty acids against calcium-induced aggregation can be interpreted in terms of screening of the attractive hydrophobic surface groups of the BSA proteins. The fatty acids bind to the hydrophobic surface groups and, thus, partially screen their attractive interactions. As expected, the aggregate translational relaxation rate decreases with an increase in calcium concentration due to their increasing size. (ii) Second, by variation of the ionic strength, DLS experiments show that monomer–monomer BSA interactions (in the absence of fatty acids) are overall repulsive, as evidenced by the increasing relaxation rate of the DLS intensity correlation function with an increase in concentration. The overall repulsive interactions are pronounced at a lower ionic strength due to the larger spatial extent of the electric double layer. Nevertheless, a sizable fraction of the protein occurs in an aggregated form. We can conclude the attractive interactions mediated by the hydrophobic groups only occur for specific relative orientations of two interacting proteins. (iii) Third, the effect of diffusive properties of BSA1 (in the absence of fatty acids) on an applied low-AC electric field is investigated by means of depolarized DLS experiments, which probes the rotational dynamics of the BSA1 monomers and their aggregates. The translational monomer diffusion coefficient of the BSA1 monomers diminishes significantly with an increase in the frequency of an externally applied electric field. However, the effect of an electric field on the rotational diffusion of BSA1 aggregates is found to be visible (seen in the frequency-dependent slow-mode relaxations). Although the electric dipole moment of the monomers may be too small to induce additional orientational motion, the protein aggregates show a cooperatively enhanced “re-aligning” with locally asymmetric BSA1 aggregates, affected by applying an electric field. In line with the abovementioned conclusion, aggregation occurs for specific relative orientations of neighboring proteins, which may be attributed to the cumulatively increasing dipole moment on adding monomers to the aggregate under an external electric field.
In addition, the microscopic dynamics of localized oscillations occurred vividly for the non-protease and fatty acid-free BSA1-type suspension, in which the friction motion in the averaged thermal fluctuation of condensed ions seems to be “enhanced” in the electric field, than that of the protease-free BSApf-type mixture. The main reason for obtaining the resultant dynamical modes is that the fast mode results in faster relaxation while the slow mode is slower, which is due to an increase in the BSA1 protein concentration. This contrast then boosts the fast mode as more responsible for an increase of a “repulsive” interaction among the protein monomer–monomer and the slow mode for consequential protein aggregates that are cooperatively an “attractive” interaction. Since the surface conducting proteins and field-induced polarization of condensed ions are essential to the cooperative orientation in the external electric field, they both affect the force and torque acting on the field-induced spheroidal reorientation. This further leads to additional effects in the instantaneous BSA1 protein aggregates, depending on the concentration at a given ionic strength, varied by the spatial correlation, qc.0, as localized oscillations in the microscopic relaxation.
Therefore, the slow mode observed here by the electric field, with the variation in frequencies, is the resultant torque acting slightly developed polarization by charge redistribution (as the induced pole), which leads to realign orientations under an alternating AC electric field. Then, the polarization of the layer of BSA1 protein condensed ions by oscillatory external electric fields to within linear response (or slight drifts of protein aggregates) is responsible for exhibiting such oscillations from the localized activities in dynamics. Also, the layer of condensed ions is assumed to be covered by ions being mostly constrained to move over the surface of protein spheres and spheroids in the case of non-protease BSA1 protein and the mixture with CaCl2. This then concludes that fundamental differences in the types of the conformation of BSAs (as well as the protein aggregates) are distinguished by the advanced microscopic dynamics in the presence of a weak AC electric field. This finding can be then used to monitor possible localized activities of BSA monomers by either an “open” (asymmetric) or “closed” (symmetric) state in their interactions, which may further guide an estimate for the coverage of hydration layers as a whole particle size of a spheroidal shape.
Thus, the current work shows an interesting observation to realize the field-dependent response for the localized spatial correlation of BSA protein aggregates. This response on the system of spheroids is the resultant of protein–protein interaction and the non-uniform protein aggregates, balanced by locally non-uniform (shape) distribution of condensed ions and the electro-osmotic flow. It then demonstrates localized activities of interacting BSA proteins in suspensions are realized by the low-AC electric field modulations as the field-included deformation, which is not feasible at all in the absence of an electric field. Finally, we hope the findings are useful to facilitate other relevant subjects of topics: (i) the pair-interactions of BSA protein–protein and the protein aggregates, (ii) the apparent (or effective) measures for the osmotic pressure of BSA protein aggregates in the presence of an electro-osmotic flow, and ultimately, (iii) the equations of motion for interacting globular protein aggregates in the collective behavior without and with the electric field.
Data availability statement
The original contributions presented in the study are included in the article, further inquiries can be directed to the corresponding author.
Author contributions
KK: conceptualization, data curation, formal analysis, investigation, methodology, project administration, resources, software, supervision, validation, visualization, writing–original draft, and writing–review and editing.
Funding
The author declares financial support was received for the research, authorship, and/or publication of this article. This work was supported by the Central Library, Forschungszentrum Juelich, open-access Vat Number DE 122624631, contact: ZB_FZJ Lexis, Heike Jana Timmer (ai50aW1tZXJAZnotanVlbGljaC5kZQ==).
Acknowledgments
The author thanks Prof. J.K.G. Dhont for scientific discussion and proofreading the manuscript. This work is part of the DFG Project (495795796) entitled “Protein phase behavior in electric fields.”
Conflict of interest
The author declares that the research was conducted in the absence of any commercial or financial relationships that could be construed as a potential conflict of interest.
The handling editor DF declared a shared affiliation with the author at the time of review.
Publisher’s note
All claims expressed in this article are solely those of the authors and do not necessarily represent those of their affiliated organizations, or those of the publisher, the editors, and the reviewers. Any product that may be evaluated in this article, or claim that may be made by its manufacturer, is not guaranteed or endorsed by the publisher.
References
1. Kadi NE, Taulier N, Huérou JY, Gindre M, Urbach W, Nwigwe I, et al. Unfolding and refolding of bovine serum albumin at acid pH: ultrasound and structural studies. Biophysical J (2006) 91:3397–404. doi:10.1529/biophysj.106.088963
2. Majorek KA, Porebski PJ, Dayal A, Zimmerman MD, Jablonska K, Stewart AJ, et al. Structural and immunologic characterization of bovine, horse, and rabbit serum albumins. Mol Immunol (2012) 52:174–82. doi:10.1016/j.molimm.2012.05.011
3. Gekko K, Hasegawa Y, Compressibility-structure relationship of globular proteins. Biochemistry (1986) 25:6563–71. doi:10.1021/bi00369a034
4. Chalikian TV, Gindkin VS, Breslauer K, Volumetric characterizations of the native, molten globule and unfolded states of cytochromecat acidic pH. J Mol Biol (1995) 250:291–306. doi:10.1006/jmbi.1995.0377
5. Valdez D, Le Huerou JY, Gindre M, Urbach W, Waks M, Hydration and protein folding in water and in reverse micelles: compressibility and volume changes. Biophys J (2001) 80:2751–60. doi:10.1016/S0006-3495(01)76243-1
6. Kanjilal S, Taulier N, Le Huerou JY, Gindre M, Urbach W, Waks M, Ultrasonic studies of alcohol induced transconformation in lactoglobulin: the intermediate state. Biophys J (2003) 85:3928–34. doi:10.1016/S0006-3495(03)74806-1
7. Masueli MA, Gassmann J, Adv. In physicochemical properties of biopolymers, Part 1. Sharjah, United Arab Emirates: Bentham Science Publishers (2017). p. 28–59. Martin Mausueli and Denis Renard (eds).
8. Foster JF, Albumin structure. Function and uses. Massachusetts, United States: Academic Press (1977). p. 53–84.
9. Zhang F, Skoda MWA, Jacobs RMJ, Martin RA, Martin CM, Schreiber F, Protein interactions studied by SAXS: effect of ionic strength and protein concentration for BSA in aqueous solutions. J Phys Chem B (2007) 111:251–9. doi:10.1021/jp0649955
10. Li F, Feterl M, Warner JM, Day AI, Keene FR, Collins JG, Protein binding by dinuclear polypyridyl ruthenium(II) complexes and the effect of cucurbit[10]uril encapsulation. Dalton Trans (2013) 42:8868. doi:10.1039/c3dt50551k
11. Petitpas, , Bhattacharya AA, Twine S, East M, Curry S, Crystal structure analysis ofWarfarin binding to human serum albumin. J Biol Chem (2001) 276:22804–9. doi:10.1074/jbc.M100575200
12. Luo J, He X, d’Avignon DA, Ackerman JJ, Yablonskiy DA, Protein-induced water 1H MR frequency shifts: contributions from magnetic susceptibility and exchange effects. J Magn Reson (2010) 202(1):102–8. doi:10.1016/j.jmr.2009.10.005
13. Liepinsh E, Otting G, Proton exchange rates from amino acid side chains–implications for image contrast. Magn Reson Med (1996) 35(1):30–42. doi:10.1002/mrm.1910350106
14. Kratz F, Albumin as a drug carrier: design of prodrugs, drug conjugates and nanoparticles prodrugs, drug conjugates and nanoparticles. J Controlled Release (2008) 132:171–83. doi:10.1016/j.jconrel.2008.05.010
15. Naveen R, Akshata K, Pimple nad S, Chaudhari P, A review on albumin as drug carrier in treating different diseases and disorders. Der Pharmacia Scinica (2016) 7(1):11–5.
16. Gillespie JR, Uversky VN, Structure and function of fetoprotein: a biophysical overview. Biovhimica Biophys Acta (2000) 1480:41–56. doi:10.1016/S0167-4838(00)00104-7
17. Magazu S, Calabro E, Phys H, Studying the electromagnetic-induced changes of the secondary structure of bovine serum albumin and the bioprotective effectiveness of trehalose by fourier transform infrared spectroscopy. Chem B (2011) 115:6818–26. doi:10.1021/jp110188k
18. Wischke C, Borchert HH, Fluorescein isothiocyanate labelled bovine serum albumin (FITC-BSA) as a model protein drug: opportunities and drawbacks. Pharmazie (2006) 61(9):770–4.
19. Jones LJ, Upson RH, Panchuk-Voloshina N, Zhou M, Haugland RP, Quenched BODIPY dye-labeled casein substrates for the assay of protease activity by direct fluorescence measurement. Anal Biochem Sep 5 (1997) 251(2):144–52. doi:10.1006/abio.1997.2259
20. Voss EW, Workman CJ, Mummert ME, Detection of protease activity using a fluorescence-enhancement globular substrate. Biotechniques (2018) 20(2):286–91. doi:10.2144/96202rr06
21. Wu H, Arosio P, Podolskaya OG, Wei D, Morbidelli M, Stability and gelation behavior of bovine serum albumin pre-aggregates in the presence of calcium chloride. Phys Chem Chem Phys (2012) 14:4906–16. doi:10.1039/C2CP40125H
22. Krause S, Okonski CT, Electric properties of macromolecules. III. Kerr constants and rotational diffusion of bovine serum albumin in aqueous solutions. J Am Chem Soc (1959) 81:5082–8. doi:10.1021/ja01528a017
23. Krause S, Okonski CT, Electric properties of macromolecules. VIII. Kerr constants and rotational diffusion of some proteins in water and in glycerol-water solutions. Biopolymers (1963) 1:503–15. doi:10.1002/bip.360010602
24. Rosseneu-Motreff M, Blaton V, Declercq B, Vandamme D, Peeters H, Size and shape determination of native and detatted bovine serum albumin monomers. J Biochem (1970) 68:369–77. doi:10.1093/oxfordjournals.jbchem.a129367
25. Ameseder F, Biehl R, Holderer O, Richter R, Stadler AM, Localised contacts lead to nanosecond hinge motions in dimeric bovine serum albumin. Phys Chem Chem Phys (2019) 21:18477–85. doi:10.1039/c9cp01847f
26. Barbosa LRS, Ortore MG, Spinozzi F, Mariani P, Bernstorff S, Itri R, The importance of protein-protein interactions on the pH-induced conformational changes of bovine serum albumin: a small-angle X-ray scattering study. Biophys J (2010) 10:147–57. doi:10.1016/j.bpj.2009.09.056
27. Donato wet al L, Garnier C, Doublier JL, Nicolai T, Influence of the NaCl or CaCl2 concentration on the structure of heat-set bovine serum albumin gels at pH 7. Biomacromolecules (2005) 6(4):2157–63. doi:10.1021/bm050132q
28. Aitken RJ, Curry BJ, ANTIOXIDANTS and REDOX SIGNALING, redox regulation of human sperm function: from the physiological control of sperm capacitation to the etiology of infertility and DNA damage in the germ line, vol. 14. New York, United States: Mary Ann Liebert, Inc. (2010). p. 367–81.
29. Kang K, Image time-correlation, dynamic light scattering, and birefringence for the study of the response of anisometric colloids to external fields. Rev Sci Instrum (2011) 82:053903. doi:10.1063/1.3589856
30. Mahmoudi N, Mehalebi S, Nicolai T, Durand D, Riaublanc A, Light-scattering study of the structure of aggregates and gels formed by heat-denatured whey protein isolate and β-lactoglobulin at neutral pH. Agric Food Chem (2007) 55(8):3104–11. Epub 2007 Mar 23. PMID: 17378578. doi:10.1021/jf063029g
31. Baussay K, Bon CL, Nicolai T, Durand D, Busnel JP, Influence of the ionic strength on the heat-induced aggregation of the globular protein beta-lactoglobulin at pH 7. Int J Biol Macromol (2004) 34(1-2):21–8. PMID: 15178005. doi:10.1016/j.ijbiomac.2003.11.003
Keywords: localized activities of BSA, effect of fatty acid, non-protease BSA aggregation, microscopic dynamics, oscillations in an intermediate scattering function, effect of low-AC electric fields
Citation: Kang K (2023) The effect of fatty acids, ionic strength, and electric fields on the microscopic dynamics of BSA aggregates. Front. Phys. 11:1282099. doi: 10.3389/fphy.2023.1282099
Received: 23 August 2023; Accepted: 03 October 2023;
Published: 20 October 2023.
Edited by:
Dmitry A. Fedosov, Helmholtz Association of German Research Centres (HZ), GermanyReviewed by:
Marian Wolszczak, Lodz University of Technology, PolandSurajit Chatterjee, Case Western Reserve University, United States
Copyright © 2023 Kang. This is an open-access article distributed under the terms of the Creative Commons Attribution License (CC BY). The use, distribution or reproduction in other forums is permitted, provided the original author(s) and the copyright owner(s) are credited and that the original publication in this journal is cited, in accordance with accepted academic practice. No use, distribution or reproduction is permitted which does not comply with these terms.
*Correspondence: Kyongok Kang, ay5rYW5nQGZ6LWp1ZWxpY2guZGU=