 Sheng Guan
 Yuanwen Zou*
- College of Biomedical Engineering, Sichuan University, Chengdu, China
Electrospun fibers are widely used in various fields of biology, medicine, and chemistry due to their unique morphological characteristics that determine their distinct application properties. Accurate and rapid classification of these fibers based on their morphology is critical for their effective utilization. Non-destructive and low-cost imaging methods are highly desirable for this purpose, so we obtained the polarization images of different forms of electrospun fibers (smooth surfaces, microporous, and beaded microspheres) by polarized light microscopy. In this study, we have explored the automatic classification of electrospun fibers based on their Mueller matrix depolarization parameter, which is highly correlated with the rough microporous structures on the surface of the object. To achieve this, we employed transfer learning and various convolutional neural networks (CNNs). Our proposed method outperformed the conventional approach that only utilizes a single Mueller matrix M44 image for classification, thus enabling researchers to effectively classify electrospun fibers. Given the high accuracy of our method, it may find significant utility in fields such as material science, nanotechnology, and bioengineering.
1 Introduction
Among the various fabrication techniques available, electrospinning stands out as a highly versatile and effective method for producing ordered or complex fiber assemblies with superior quality and precision [1]. The unique combination of precision, versatility, and scalability offered by electrospinning has made it an indispensable tool for researchers and practitioners working in the field of materials science. Furthermore, the rich array of innovative technologies available for use in electrospinning opens up a vast landscape of potential applications across multiple industries.
Conventional electrospun fibers possess outstanding properties such as simple fabrication, large surface area, and complex structure. These properties make them promising in various fields, such as biomedicine, tissue engineering [2] and chemistry [3]. The presence of microporous structures on electrospun fibers leads to higher porosity, larger specific surface area, and better pore connectivity [4], which significantly enhancing their performance for tissue engineering applications [5]. Therefore, the microporous structure can be considered as one of the key features of electrospun fibers. Currently, scanning electron microscopy (SEM) is primarily used by researchers to observe the morphological features of electrospun fibers due to its high magnification and excellent imaging quality. Although polarized light microscopy has a lower magnification, it can still produce super-resolution images [6]. Furthermore, polarized light imaging is non-destructive, cost-effective, and provides fast imaging capabilities. Therefore, if electrospun fibers are to be classified, the use of polarized light image classification is an excellent choice.
The Stokes vector [7] is a set of parameters describing the polarization state of electromagnetic waves, and the Mueller matrix is its corresponding state transformation matrix. At present, the Mueller matrix is widely used in various fields, Shih-Yau Lu and Russell A. Chipman [8] present an algorithm that decomposes a Mueller matrix into a sequence of three matrix factors, it is useful for performing data reduction on experimentally determined Mueller matrices, and it can extract the depolarization parameter Δ from the Mueller matrix. Ma Hui’s group took the backscattering Mueller matrices of tissues with distinctly different microstructures (e.g., bovine skeletal muscle tissue, porcine liver tissue), then used pixel frequency distribution histograms (FDHs) and central moment analysis to convert the two-dimensional Mueller matrix images into a set of quantitative metrics for characterizing the structural properties of the tissues. The results show that the distribution behavior of the Mueller matrix elements and the corresponding central moment parameters can be used as good indicators of tissue microstructure [9]. In addition, Ma Hui’s team also used the Mueller matrix polarity decomposition method to characterize the sphere-cylindrical birefringence model, and calculated the values of depolarization Δ, delay R, and attenuation parameters. The results show that the isotropic spherical scatterer contributes mainly to the depolarization Δ, the birefringence of the medium contributes only to the delay R, and the quasi-cylindrical scatterer contributes to both the delay and depolarization [10]. A. [11] presented a novel approach using the Mueller matrix method to analyze the optical anisotropy induced by quantitative uterine tumors and prostate tissues. The mean and dispersion of the sample distributions were characterized by computing first- and second-order moments of centrality statistics based on the elements of the Mueller matrix. This allowed the researchers to correlate the optical properties of the tissues with their pathological conditions, such as leiomyosarcoma in the uterus or different degrees of differentiation in the uterus and prostate. [12] conducted a pixel value analysis of electrospun fiber Mueller matrix images. The study showed that the last element of the Mueller matrix, M44, corresponding to the fourth row and column elements, had the highest sensitivity to the microporous structure of the electrospun fiber surface. Consequently, it was identified as a valuable feature for classifying different types of electrospun fibers based on their morphology. Although the deep learning automatic classification using M44 has been able to achieve a high accuracy rate, combined with the information carried by other elements, it may be able to achieve a better classification effect. The surface morphological features of electrospun fibers generally have three structures: smooth, microporous, and beaded microspheres, and the depolarization parameter Δ is strongly correlated with the surface roughness of objects [13]. In this paper, automatic classification is performed from this perspective using depolarization coefficient images, which contain more information about Mueller matrix elements and are highly correlated with the roughness of the object surface.
Deep learning automatic classification has become a mature and effective technique for accurately classifying image data in various fields. Convolutional Neural Networks (CNNs) have demonstrated exceptional performance in computer vision and image processing competitions [14]. For instance, [15] achieved precise classification of diabetic foot ulcers using a modified CNN, and [16] achieved ternary classification. However, the electrospun fiber image dataset used in this study is sparse, which often results in poor training results due to the limited data. To address this issue, transfer learning is applied to train the network initially with other similar datasets, and then the trained network is fine-tuned using sparse datasets to reduce the dependence on a large amount of target domain data to construct the target network [17]. [18] utilized transfer learning combined with CNN to further improve the accuracy of breast cancer classification. GoogleNet [19] and ResNet [20] trained on the ImageNet dataset were used for transfer learning and showed excellent performance in various applications [21]. In this paper, depolarization parameter Δ images and M44 images of electrospun fibers are fed into these three classical networks for classification respectively.
2 Materials and methods
2.1 Electrospun fiber production
The fundamental mechanism of electrospinning involves the acceleration of charged polymer droplets at the apex of the Taylor cone of a capillary by the electric field force. As the electric field force increases, the polymer droplets are able to overcome the surface tension of the solution and form a fine jet stream, resulting in the formation of a nonwoven-like fiber mat upon deposition onto a receiving device. The intricate interplay between the key parameters of electrospinning, including the solution viscosity, surface tension, and electrical conductivity, must be carefully controlled to achieve the desired fiber morphology and properties. In particular, the combination of these parameters plays a critical role in determining the diameter and orientation of the fibers, as well as their mechanical and chemical properties [22].
The primary materials used for electrospinning were polylactic acid (PLLA) and polycaprolactone (PCL), which are widely used polymeric materials in the biomedical field due to their exceptional hydrophobicity and biodegradability. To prepare the electrospun fibres, PLLA and PCL were dissolved in dichloromethane at different ratios. Then, 5 g of N,N-dimethylformamide (DMF) was added to prepare the spinning solution with a mass percentage ranging from 4 wt% to 8 wt%. The solution was stirred for 4 h at 25°C using a magnetic stirrer. Electrospinning was then initiated with the following parameters: static electric field voltage of 15 kV, a receiving device rotating at 100r/h, injection speed of 10 mL/h, receiving distance of 15 cm, spinning temperature of 15°C, humidity of 45% and spinning time of 30 min. PLLA and PCL were dissolved in dichloromethane at different ratios to produce electrospun fibers with various morphologies. Specifically, a ratio of 1:3 (PLLA:PCL) yields electrospinning in the form of beaded microspheres used in the experiments of this paper, and a 1:0 ratio produces microporous electrostatically spun fibers, while a ratio of 1:1 results in electrospinning with a smooth surface. These morphological variations hold significant implications for the performance and functionality of the electrospun fibers in biomedical applications.
The electrospun fibers used in this paper consists of three types of structures: beaded microspheres, smooth surface, and microporous. A total of 117 electrospun fiber samples were analyzed. The samples had a thickness of approximately 50 microns. Of these samples, 35 were smooth surface, 42 were microporous, and 40 were beaded microspheres. The SEM images of the three electrospun fiber morphologies are shown in Figure 1, allowing for easy visual comparison of the different structures. Under high magnification, the surface characteristics of the three different electrospun fibers show noticeable differences. These observations suggest that the surface morphology of electrospun fibers is influenced by various factors, including material composition and processing parameters used during fabrication.
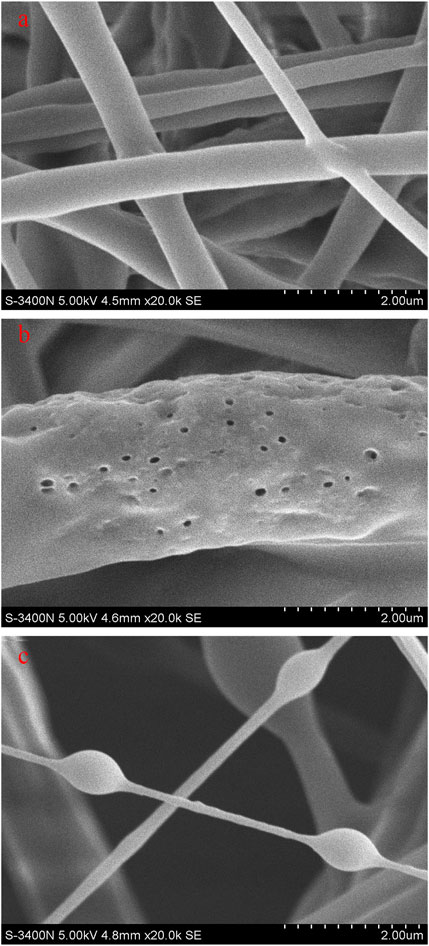
FIGURE 1. SEM images of different morphologies of electrospun fibers. The scale bars are all 2 μm (A) smooth surface; (B) microporous; (C) beaded microspheres.
2.2 Mueller matrix images and mueller matrix decomposition
The Stokes vector is a mathematical expression that characterizes the polarization state of light and contains four intensity components (I, Q, U, V). As a mathematically convenient alternative, it can replace the total intensity and polarization of the polarized radiation, as well as the shape parameter of the polarization ellipse, etc. The mathematical formulation of these parameters is not discussed in detail in this paper. For more information, please refer to the reference [7].
The Mueller matrix is a transformation matrix that relates the Stokes vector of incident light to that of reflected or transmitted light. As a 16-component matrix, it provides a sophisticated representation of the polarization properties of the media, with each sample corresponding to 16 Mueller matrix images. The relationship between the incoming polarized light Stokes vector Sin and the outgoing polarized light Stokes vector Sout is given by the following Eq. 1:
The polarized light microscope developed by the Shenzhen Key Laboratory of Nondestructive Monitoring and Minimally Invasive Medical Technology [23] was used to capture images at 400 magnification and 9000 microsecond exposure time. This polarisation microscope system consists of four main modules: the multi-wavelength collimated light source module (CLS), the polarised state generator (PSG), the polarised state analyser (PSA) and the image receiver module. It mainly adopts the dual-rotating quarter-wave plate Mueller matrix measurement method. For each measurement, the system acquires 30 polarisation component images corresponding to different combinations of PSG and PSA, and evaluates 16 Mueller matrix elements, which are finally imaged as 16 Mueller matrix images. Figure 2 shows the diagonal element images of the Mueller matrix, which show distinct morphological features. The diagonal element, which contains the most contour information, closely resembles the original image contour structure, making it the ideal classification feature. Due to the high magnification and resolution of SEM, we can directly distinguish SEM images of different types of electrospun fibers with the naked eye. However, in the case of Mueller matrix images of electrospun fibers, the distinction between different types of fibers is not immediately apparent. Although the structural information contained in the Mueller matrix diagonal element images is very close to the original sample image, it requires careful observation and analysis to determine the specific type of electrospun fiber from a single image without prior classification, but this is normal because a single Mueller matrix image can only capture a limited amount of the structural information present in the sample, and combining multiple images can provide more comprehensive information for accurate image classification. Therefore, we propose a classification method that uses the depolarization parameter images calculated from all 16 Mueller matrix images as classification features.

FIGURE 2. Diagonal element images of the Mueller matrix of electrospun fibers for three morphologies. Each set of images is from left to right for M11, M22, M33, and M44, with normalized color bars in the range of 0–1 on the right side of each small image. (A) Smooth surface; (B) micropores; (C) beaded microspheres.
After obtaining the polarized light images, we converted the obtained images to grayscale images and then normalized them to the same scale by mapping the grayscale values of the images to the range of 0–255 with the bound of the maximum and minimum values selected from all Mueller matrix images of the same type. [24] normalized each image by substituting its maximum and minimum grayscale values, which could further enhance the contrast, but this method increased the difference between similar images because each image had different maximum and minimum values, which was not friendly for classification.
Instead of using a single Mueller matrix element M44 in other classification experiments, we chose depolarization parameter images as features of electrospun fiber surface in this paper. [13] obtained Mueller matrix images of yttria-stabilized zirconia thermal barrier coatings using polarimeter architecture, then polarization decomposition was performed to extract polarization parameters Δ, diattenuation parameters D, and retardance R to analyze the surface structure of the samples. The results showed that Δ and D were closely related to the surface roughness and porosity of the samples, while there was no significant correlation with R. Microporous structures are highly suitable as classification features for different categories of electrospun fibers. When comparing Δ and D, the diattenuation parameter D is only calculated from the first row or column elements of the Mueller matrix, while the depolarization parameter includes almost all elements, and the diagonal elements, such as M33, M44, etc., obviously contain more information about the structure of the sample, indicating that the use of polarization parameters Δ was more suitable for automatic classification. Since the depolarization parameter is a better choice, the other two parameters are not verified here. The calculation of the depolarization parameter image in polarized light imaging is a crucial step in revealing the underlying microstructural information of a sample. The principle is as follows. A diagonal Mueller matrix is given below, it represents a pure depolarizer:
Its principal depolarization parameter of this depolarizer are represented by 1 − |a|, 1 − |b|, and 1 − |c|. These parameter indicate the depolarization capabilities of the polarizer along its principal axes. A parameter Δ is defined as follows:
Δ represents the average of the principal depolarization factors. Roughly speaking, this parameter indicates the averaged depolarization capability of this depolarizer. Let M be a depolarizing Mueller matrix. M can be decomposed using the algorithm proposed by Shih-Yau Lu and Russell A. Chipman [8], as follows:
In Eq. 4, MD represents a diattenuator, MR denotes a retarder, and MΔ stands for a depolarizer. Together, these three factors describe the diattenuation, retardance, and depolarization properties related to M. Therefore, Eq. 4 can be considered as a generalized polar decomposition for depolarizing Mueller matrices. Where the MΔ is:
Here mΔ is a 3*3 submatrix of MΔ, the depolarization parameter, denoted by Δ is calculated based on Eq. 2 and equation Eq 3:
where tr represents the trace of the 3 × 3 mΔ matrices.
Each pixel in the original sample is associated with a 4*4 Mueller matrix. Based on the principle described above, Δ can be calculated, then the depolarization parameter image can be obtained by calculating the Δ values of each pixel.
2.3 Depolarization parameter Δ images
In the previous section we described the principle of calculating the depolarization parameter Δ. Here we present the procedure for generating depolarization parameter images from 16 Mueller matrix images of electrospun fiber samples. First, the 16 Mueller matrix images of the sample are acquired and then read into the procedure. Next, a 4 × 4 Mueller matrix is acquired at each pixel of the 16 sample images. Following this, a singular value decomposition (SVD) of the matrix is then performed, and the depolarization parameter Δ is calculated from the singular values obtained. Subsequently, the depolarization parameter at all pixels is calculated and reconstructed into a depolarization parameter image. Furthermore, to ensure the consistency and reliability of the results, we normalize the obtained depolarization parameter image. This step is critical to ensure that variations in imaging conditions do not affect the accuracy of the results. Figure 3 shows the depolarization parameter images and M44 images for the electrospun fiber. It is visually apparent that the depolarization parameter image provides a stronger characterization of the electrospun fiber contours and microporosity, although it may enhance noise at the edges and exhibit some artifacts, which may be acceptable if it provides sufficient information.
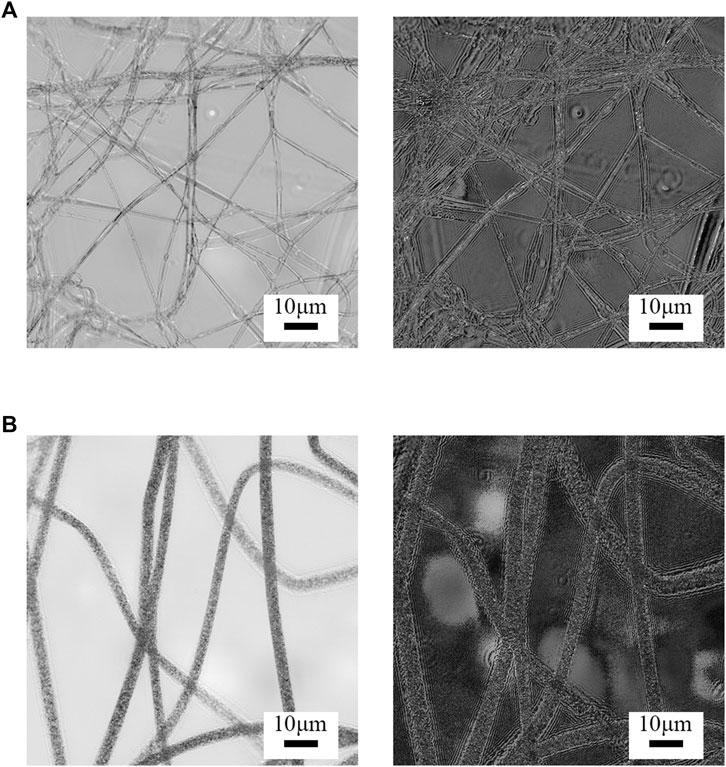
FIGURE 3. Images of depolarization coefficient of different forms of electrospun fibers, M44 images. (A) Smooth surface; (B) Microporous.
2.4 Dataset
As reported in the experiments by [12] and [25], the beaded microsphere structure of electrospun fibers can exhibit microporous structures due to differences in the fabrication process. Both M44 images and depolarization parameter images are sensitive to surface roughness and microporous structures. Therefore, it is necessary to exclude morphological structures with uncertain factors, such as beaded microspheres, and focus on the classification of microporous and smooth surface types of electrospun fibers.
To improve the classification accuracy, it is beneficial for the dataset used for transfer learning and the target dataset in this research to share some common characteristics. However, there are few publicly available datasets with a significant amount of polarized images. The ImageNet dataset is currently the world’s most extensive image recognition database. Given its massive size, we choose the Mini-Imagenet dataset, which was created by the Google DeepMind team in 2016 from a small portion of the Imagenet dataset [26]. The Mini-Imagenet dataset is approximately 2.9 GB in size and contains 100 categories, each with 600 images, for a total of 60,000 images. All images are cropped to a uniform size of 224*224.
As described in Section 2.1, the electrospun fiber image dataset used in this study consists of 117 samples classified into three categories: 35 were smooth surface, 42 were microporous, and 40 were beaded microspheres. Each sample contains 16 Mueller matrix images, and after calculation, there is one depolarization parameter image for each sample. All original images are 1001 × 1001 in size.
2.5 Classification method
GoogleNet [19] is equipped with the Inception-v3 module, which enables multiple convolution operations or pooling operations to be executed in parallel, effectively addressing the issues of parameter explosion and overfitting. Additionally, it utilizes fewer parameters for the same number of layers. ResNet [20], on the other hand, mainly uses the residual learning module, which effectively solves the gradient disappearance problem, allowing neural networks to have more layers. For the classic GoogleNet-Inception-v3 and ResNet152 structures, we did not make any significant changes to their main framework structure. Instead, we followed the structures described in their respective papers, and only made minor adjustments to the output layer and the softmax function to make it available for binary classification. Figure 4 shows the structure diagrams of two networks. (a) is the architecture of GoogleNet. Some of its more complex structures are represented by block diagrams. (b) is the ResNet152 network, which has a more complicated structure due to its 152-layer design, so we omit the intermediate sections for clarity. The red circled areas denote fully connected layers, while the blue circled areas also contain some convolutional layers. As proposed by Yosinski et al [27], it has been shown to be effective to pretrain a network with the Mini-Imagenet dataset and selectively freeze some of the initial layers to prevent overfitting. Subsequently, training the remaining layers with random initialization can significantly improve the performance of the network. Given the limited number of depolarized parameter images in our target dataset and the complexity of our network structure, we chose to freeze all layers prior to the fully connected layer (as shown by the red circled area in Figure 4) and train only the fully connected layer. The results obtained by Yunhun Jang et al [28] suggest that the deeper a layer is within the network architecture, the more specialized it is for a specific task and may not be optimal for transfer learning purposes. Therefore, in another comparative experiment, we left the last convolutional module unfrozen (as shown by the blue circled are-a in Figure 4).
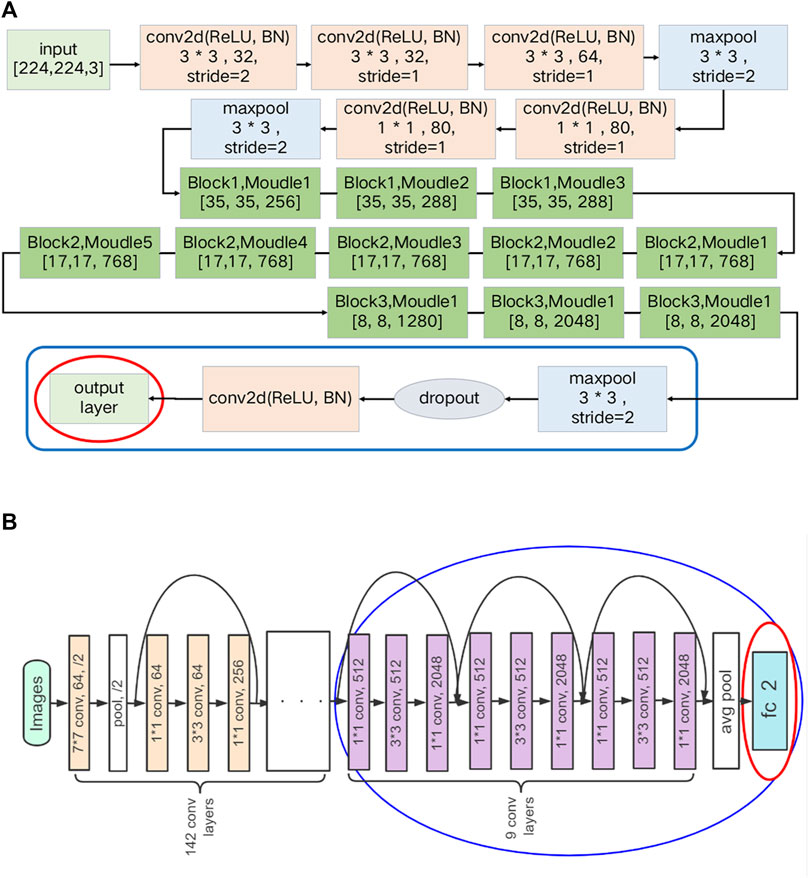
FIGURE 4. Structure of GoogleNet-Inception-v3 and ResNet152. (A) GoogleNet-Inception-v3; (B) ResNet152.
In the first stage of our experiment, our approach started by training GoogleNet and ResNet on the Mini-imagenet dataset, where we set the initial learning rate to 0.001. We then used the depolarization parameter Δ images training set to train the unfrozen parameters, reducing the initial learning rate to 0.0001 at this stage to prevent overfitting, and subjected the results to binary classification using softmax. For each class of electrospun fiber samples, we randomly selected 70% of the data for use in the training set and reserved the remaining 30% for evaluation in the test set and the batch-size is set to 12.
3 Results and discussion
The Mini-Imagenet dataset is divided into three files, namely train.csv, val.csv, and test.csv, which represent the training, validation, and test sets, respectively. We use the softmax loss curve of the trained model to determine whether the network is well trained. The loss value represents the difference between the predicted value and the true value of the model. Using the loss curve alone does not fully measure whether a network is well-trained, but it can confirm whether the model is overfitted. In particular, it determines whether the training, validation, and test sets can perform well on the model, which is necessary for the experiments in this paper. Figure 5 shows the graph of the loss decrease in the pre-training phase. The training and validation loss curves show small differences, with both decreasing to low values after 150 cycles of training before the differences begin to increase. The curves eventually flatten out after 200 training epochs. As a result, among the training epochs that exceed 200 training epochs, we select the epoch with the highest classification accuracy as the final result.
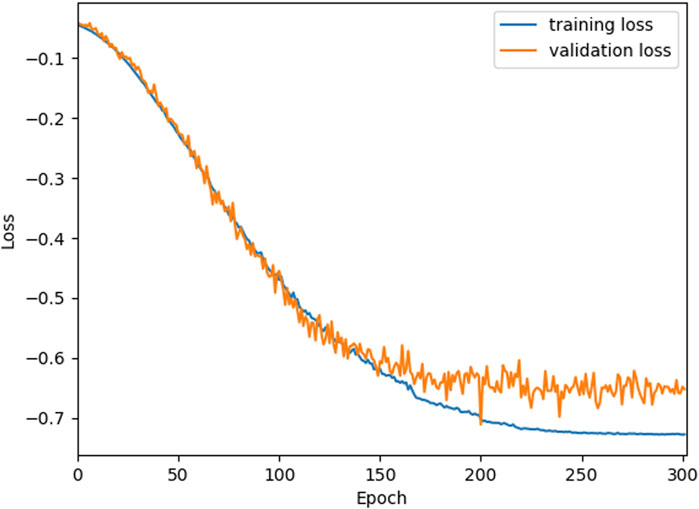
FIGURE 5. Softmax loss decline curve of the model in the transfer learning phase.
In order to standardise the criteria for comparison, the classifications are all subjected to 5-fold cross-validation, i.e. the results are averaged over 5 training and testing sessions. As described in Section 2.4, we used two different transfer learning modes after pre-training with Imagnet. One mode trained only the parameters of the fully connected layer, while the other mode trained both the fully connected layer and one of the previous convolutional modules. The training data set consists of depolarized parameter images. We also conducted an experiment to evaluate the direct feeding of depolarized parameter images into an untrained ResNet. The same training conditions and parameter settings were used as in the previous transfer learning experiments. Table 1 shows the results of these experiments in terms of training and test classification accuracy average and standard deviation (SD). The ResNet model without transfer learning showed a significant decrease in classification accuracy, reaching a maximum of only 79.35%. This level of accuracy is not suitable for practical engineering applications. Conversely, training the fully connected layer and one of the preceding convolutional modules on both GoogleNet and ResNet significantly improved classification accuracy. This trend is related to the large differences between the source and target datasets for migration learning, and deep network training significantly improved the target dataset classification rates. The reason for training no more than one convolutional module prior to the fully connected layer is that the number of depolarization parameter images is small, and training more parameters will cause overfitting problems and reduce the performance of the network. Finally, we selected the migration learning model with the highest classification rate as the optimal solution. Tables 2–4 is supplemented with additional classification outcome metrics for the two networks using the depolarization parameter images, precision: what proportion of samples predicted to be positive are actually positive, and recall: what proportion of positive samples are correctly predicted, with the F1 score representing the reconciled mean assessment metrics of precision and recall. The results in these tables show that the learning ability of ResNet and GoogleNet is very similar when using the dataset of this paper, and GoogleNet has only a very small advantage. And the difference in the number of different types of images in the dataset is not very large, so in the subsequent comparison of who has more classification advantage between M44 images and depolarization images, the focus is on the accuracy of classification.
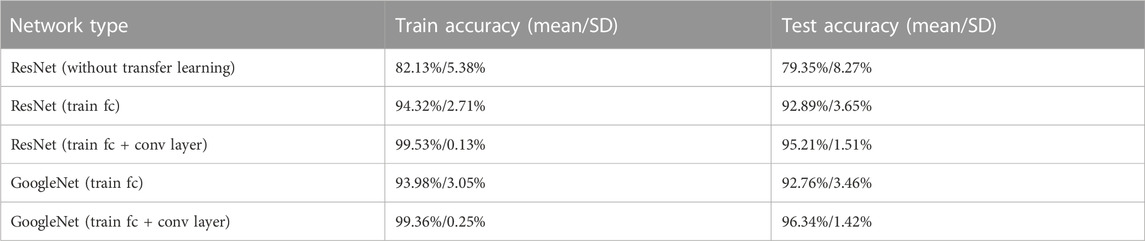
TABLE 1. Classification accuracy average and standard deviation of different transfer learning modes.

TABLE 2. Precision for different networks using the depolarization images.
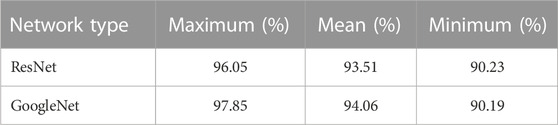
TABLE 3. Recall for different networks using the depolarization images.

TABLE 4. F-Score for different networks using the depolarization images.
After five training and testing sessions, the classification accuracy average and SD are shown in Table 5, using depolarization parameter Δ images as feature parameters for both training and test sets on ResNet effectively improved the classification accuracy compared to using M44 alone. However, there was no significant benefit from using Δ images on GoogleNet-Inception-v3. Picard David [29] conducted a study where he set different initial random seeds and trained and tested a nine-layer ResNet on a large amount of data, and concluded that the maximum difference in accuracy from different random seeds was generally 0.5%. Therefore, it is reasonable to infer that the small differences in results on Inception-v3 are probably due to the randomness in training the model. While no significant improvement was observed on GoogleNet-Inception-v3, this paper attempted to modify the relevant parameters before training to improve accuracy. Unfortunately, despite these efforts, the achieved accuracy did not exceed the highest value recorded in Table 5. This result shows that under the existing experimental conditions of this paper, the maximum classification accuracy achievable on GoogleNet is only about 96%. To achieve even higher accuracy, a more comprehensive dataset or a more complex network structure may be required. The advantage of using depolarization factor Δ images for classification will become even more apparent when higher classification accuracy can be achieved. Overall, the results indicate that using Δ images as a feature parameter in the classification process is better than using M44 images alone. The best results of the two networks were achieved using GoogleNet.
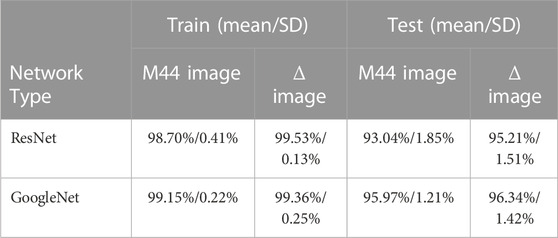
TABLE 5. Training and testing classification accuracy average and standard deviation of different networks under various conditions.
Macroscopically, the depolarization parameter image increases the amount of information compared to the M44 image. However, it also introduces additional noise that can affect the final classification accuracy. Nevertheless, the increased amount of information has a profounder and beneficial effect on the classification accuracy, resulting in a certain increase. Nonetheless, the influence of noise cannot be overlooked because the noise in polarized light images is caused by the polarized light microscope configuration and the acquisition environment. These factors are fixed during the experimental conditions and can only be reduced by subsequent algorithms. Unfortunately, conventional noise reduction methods are not suitable for polarized light images due to their unique characteristics and complexity. In addition, enhancing the quality of polarized light microscopy can significantly reduce noise levels and, to some extent, improve the classification accuracy of polarized light images. Researchers such as Singh, V [30] et al. have proposed multibeam polarization digital holographic interferometry (DHI), where two cross-polarization interferograms are recorded and Fourier analysis of the interferograms could reduce coherence noise and improve accuracy. Finally, it is important to note that noise reduction algorithms and microscopy research are beyond the scope of this paper. Interested readers are encouraged to explore relevant work in these areas for a more complete understanding of the subject.
4 Conclusion and future work
This paper proposes the use of depolarization parameter Δ images of electrospun fiber polarized light images as features for deep learning automatic classification. In order to achieve better classification results with a small amount of data of electrospun fiber polarized light images, we use transfer learning in combination with GoogleNet-Inception-v3 and ResNet, and utilize different transfer learning patterns to achieve high classification accuracy in deep learning-based automatic classification. By comparing the classification results using M44 images as features, the proposed method achieved the best and slight lead over GoogleNet-Inception-v3, with a classification accuracy of 96.34%. These results indicate that the depolarization parameter Δ image of the Mueller matrix contains sufficient information, and its use as features in the classification of electrospun fiber morphology is superior.
The proposed method presented in this study represents a powerful and practical method for the classification and detection of electrospun fibers, with significant implications for both research and industry. In particular, our approach offers improved accuracy in the identification of electrospun fibers, paving the way for more advanced analysis and characterization of these materials and providing a valuable tool for researchers and practitioners in the field of materials science and beyond. There is still room for improvement in our proposed method. Further optimization of processing techniques to reduce noise and artifact interference in the images can potentially increase the classification accuracy. More sophisticated training methods, such as transfer learning or fine-tuning, along with more complex network architectures, could potentially increase the discriminative power of our model and enable better classification performance. In addition, the use of more advanced polarized light microscopes can provide higher-precision and lower-noise polarized light images, which may lead to further improvements in classification accuracy.
Data availability statement
The data analyzed in this study is subject to the following licenses/restrictions: The polarized light image dataset of electrospun fibers presented in this study are available on request from the corresponding author: enl3QHNjdS5lZHUuY24=. The data are not publicly available due to the fact that the dataset was produced by our laboratory and therefore its ownership is vested in the laboratory. Requests to access these datasets should be directed to YZ, enl3QHNjdS5lZHUuY24=.
Author contributions
SG: Conceptualization, Data curation, Formal Analysis, Investigation, Methodology, Project administration, Resources, Software, Validation, Visualization, Writing–original draft, Writing–review and editing. YZ: Formal Analysis, Resources, Supervision, Validation, Writing–review and editing.
Funding
The author(s) declare that no financial support was received for the research, authorship, and/or publication of this article.
Acknowledgments
We would like to thank Prof. Sheng Yong’s group at the School of Materials, Sichuan University for his support.
Conflict of interest
The authors declare that the research was conducted in the absence of any commercial or financial relationships that could be construed as a potential conflict of interest.
Publisher’s note
All claims expressed in this article are solely those of the authors and do not necessarily represent those of their affiliated organizations, or those of the publisher, the editors and the reviewers. Any product that may be evaluated in this article, or claim that may be made by its manufacturer, is not guaranteed or endorsed by the publisher.
References
1. Ding J, Zhang J, Li J, Li D, Xiao C, Xiao H, et al. Electrospun polymer biomaterials. Prog Polym Sci (2019) 90:1–34. doi:10.1016/j.progpolymsci.2019.01.002
2. Zhang X, Shi X, Gautrot JE, Peijs T. Nanoengineered electrospun fibers and their biomedical applications: A review. Nanocomposites (2021) 7:1–34. doi:10.1080/20550324.2020.1857121
3. Lerond M, Subramanian A, Skene WG, Cicoira F. Combining electrospinning and electrode printing for the fabrication of stretchable organic electrochemical transistors. Front Phys (2021) 9. doi:10.3389/fphy.2021.708914
4. Baji A, Mai YW, Wong SC, Abtahi M, Chen P. Electrospinning of polymer nanofibers: Effects on oriented morphology, structures and tensile properties. Composites Sci Tech (2010) 70:703–18. doi:10.1016/j.compscitech.2010.01.010
5. Ramakrishna S, Fujihara K, Teo WE, Yong T, Ma Z, Ramaseshan R. Electrospun nanofibers: solving global issues. Mater Today (2006) 9:40–50. doi:10.1016/S1369-7021(06)71389-X
6. Yu S, Dai J, Liao R, Chen L, Zhong W, Wang H, et al. Probing the nanoplastics adsorbed by microalgae in water using polarized light scattering. Optik (2021) 231:166407. doi:10.1016/j.ijleo.2021.166407
7. Azzam RMA, Bashara NM, Thorburn Burns D. Ellipsometry and polarized light. Analytica Chim Acta (1987) 199:283–4. doi:10.1016/S0003-2670(00)82849-4
8. Lu SY, Chipman RA. Interpretation of Mueller matrices based on polar decomposition. J Opt Soc America a-Optics Image Sci Vis (1996) 13:1106–13. doi:10.1364/JOSAA.13.001106
9. He C, He H, Li X, Chang J, Wang Y, Liu S, et al. Quantitatively differentiating microstructures of tissues by frequency distributions of Mueller matrix images. J Biomed Opt (2015) 20:105009. doi:10.1117/1.JBO.20.10.105009
10. Guo Y, Zeng N, He H, Yun T, Du E, Liao R, et al. A study on forward scattering Mueller matrix decomposition in anisotropic medium. Opt Express (2013) 21:18361–70. doi:10.1364/OE.21.018361
11. Dubolazov A, Ushenko V, Trifonyuk L, Stashkevich A, Soltys I, Ushenko Y, et al. Polarization-singular approach to imaging mueller-matrix polarimetry in the differential diagnosis of histological sections of biopsy of tumors of the uterus and prostate. Front Phys (2021) 9. doi:10.3389/fphy.2021.711212
12. Wang J, Li X, Zou Y, Sheng Y. Mueller matrix imaging of electrospun ultrafine fibers for morphology detection. Appl Opt (2019) 58:3481–9. doi:10.1364/AO.58.003481
13. Luo DA, Barraza ET, Kudenov MW. Mueller matrix polarimetry on plasma sprayed thermal barrier coatings for porosity measurement. Appl Opt (2017) 56:9770–8. doi:10.1364/AO.56.009770
14. Russakovsky O, Deng J, Su H, Krause J, Satheesh S, Ma S, et al. ImageNet large scale visual recognition challenge. Int J Comput Vis (2015) 115:211–52. doi:10.1007/s11263-015-0816-y
15. Alzubaidi L, Fadhel MA, Oleiwi SR, Al-Shamma O, Zhang J. DFU_qutnet: diabetic foot ulcer classification using novel deep convolutional neural network. Multimedia Tools Appl (2020) 79:15655–77. doi:10.1007/s11042-019-07820-w
16. Kang S, Park H, Park JI. CNN-based ternary classification for image steganalysis. Electronics (2019) 8:1225. doi:10.3390/electronics8111225
17. Zhuang F, Qi Z, Duan K, Xi D, Zhu Y, Zhu H, et al. A comprehensive survey on transfer learning. Proc IEEE (2021) 109:43–76. doi:10.1109/JPROC.2020.3004555
18. Alzubaidi L, Al-Shamma O, Fadhel MA, Farhan L, Zhang J, Duan Y. Optimizing the performance of breast cancer classification by employing the same domain transfer learning from hybrid deep convolutional neural network model. Electronics (2020) 9:445. doi:10.3390/electronics9030445
19. Szegedy C, Liu W, Jia Y, Sermanet P, Reed S, Anguelov D, et al. Going deeper with convolutions (2015). Available at: https://arxiv.org/abs/1409.4842 (Accessed February 24, 2023).
20. He K, Zhang X, Ren S, Sun J. Deep residual learning for image recognition (2015). Available at: https://arxiv.org/abs/1512.03385 (Accessed March 03, 2023).
21. Baykal E, Dogan H, Ercin ME, Ersoz S, Ekinci M. Transfer learning with pre-trained deep convolutional neural networks for serous cell classification. Multimedia Tools Appl (2020) 79:15593–611. doi:10.1007/s11042-019-07821-9
22. Xue J, Xie J, Liu W, Xia Y. Electrospun nanofibers: new concepts, materials, and applications. Acc Chem Res (2017) 50:1976–87. doi:10.1021/acs.accounts.7b00218
23. Zhou J, He H, Chen Z, Wang Y, Ma H. Modulus design multiwavelength polarization microscope for transmission Mueller matrix imaging. J Biomed Opt (2018) 23:1. doi:10.1117/1.JBO.23.1.016007
24. Ma M, Zou Y, Huang Z. Deep learning-based automated morphology classification of electrospun ultrafine fibers from M44 element image of muller matrix. Optik (2020) 206:164261. doi:10.1016/j.ijleo.2020.164261
25. Li X, Zhu Y, Ma H, Sheng Y. A polarization method for quickly distinguishing the morphology of electro-spun ultrafine fibers. Chin Chem Lett (2018) 29:1317–20. doi:10.1016/j.cclet.2018.05.042
26. Vinyals O, Blundell C, Lillicrap T, Kavukcuoglu K, Wierstra D. Matching networks for one shot learning. In: Proceedings of the 30th International Conference on Neural Information Processing Systems; December 2016; Red Hook, NY, USA (2016).
27. Yosinski J, Clune J, Bengio Y, Lipson H. How transferable are features in deep neural networks? (2014). Available at: https://arxiv.org/abs/1411.1792 (Accessed May 31, 2023).
28. Jang Y, Lee H, Hwang SJ, Shin J. Learning what and where to transfer (2019). Available at: https://arxiv.org/abs/1905.05901 (Accessed June 13, 2023).
29. Picard D. Torch.manual_seed(3407) is all you need: on the influence of random seeds in deep learning architectures for computer vision (2021). Available at: https://arxiv.org/abs/2109.08203 (Accessed March 03,2023).
30. Singh V, Singh G, Ahmad A, Dubey V, Butola A, Joshi T, et al. Polarization interferometric digital holographic microscope for quantitative phase imaging and coherent noise reduction. In: Proceedings of the European Conferences on Biomedical Optics; February 2016; Rome Italy (2016). doi:10.1117/12.2291654
Keywords: polarized light imaging, electrospun fibers, automatic classification, mueller matrix, depolarization parameter
Citation: Guan S and Zou Y (2023) Automatic classification of electrospun fiber polarized light images using mueller matrix depolarization parameter. Front. Phys. 11:1264850. doi: 10.3389/fphy.2023.1264850
Received: 21 July 2023; Accepted: 25 August 2023;
Published: 26 September 2023.
Edited by:
Xueli Chen, Xidian University, ChinaReviewed by:
Honghui He, Tsinghua University, ChinaRadu Hristu, Polytechnic University of Bucharest, Romania
Copyright © 2023 Guan and Zou. This is an open-access article distributed under the terms of the Creative Commons Attribution License (CC BY). The use, distribution or reproduction in other forums is permitted, provided the original author(s) and the copyright owner(s) are credited and that the original publication in this journal is cited, in accordance with accepted academic practice. No use, distribution or reproduction is permitted which does not comply with these terms.
*Correspondence: Yuanwen Zou, enl3QHNjdS5lZHUuY24=