 Panagiota Galanakou
 Wazir Muhammad
- Department of Physics, Florida Atlantic University, Boca Raton, FL, United States
Introduction: Various prompt gamma (PG) ray-based techniques have been proposed to monitor the proton range during treatment, but the poor PG statistics produced entangle their clinical application. Recently, we developed a Monte Carlo (MC) simulation model for the enhancement of PG production based on the nuclear cross section of protons with the material transversed, via inserting the non-radioactive elements 19F, 17O, and 127I in a hypothetical tumor area. This work aimed to study the dose distribution changes caused by the addition of specific % weight fractions of PG enhancers in a water medium using MC simulations.
Methods: Our MC model was created using the TOPAS MC package and retaining identical geometries, mixture compositions, and incident proton energies (75, 100, and 200 MeV, respectively) previously tested for the PG statistics enhancement. The total dose deposition in water and in mixture compositions that have been found to maximally increase the PG production was scored and evaluated based on the important dosimetric metrics R90, Bragg peak (BP) width, and full width at half maximum (FWHM). Furthermore, the spatial correlation of PG emissions relative to BPs was also studied and compared on the basis of the BP decrease at R90.
Results and Discussion: There is no significant change in total dose deposition except for 127I. However, dose curve shifts in R90 toward shallower depth, followed by steeper BP and reduced FWHM, were observed in all cases. The percentage changes vary with incident proton energies and mixture compositions. The addition of the stable elements had no effect on the PG spatial emission. The dosimetric study reveals that the addition of the tested stable elements did not change the dose distribution and did not alter the dose deposited by secondary particles. Since their addition increases the electron density of the medium, the shift of BP to shallower depths is linked with the mixture composition changes. Furthermore, a steeper BP value is observed that could be beneficial for OAR avoidance. Since this theoretical study of using 19F, 17O, and 127I as PG enhancers is promising from a dosimetric point of view, experimental studies are necessary to determine their clinical application feasibility.
1 Introduction
There are currently 100 clinically active proton therapy centers worldwide [1], and nearly the same number is projected to open by 2025 [1]. The growth of proton centers is justified by the dosimetric advantages of proton therapies versus conventional photon therapies, [2] namely, the accumulation of most of their dose in a sharp peak known as the Bragg peak [2], reduced entrance dose, and dose control in the surrounding organs-at-risk (OARs). Nevertheless, 2.5% of the prescribed proton range +1.5 mm clinical margins and up to 3.5% of the prescribed proton range +3 mm have been added during proton therapy to account for physical and biological uncertainties of proton propagation into the human body [2, 3]. The main causes of physical uncertainties are related to the conversion of the diagnostic computed tomography (CT) images into related proton stopping power, the precise calculation of ionization potential for different types of human tissues, and the accurate proton range determination. Biological uncertainties due to intra-fraction and inter-fraction patient motion, anatomical changes due to treatment, and image quality contribute to the uncertainty margins.
Various methodologies [4–6] have been developed to address proton range uncertainties in order to fully benefit from the advantages of charged particle therapies. One of the most promising methods is based on monitoring the prompt gamma (PG) emission during a proton interaction with the human body [4]. Inelastic collisions of protons with nuclei of the medium result in excited nuclear reaction products, which, during de-excitation, instantaneously (∼1 ns after a proton–matter interaction) emit PG rays along the beam path in the medium transversed [7]. The PG non-isotropic distribution has been linked with the distal decrease of Bragg peak in a water phantom and, thus, with the proton range [8, 9]. PG spectroscopy (PGS) has been suggested [10] for in vivo PG tracking because the emitted PG energy lines are unique, given the energy dependence of the tissue–nuclear characteristics and nuclear cross sections. Specifically, the 4.44- and 6.15-MeV PG emission rays, referred to as P1 and P2 peaks, respectively, not only provide in vivo beam range tracking [4] but also useful information on the concentration of carbon and oxygen in the irradiated tumor target and tissue composition, and changes of OARs during the treatment [7, 11, 12].
Significant progress has been made to bring the PG concept into real-time proton range tracking in clinical settings, and the prototype has been developed [10]. The disadvantages of previously proposed techniques in PG clinical application are the increased algorithmic complexity, the highly sophisticated detection methodologies that need to account for the plethora of PG emissions, and their ability to accurately detect and record only the energies of interest. Krimmer et al. [4] suggest the major issue that entangles the clinical implementation of PG technology is the low PG production statistics. To alleviate this issue and assist the already developed technologies, Galanakou et al. [13] recently suggested that injecting a weight % of the non-radioactive elements 19F, 17O, and 127I in a hypothetical tumor area increases the PG statistics in the energy range that has already been linked to proton range verification in vivo. This technique has only been proven by simulations, and it appears very promising. For instance, adding 0.1% of 19F in the hypothetical tumor area increases the P1 statistics by 16% and by ∼4% for P2 production when 75-MeV proton energy irradiates the medium. Similar trends were found for the 100-MeV incident proton beam. With a 200-MeV incident proton beam energy injection of 1% up to 15% 127I, the P2 statistics increased up to 16% [13].
In this work, we present the dosimetric characteristics of injecting 19F, 17O, and 127I in a hypothetical tumor area that is irradiated with 75, 100, and 200 MeV incident proton energies, respectively, in mixture compositions that were previously found [13] to increase at maximum the PG statistics of P1 and P2. Emphasis is given to dose deposition comparisons with and without the addition of the stable elements to check if the proposed theory alters the expected dose distribution. We quantify the dose changes and present the PG spatial emission correlation with the Bragg peak (BP) position, with and without the injection of stable elements. The information provided could assist in the development of a PG imaging system that tracks BP in vivo when non-radioactive elements are injected.
2 Materials and methods
2.1 Simulation setup
TOol for PArticle Simulation (TOPAS) Monte Carlo (MC) package version 3.5 was utilized [14] to create our simulation code based on the geometry and physics settings selected by [13] Galanakou et. al. Specifically, Figure 1 shows the simulation setup: an outer water-filled cylinder which is 10 cm in diameter and 20 cm in length for a 75-MeV and a 100-MeV proton beam irradiating the medium. When the incident proton beam energy increased to 200 MeV, the length was increased to 30 cm to ensure that the beam fully stops inside the medium transversed. The outer cylinder represents an ideal detector, which is binned (divided in 1,000 bins) longitudinally in the beam direction with a bin width of 0.02 cm for 75 MeV (case I) and 100 MeV (case II), and 0.03 cm for the 200-MeV proton energy (case III). These proton energies were selected since they span along the useful clinical proton beam energy ranges, i.e., shallow tumor sites (∼75 MeV) to deep-seated tumors (∼230 MeV). The bin width selection was performed after trial and error. For instance, in case I, the PG rays were scored with a step of 2 mm depth because a larger bin width resulted in peak overlap phenomena, while a smaller bin size increased the execution time while giving the same result. The inner cylinder is the hypothetical tumor area with the same length as the outer cylinder and a diameter half of its length. The concentric cylinders are placed inside the simulation geometry defined by the light blue box that is filled with G4_AIR material [14]. The physics list used includes the following: “g4em-extra,” “g4em-standard_opt4,” “g4ion-binarycascade,” “g4stopping,” “g4decay,” “g4h-phy_QGSP_BIC_HP,” and “g4radioactivedecay.” The list considers both electromagnetic and hadronic interactions, and contains the full cross-section calculations for the proton transport and secondary particles generated.
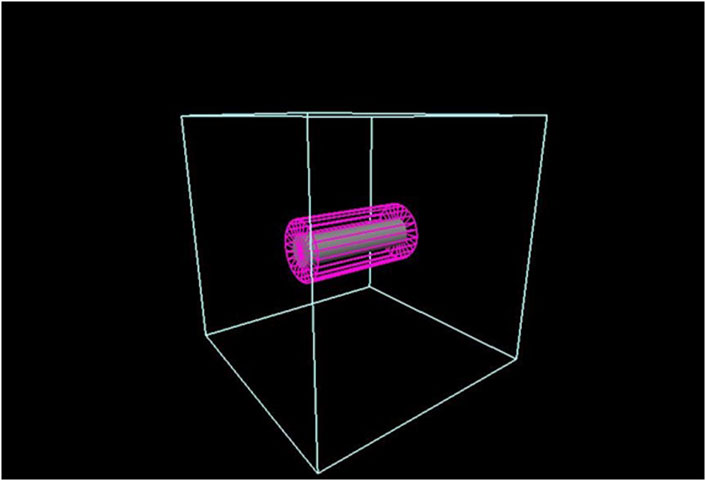
FIGURE 1. TOPAS simulation geometry is defined by the light blue box that is filled with G4_AIR. The ideal cylindrical detector is represented in pink. The hypothetical tumor is shown as a gray co-cylinder inside the detector.
First, we simulated the PG energy spectra for 75, 100, and 200 MeV incident proton energies in the full water-filled geometry to characterize the origin of the peaks and replicate similar PG spectra [13]. Then, we inserted the smallest weight (wt) % fractions of the 19F, 17O, and 127I elements that resulted in the greatest P1 and/or P2 production increase [13] in the inner cylinder. We assume that the non-radioactive elements fully diffused in the inner cylinder and that the mixture is dissolved. The wt% of the stable elements added in the inner cylinder and their corresponding P1 and/or P2 percentage increase are listed in Table 1.
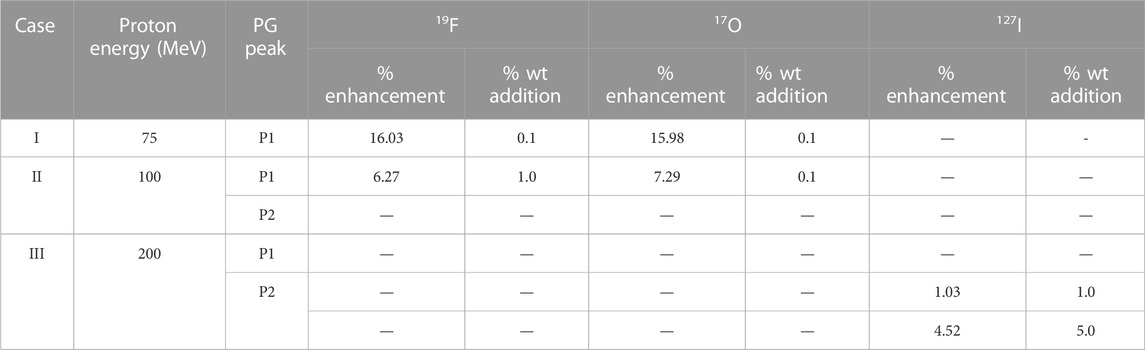
TABLE 1. Mixture compositions used for three incident proton energies, 75 MeV noted as case I, 100 MeV noted as case II, and 200 MeV noted as case III, along with the smallest % wt addition of the stable elements and greatest % PG enhancement [13].
2.2 Dose comparisons
The Bragg peaks (BPs) for the three incident proton energies were produced in water and were compared with those resulting from the addition of stable elements in the mixture. The comparisons were based on the fundamental dosimetric quantities R90, R80a, R80b, R50a, and R50b. The proton range is defined [15] as the R90 point in water where the proton has 90% of its dose in the distal decline of pristine BP. The difference between R80b and R80a represents the width of BP, where a and b are the points proximal and distal to BP, respectively, where the proton has 80% of its initial energy. R80b corresponds to the mean projected range of a clinical proton beam and depends on the initial energy spread. The difference of R50b–R50a, that is the 50% dose level, is considered the full width of half maximum (FWHM) of the beam. It was also used since beam spot sizes are evaluated at FWHM in vertical and horizontal dimensions. The dose deposited by protons, alpha particles, neutrons, and total gamma rays was scored in the whole simulation volume and compared with and without the selected stable elements in terms of total dose deposition in Gy.
2.3 PG emission
The spatial correlation between inelastic (proton-nucleus collision) PG emissions of 4.44 and 6.15 MeV and the proton range was studied by simulating the longitudinal distribution of PG rays of P1 and P2 concerning BP for addition of 75 MeV and 0.1% 19F. A parallel geometry was added in the center of the simulation geometry (Figure 1). A phase–space file was created by selectively scoring the origin of PG rays of 4.44 and 6.15 MeV generated in the inner cylinder (the hypothetical tumor area), where the incident’s beam direction (z-direction) was divided into 1,000 bins. The BP of the 75-MeV proton beam was plotted to show the correlation between BP and P1 and P2 spectra with and without the addition of 19F. Then, 106 proton histories were simulated to study this correlation with an associated statistical error of
3 Results
Numerical results for case I, II, and III are given in Table 2. When a 75-MeV proton beam irradiated the simulation geometry (Figure 1) that was fully water-filled, the total dose deposited was 7.51 cGy. With the addition of 0.1% 19F to the mixture, the total dose deposited was decreased by 0.06%. This is because the BP width and FWHM were reduced by 25% and 9.5%, respectively, with the addition of the non-radioactive element, making BP steeper. The BP width and FWHM in water were 0.16 cm and 0.42 cm, and by adding 19F were 0.12 and 0.38 cm, respectively (Figure 2A).
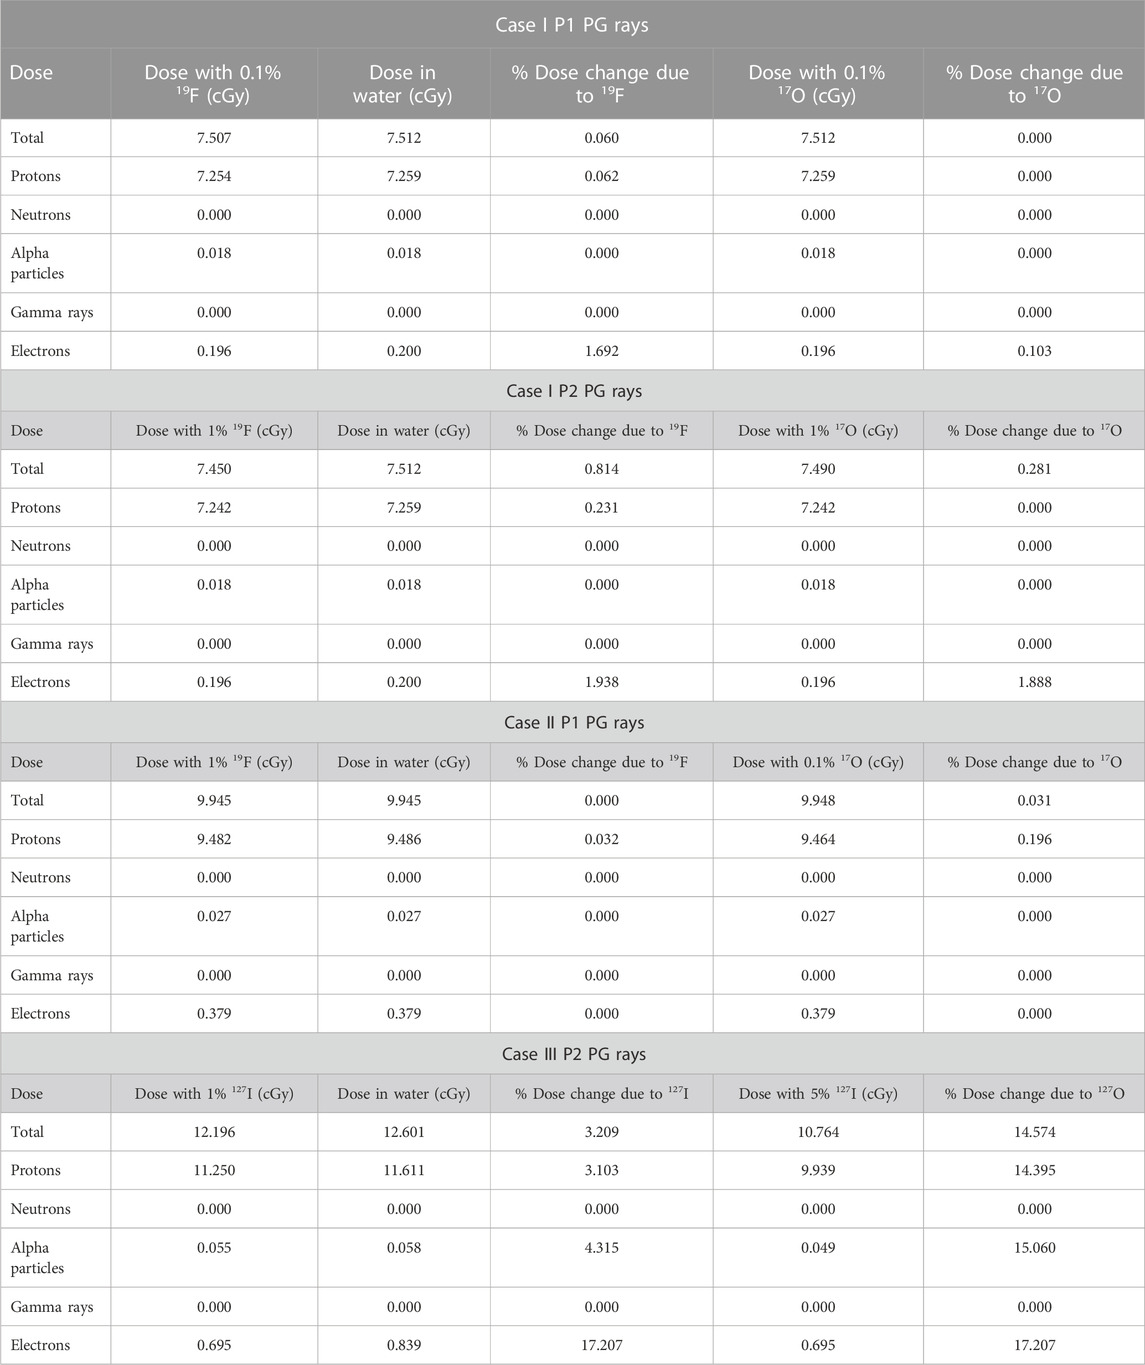
TABLE 2. Quantitative dose results for total dose deposition, dose deposited by protons, neutrons, alpha particles, gamma rays, and electrons with and without the addition of the stable element for all cases tested, as shown in Table 1.
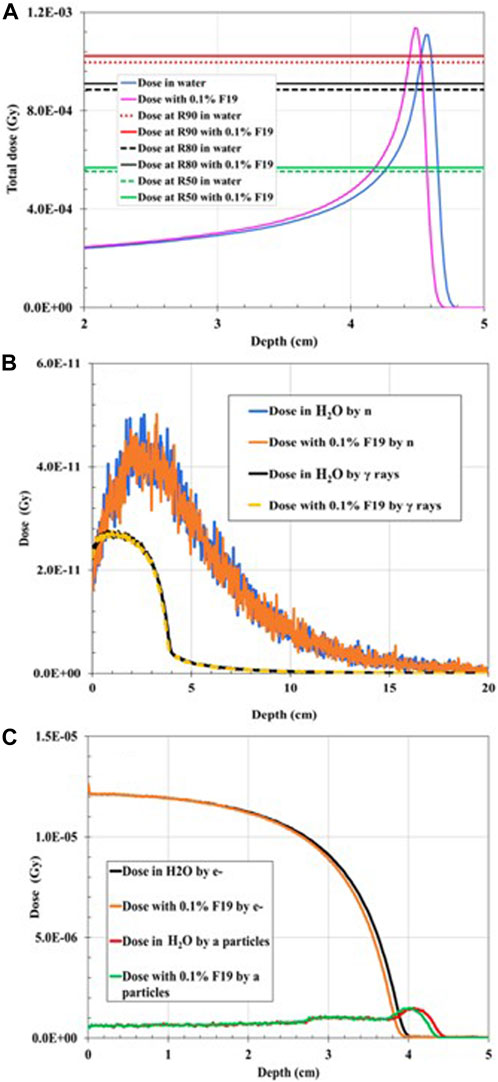
FIGURE 2. Dose distribution as a function of depth for 75-MeV proton irradiation: (A) total dose distribution in water (H2O)-filled geometry compared to the total dose distribution when 0.1% 19F was added to the mixture. (B) Dose distribution deposited by gamma rays (γ) in water-filled geometry compared to the dose distribution deposited by neutrons (n) when 0.1% 19F is added to the mixture. (C) Dose distribution deposited by electrons (e−) in water-filled geometry compared to the dose distribution deposited by alpha particles when 0.1% 19F was added to the mixture.
The proton range in water at R90 is 4.62 cm, which coincides with the PSTAR library [16]. The dose deposited by neutrons (Figure 2B), gamma rays (Figure 2B), alpha particles (Figure 2C), and electrons (Figure 2C) is also plotted. It was found that there is no significant change in the dose deposition with the addition of 19F, as listed in Table 2. Nevertheless, by comparing the proton range in water at R90 with the proton range in the water-filled simulation geometry with the addition of 0.1 wt% of 19F, R90 shifted to the left by 0.87% (Table 3) and by 2.38% due to alpha particles. At the R50 point of the depth, where the dose falls to 50% of its maximum, the depth dose curve was shifted due to electron to the left by 2.26% (Table 3) when the stable element was added to the geometry. Negligible dose distribution curve changes were found for neutrons and gamma dose depositions in the simulation geometry. A remaining dose of 0.035 cGy is missing after the summation of the dose deposited by the most prominent particles, as listed in Table 2. This is expected since the proton interacts with matter through various paths [17]. Among these, the non-elastic nuclear reactions could lead to secondary projectiles like heavier ions that were not scored. The small dose difference could also be explained by Bremsstrahlung radiation, which was not considered in this study.

TABLE 3. Dosimetric comparisons of BP width, R90, FWHM, and R50 metrics with and without the stable elements for case I P1 PG rays (A), case I P2 PG rays (B), case II P1 rays (C), and case III P2 rays (D).
The addition of 0.1% 17O reduced FWHM to 0.36 cm from the initial 0.42 cm (14.29% decrease). The numerical results for the addition of 0.1% 17O are given in Tables 2, 3, while the total dose deposition (Figure 3A), dose curves for neutrons (Figure 3B), gamma rays (Figure 3B), alpha particles (Figure 3C), and electrons (Figure 3C) are plotted. Similar results were found for case I P2 PG rays, for which the quantitative dosimetric comparisons are summarized in Tables 2, 3. The addition of 1% 19F and 1% 17O leads to similar results. Total dose reduced by 0.814% and 0.281%; BP width dropped by 19.75% and 25%, when 1% 19F and 1% 17O were added, respectively; R90 shifted toward a shallower depth by 2.16%; and FWHM dropped by 14.29% for both cases.
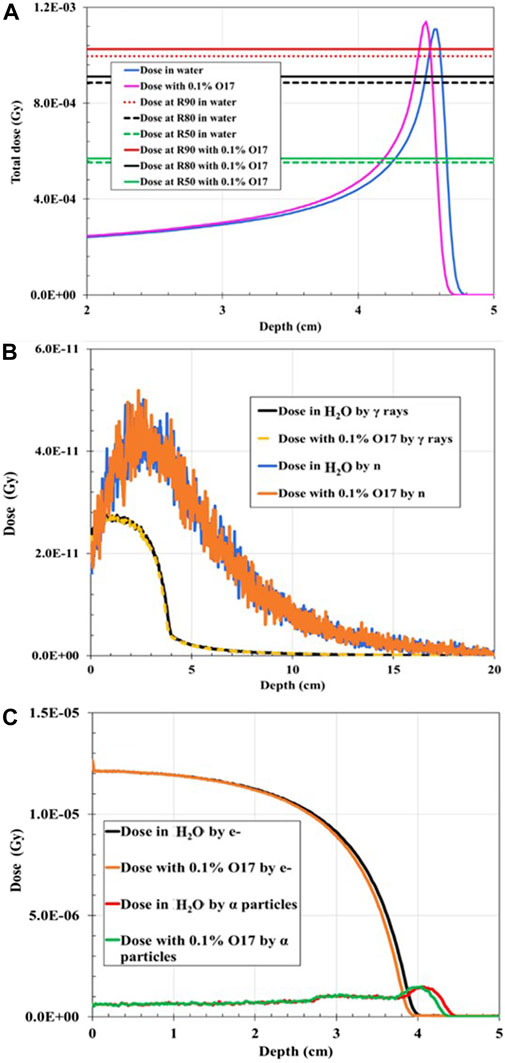
FIGURE 3. Dose distribution as a function of depth for 75 MeV proton irradiation: (A) Total dose distribution in water-filled geometry compared to the total dose distribution when 0.1% 17O was added to the mixture. (B) Dose distribution deposited by gamma rays (γ) in water-filled geometry compared to the dose distribution deposited by neutrons (n) when 0.1% 17O is added to the mixture. (C) Dose distribution deposited by electrons (e−) in water-filled geometry compared to the dose distribution deposited by alpha particles when 0.1% 17O was added to the mixture.
When the 100-MeV proton beam irradiated the water-filled geometry, the R90 and BP characteristics agreed with the PSTAR library. However, the proton range shifted toward the shallower depth by 0.26% when 1% of 19F was added to the mixture in comparison with the full water-filled geometry (Figure 4). The BP width decreased by ∼15%, and FWHM decreased by ∼3%, while the proton R90 shifted to 7.76 cm (with 1% 19F addition) from 7.78 cm (when H2O only). When 0.1% of 17O was injected into the hypothetical tumor area, the total dose of R90 shifted to 7.69 cm from the initial 7.78 cm, given that the proton R90 moved toward a shallower depth by 1.16% and R90 due to alpha particles by 1.38% (Figure 5). It was also found that the dose distribution due to electrons was unaffected by the addition of the stable element in the mixture composition. As shown in Table 2, the total dose deposited when 1% 19F was added was unchanged but decreased by 0.031% when 0.01% 17O was added compared with the fully water-filled geometry.
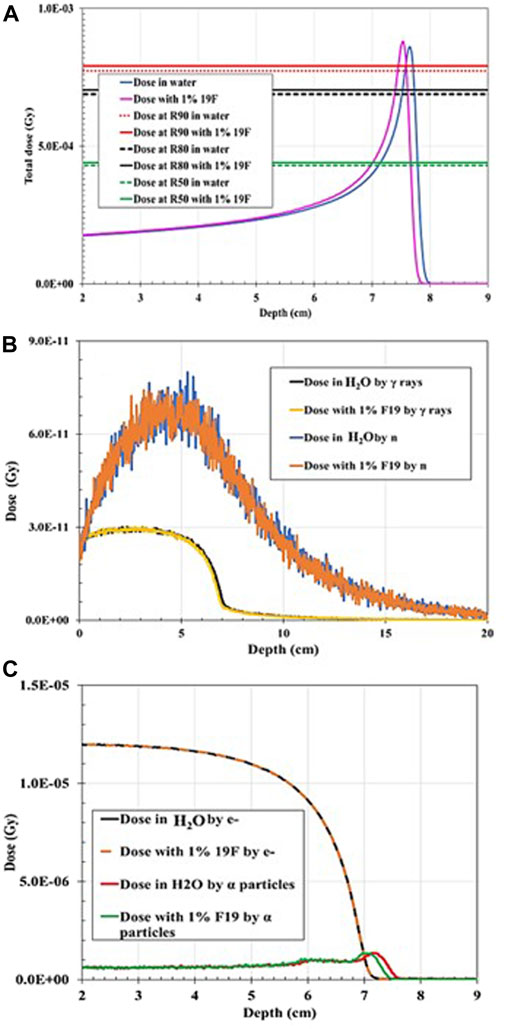
FIGURE 4. Dose distribution as a function of depth for 100 MeV proton irradiation: (A) Total dose distribution in water-filled geometry compared to the total dose distribution when 1% 19F is added to the mixture. (B) Dose distribution deposited by gamma rays (γ) in water-filled geometry compared to the dose distribution deposited by neutrons (n) when 1% 19F is added to the mixture. (C) Dose distribution deposited by electrons (e−) in water-filled geometry compared to the dose distribution deposited by alpha particles when 1% 19F is added to the mixture.
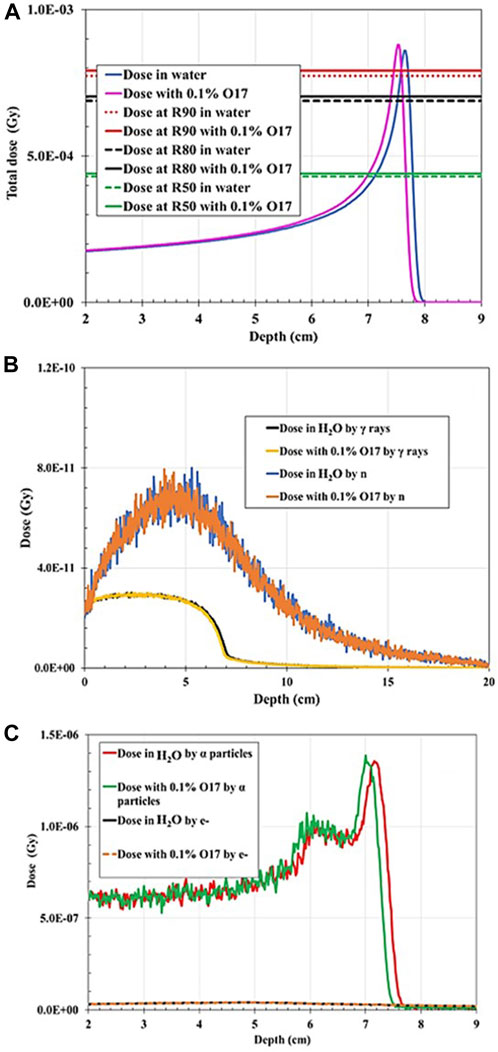
FIGURE 5. Dose distribution as a function of depth for 100 MeV proton irradiation: (A) Total dose distribution in water-filled geometry compared to the total dose distribution when 0.1% 17O was added to the mixture. (B) Dose distribution deposited by gamma rays (γ) in water-filled geometry compared to the dose distribution deposited by neutrons (n) when 0.1% 17O is added to the mixture. (C) Dose distribution deposited by electrons (e−) in water-filled geometry compared to the dose distribution deposited by alpha particles when 0.1% 17O is added to the mixture.
When the 200-MeV proton beam irradiated the water-filled simulation geometry, R90 agreed with the PSTAR library. However, R90 shifted dramatically to shallower depths by 5% when a 1 wt% of 127I was added, and by ∼15%, when 5 wt% of 127I was added in the hypothetical tumor volume. For both wt% 127I additions, FWHM decreased by 18.6%, and the BP width, by ∼22% and ∼30%, accordingly, as plotted in Figures 6, 7. The dramatic shift toward shallower depths can be explained by the change in the density of the mixture itself. Nevertheless, the total dose deposited was reduced by 3.2% for 1% 127I addition and by 14.5% for 5% 127I addition. It is worth pointing out that the dose change was more pronounced for the charged alpha particles or electrons than neutrons and gamma rays (Table 2).
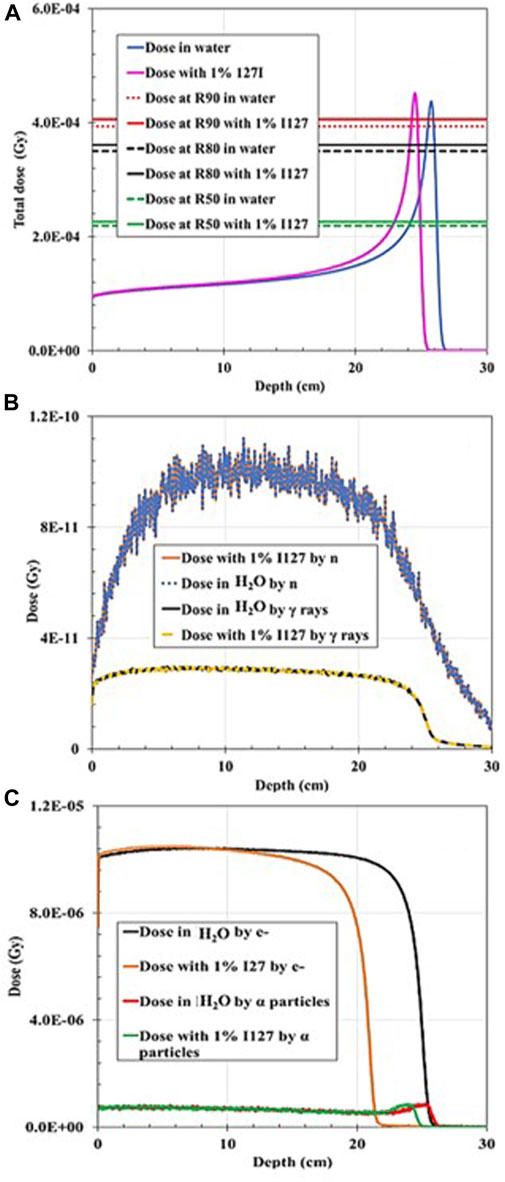
FIGURE 6. Dose distribution as a function of depth for 200 MeV proton irradiation: (A) Total dose distribution in water-filled geometry compared to the total dose distribution when 1% 127I was added to the mixture. (B) Dose distribution deposited by gamma rays (γ) in water-filled geometry compared to the dose distribution deposited by neutrons (n) when 1% 127I was added to the mixture. (C) Dose distribution deposited by electrons (e−) in water-filled geometry compared to the dose distribution deposited by alpha particles when 1% 127I was added to the mixture.
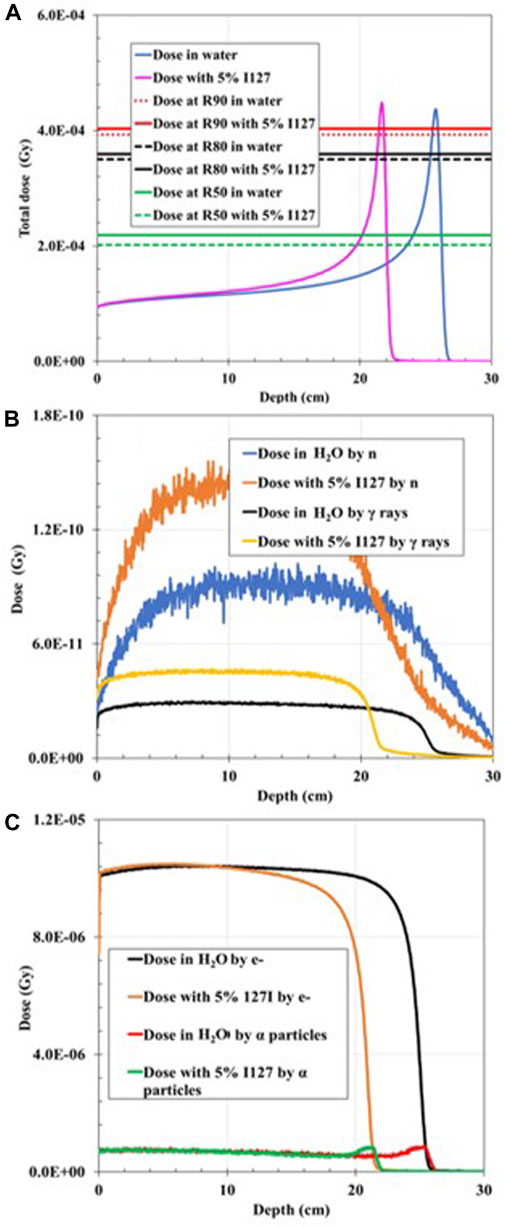
FIGURE 7. Dose distribution as a function of depth for 200 MeV proton irradiation; (A) total dose distribution in water-filled geometry compared to the total dose distribution when 5% 127I was added to the mixture. (B) Dose distribution deposited by gamma rays (γ) in water-filled geometry compared to the dose distribution deposited by neutrons (n) when 5% 127I is added to the mixture. (C) Dose distribution deposited by electrons (e−) in water-filled geometry compared to the dose distribution deposited by alpha particles when 5% 127I was added to the mixture.
The PG decline exhibits a close trend with the BP decrease. The right graph shown in Figure 8 shows that the P1 PG rays follow an emission distribution like the proton Bragg curve, and the sharp decrease of PG distribution corresponds to the R50a proton range. This finding is in good agreement with experimental and simulation results from other research groups [5, 18]. The P2 PG rays (Figure 8 left graph) show an approximately constant emission in the BP build-up region, following a sharp decrease in their emission after R80b up to R50b. However, the P2 PG yield is lower than that of P1. It should be noticed that 106 histories were simulated rather than 107 for studying the longitudinal distribution because we only wanted to study if there is a change in PG–BP correlation, given the PG enhancement found in [13].
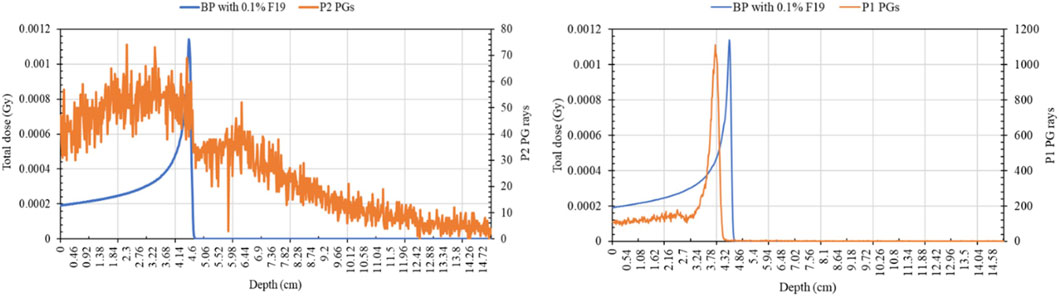
FIGURE 8. P1 and P2 PG production curves compared with the Bragg peak curve of a 75-MeV incident proton beam.
4 Discussion
This dosimetric analysis shows that the minimum wt% addition in a hypothetical tumor area of the non-radioactive elements and for the incident proton energy combinations, previously proposed by [13] as P1 and/or P2 PG production enhancers, does not have a crucial effect on the total dose deposition. Nevertheless, the results are heavily dependent on incident proton energy and mixture composition. The BP width was reduced in all cases, and the BP R90 shifted toward a shallower depth due to the increased density of material transversed, as resulted with the addition of a stable element. One could expect that the BP beam width increases due to range straggling, but the addition of the stable elements counteracts this increase. In summary, the BP width decrease varied with proton energy and mixture composition by 6%–31%. Additionally, in all cases, FWHM decreased by 0%–18%. It seems that the addition of the non-radioactive element in the hypothetical tumor area plays a role of a “pre-absorber” that reduces the spot widening effect caused by multiple coulomb scattering and nuclear interactions. Indeed, a smaller FWHM is of interest since it leads to sharper penumbra and to a more tailored dose distribution. It was also noted that when the proton energy was increased to 200 MeV, the dose characteristics altered significantly, especially when 5% wt of 127I was added to the mixture. The dose curve shifted to the left by ∼2 and ∼4 cm for the addition of 1% and 5% 127I, respectively. This can be attributed to the high electron density of 127I (4.93 g/cm3) that causes a significant change in the density of the medium transversed, resulting in a range shift toward shallower depths but not an altered BP shape. Overall making the medium higher in density slows down and stops the beam faster. Therefore, 127I might not be a good candidate for PG enhancement.
Finally, it was found that the wt% addition of the stable elements tested does not affect the spatial PG production relative to BP. The P1 rays are still emitted at the R50a point, as reported in the literature, while the P2 rays present a clearer and sharper decrease after R80b. It is worth mentioning that our goal was to check the dosimetric effects of injecting the non-radioactive elements previously proposed that enhance the P1 and/or P2 statistics in the smallest possible % wt addition. Since the injection of stable elements in the simulation geometry changes the material’s density, the cross-section probabilities of proton with matter also change, so studying these changes from a dosimetric point of view is important. Proton interactions with matter are not straightforward, given the multiple coulomb scattering and complicated nuclear interactions. Additionally, disagreements [18] of nuclear cross-section findings among various MC models and existing experimental data pose a limitation to this study. Therefore, experimental verification of the dose results and comparisons with and without the addition of stable elements is necessary using homogenous and inhomogeneous phantoms.
Indeed, the next step would be to translate this research into real clinical settings. First, the idea to increase P1 and P2 production and, consequently, increase their PG detection by the addition of the non-radioactive elements should be experimentally verified. The selection of the detector system needed to detect efficiently, and with a high energy resolution, the P1 and P2 rays emitted are crucial. A high-purity germanium (HPGe) clover detector that consists of four coaxial N-type high-purity germanium crystals, each mounted in the same cryostat, has been successfully used by Polf. et al. [19] to measure the PG spectrum emitted after irradiation of their experimental setup with a 48-MeV proton beam and discriminate the P2 peak that was correlated with the tumor oxygen metabolic changes [11, 19]. The detection of the low-intensity PG rays using HPGe detectors is not straightforward due to the presence of Compton scattered gamma rays. At energies above a few hundred keV, Compton interaction is the main interaction in the HPGe crystal due to its low atomic number, and thus, the Compton scattered gamma rays contribute to a continuous gamma-ray background that consequently raises the detection limit for the low-energy gamma rays. Nevertheless, anti-Compton shields (ACS) could be used to suppress unwanted background radiation [10, 20]. Then, the experimental verification of the dose deposition for the proposed mixture and energy combinations is needed. Gafchromic EBT2 films could be used to determine the BP width and range of the incident proton beam, and dose measurements at various BP depths could be determined using optically stimulated luminescence dosimeters.
5 Conclusion
This study highlights the potential of the proposed technique for PG enhancement, given that the absorbed dose and BP shape do not drastically change with the insertion of the stable enhancers, except 127I, and that every percentage change is dependent on the mixture composition and incident proton energy. Furthermore, the spatial PG emission is not affected by the addition of the enhancer candidates. The proposed technique has been inspired by the PET imaging procedures, where a carrier, for instance, FDG, assists in accumulating the radioactive 18F only in the tumor volume. Therefore, apart from an experimental study that verifies the suggested PG enhancement, the technique must be tested for its reproducibility during the treatment. Moreover, inserting non-radioactive elements only in a tumor volume will change the elemental composition of the relevant voxels and, subsequently, the CT numbers. Thus, the dosimetric changes should be further evaluated in a treatment planning scenario that could be possible through MC simulations.
Data availability statement
The raw data supporting the conclusion of this article will be made available by the authors, without undue reservation.
Author contributions
PG: Conceptualization, Data curation, Formal Analysis, Investigation, Methodology, Writing–original draft, Writing–review and editing. TL: Formal Analysis, Validation, Writing–review and editing. WM: Conceptualization, Data curation, Formal Analysis, Funding acquisition, Methodology, Project administration, Resources, Supervision, Validation, Visualization, Writing–original draft, Writing–review and editing.
Funding
The author(s) declare financial support was received for the research, authorship, and/or publication of this article. Research reported in this publication was supported by the Proton International under Award Number C-23-262. The content is solely the responsibility of the authors and does not necessarily represent the official views of the Proton International.
Conflict of interest
The authors declare that the research was conducted in the absence of any commercial or financial relationships that could be construed as a potential conflict of interest.
Publisher’s note
All claims expressed in this article are solely those of the authors and do not necessarily represent those of their affiliated organizations, or those of the publisher, the editors, and the reviewers. Any product that may be evaluated in this article, or claim that may be made by its manufacturer, is not guaranteed or endorsed by the publisher.
References
1. PTCOG. PTCOG (particle therapy Co-operative group) (2023). Available at: https://www.ptcog.ch/index.php/facilities-in-operation.
2. Parodi K, Polf JC. In vivo range verification in particle therapy. Med Phys (2018) 45(11):e1036–50. doi:10.1002/mp.12960
3. Moyers MF. Physical uncertainties in the planning and delivery of light ion beam treatments: The report of AAPM task group 202. Report No. 202 (2020).
4. Krimmer J, Dauvergne D, Létang JMTesta. Prompt-gamma monitoring in hadrontherapy: A review. Nucl Instr Methods Phys. Res. Sect. A Accel. Spectrometers, Detect. Assoc. Equip. (2018) 878(2017):58–73. doi:10.1016/j.nima.2017.07.063
5. Roellinghoff F, Benilov A, Dauvergne D, Dedes G, Freud N, Janssens G, et al. Real-time proton beam range monitoring by means of prompt-gamma detection with a collimated camera. Phys Med Biol (2014) 59(5):1327–38. doi:10.1088/0031-9155/59/5/1327
6. Aldawood S, Thirolf P, Miani A, Böhmer M, Dedes G, Gernhäuser R, et al. Development of a Compton camera for prompt-gamma medical imaging. Radiat Phys Chem (2017) 140:190–7. doi:10.1016/j.radphyschem.2017.01.024
7. Verburg JM, Seco J. Proton range verification through prompt gamma-ray spectroscopy. Phys Med Biol (2014) 59(23):7089–106. doi:10.1088/0031-9155/59/23/7089
8. Min CH, Kim CH, Youn MY, Kim JW. Prompt gamma measurements for locating the dose falloff region in the proton therapy. Appl Phys Lett (2006) 89(18):9–12. doi:10.1063/1.2378561
9. Stichelbaut F, Jongen Y. Verification of the proton beams position in the patient by the detection of prompt gamma-rays emission. In: 39th Meeting of the Particle Therapy Co-Operative Group; October 26 – 29 2003; San Francisco, California, USA (2003).
10. Hueso-González F, Rabe M, Ruggieri TA, Bortfeld T, Verburg JM. A full-scale clinical prototype for proton range verification using prompt gamma-ray spectroscopy. Phys Med Biol (2018) 63(18):185019. doi:10.1088/1361-6560/aad513
11. Polf JC, Peterson S, Ciangaru G, Gillin M, Beddar S. Prompt gamma-ray emission from biological tissues during proton irradiation: A preliminary study. Phys Med Biol (2009) 54(3):731–43. doi:10.1088/0031-9155/54/3/017
12. Magalhaes Martins P, Dal Bello R, Ackermann B, Brons S, Hermann G, Kihm T, et al. PIBS: Proton and ion beam spectroscopy for in vivo measurements of oxygen, carbon, and calcium concentrations in the human body. Sci Rep (2020) 10(1):7007–14. doi:10.1038/s41598-020-63215-0
13. Galanakou P, Leventouri T, Muhammad W. Non-radioactive elements for prompt gamma enhancement in proton therapy. Radiat Phys Chem (2022) 196:110132. doi:10.1016/j.radphyschem.2022.110132
14. Perl J, Shin J, Schümann J, Faddegon B, Paganetti H. Topas: An innovative proton Monte Carlo platform for research and clinical applications. Med Phys (2012) 39(11):6818–37. doi:10.1118/1.4758060
15. Schuemann J, Dowdell S, Grassberger C, Min CH, Paganetti H. Site-specific range uncertainties caused by dose calculation algorithms for proton therapy. Phys Med Biol (2014) 59(15):4007–31. doi:10.1088/0031-9155/59/15/4007
16. Berger MJ, Coursey JS, Zucker MA, Chang J. ESTAR, PSTAR, and ASTAR: Computer programs for calculating stopping-power and range Tables for electrons, protons, and helium ions (version 1.2.3) (2005). Available at: http://physics.nist.go.
17. Newhauser WD, Zhang R. The physics of proton therapy. Phys Med Biol (2015) 60(8):R155–R209. doi:10.1088/0031-9155/60/8/r155
18. Verburg JM, Shih HA, Seco J. Simulation of prompt gamma-ray emission during proton radiotherapy. Phys Med Biol (2012) 57(17):5459–72. doi:10.1088/0031-9155/57/17/5459
19. Polf JC, Panthi R, Mackin DS, McCleskey M, Saastamoinen A, Roeder BT, et al. Measurement of characteristic prompt gamma rays emitted from oxygen and carbon in tissue-equivalent samples during proton beam irradiation. Phys Med Biol (2013) 58(17):5821–31. doi:10.1088/0031-9155/58/17/5821
Keywords: proton therapy, proton range, stable elements, prompt gammas, PG enhancement
Citation: Galanakou P, Leventouri T and Muhammad W (2023) Dosimetric effects of inserted non-radioactive elements in a tumor area in proton therapy. Front. Phys. 11:1261084. doi: 10.3389/fphy.2023.1261084
Received: 18 July 2023; Accepted: 26 September 2023;
Published: 12 October 2023.
Edited by:
Kaiwen Li, CAS Ion Medical Technology Co., Ltd., ChinaReviewed by:
Dimitris Emfietzoglou, University of Ioannina, GreeceChunhui Gong, Nanjing University of Science and Technology, China
Copyright © 2023 Galanakou, Leventouri and Muhammad. This is an open-access article distributed under the terms of the Creative Commons Attribution License (CC BY). The use, distribution or reproduction in other forums is permitted, provided the original author(s) and the copyright owner(s) are credited and that the original publication in this journal is cited, in accordance with accepted academic practice. No use, distribution or reproduction is permitted which does not comply with these terms.
*Correspondence: Wazir Muhammad, d2F6aXJtQGhvdG1haWwuY29t