 Lu Lu
Lu Lu Ying Qian2
 Qiang Zeng
 He Li
He Li
95% of researchers rate our articles as excellent or good
Learn more about the work of our research integrity team to safeguard the quality of each article we publish.
Find out more
ORIGINAL RESEARCH article
Front. Phys. , 17 October 2023
Sec. Soft Matter Physics
Volume 11 - 2023 | https://doi.org/10.3389/fphy.2023.1259273
This article is part of the Research Topic Multiscale Modeling and Artificial Intelligence in Soft Matter Biophysics View all 6 articles
Human exposure to Phthalates, a family of chemicals primarily used to enhance the flexibility and durability of plastics, could lead to a decline in semen quality. Extensive studies have been performed to investigate the associations between semen quality and exposure to environmental pollutants, such as phthalates. However, these early studies mainly focus on using conventional statistical methods, such as simple and efficient multi-variable linear regression methods, to perform the analysis, which may not be effective in analyzing these complex multi-variable associations. Herein, we perform a systematic study of the performance of different machine learning methods in analyzing these associations. We will use data from a cohort of 1070 Chinese males from Hubei province who provided repeated urine samples to measure phthalate metabolites. In addition, phthalate metabolites in semen are also evaluated as a biomarker to give a more direct metric. We also incorporate patient demographics and administered medications into the analysis. Overall, six machine learning models, including linear and non-linear models, are implemented to analyze associations among thirty-one features and five metrics of the quality of the semen. The performance of the models is evaluated based on root-mean-square deviation through 10-fold cross-validation. Our investigations show that the performance of different models is varied when employed to study different metrics that represent the quality of the semen. Therefore, a systematic study of the patients’ data with various machine learning models is essential in improving the quantitative analysis in discovering the critical environmental pollutants that dictate the quality of semen. We hope this study could provide guidance of employing machine learning models in the future investigation of the impact of various pollutants on semen quality.
In recent decades, heavy pollution in China has become a severe problem due to rapid industrialization and urbanization. Exposure to different environmental pollutants, such as pesticides, bisphenol A, and heavy metals that disrupt the human endocrine system, could lead to a decline in human semen quality [1, 2]. Phthalates, one type of endocrine disruptors, are broadly used as additives in many consumer products such as toys, vinyl flooring and wall covering, detergents, food packaging, pharmaceuticals, and personal care products [3, 4]. Since phthalates do not chemically bind to these products, they can be quickly released into the environment or dissolved upon contact with liquids or fats [5, 6]. Once absorbed into the human body, phthalates are converted quickly to their respective metabolites, which have been detected in human urine, blood, semen, feces, and meconium [7-11]. Another group of endocrine disruptors are polycyclic aromatic hydrocarbons (PAHs), which primarily are originated from incomplete combustion or pyrolysis of garbage, oil, wood, coal, or other organic substances (e.g., grilled meat and tobacco). PAHs not only are considered as mutagens and carcinogens but also cause a detrimental effect on male reproductive health in humans [12-14].
Extensive studies have been performed to investigate the associations between the male reproductive functions and exposure to environmental pollutants, such as phthalates [15-21] and PAHs [22, 12-14]. However, inconsistent findings were reported from these work. An early investigation by [19] showed inconclusive results regarding whether phthalate exposure may reflect a hazard for human male reproduction. Subsequent studies presented compelling evidence demonstrating that the correlation could exist. For example, Duty et al. [15] illustrated the association between monomethyl phthalate with sperm morphology, but similar relations cannot be detected for other phthalates. Han et al. [17] showed that the environmental level of PAH exposure is associated with increased sperm DNA damage but not with semen quality. The preliminary results presented by Liu et al. [20] suggested that phthalate exposure to MBP, MEP, and MMP may play a role in reproductive-age human semen quality. The discrepancy from the literature probably results from the variations in levels of individual exposure and limited sample sizes. In addition, the relatively short half-life of phthalates (in the order of hours) in urinary samples also contributes to substantial variability of metabolite concentrations in single urine samples [23, 24].
In recent large-scale studies involving 1070 Chinese males [25-27], repeated measurements of urinary phthalate metabolites for each subject were performed to reduce the effect of the variation in phthalates in urinary samples. In addition, phthalate metabolites in semen were also evaluated as a biomarker to provide a more direct metric for pollutant exposure. In these studies [25-27], eight phthalate metabolites were measured, including monomethyl phthalate (MMP), monoethyl phthalate (MEP), mono-n-butyl phthalate (MBP), mono-n-octyl phthalate (MOP), monobenzyl phthalate (MBzP), MEHP, mono-(2-ethyl-5-hydroxyhexyl) phthalate (MEHHP), and mono-(2-ethyl-5- oxohexyl) phthalate (MEOHP), and the analysis of the measurements showed that the MBP concentration was strongly associated with the decrease in sperm concentration and total sperm count. In subsequent studies, the associations of the phthalate metabolites with sperm apoptosis and DNA damage [26], as well as the association between thyroid mediators and impaired semen quality due to exposure to phthalates was also investigated [27]. On the other side, a large-scale study of the relation between exposure to PAHs and decreased semen quality is conducted with 933 participants [28] and this study showed that multiple urinary OH-PAH metabolites are associated with various semen parameters. It is noted that the measured data in these studies were analyzed using simple and efficient multivariable linear regression methods, which limited the capability of describing the correlation between the exposure to the pollutants and the quality of semen.
In this study, we train six machine learning models using the clinical data recorded from a large-scale study involving 1070 Chinese males, including patient demographics, urinary phthalate metabolites, urinary OH-PAH metabolites, and serum thyroid hormones. The outputs of the models are the quality of the human semen, which is described by five quantities, including progressive motility, total motility, semen volume, concentration, and sperm count. In particular, we implement multiple non-linear regression methods, namely support vector regression (SVR), random forest, AdaBoost, Gradient Boosting, XG boost, and feed-forward neural network to describe the association between these pollutant metabolites and the qualities of the sperm. The hyperparameters involved in the employed predictive models are optimized using Bayesian optimization. The performance of different methods is compared based on Root Mean Square Error (RMSE) through 10-fold cross-validation. Furthermore, we evaluate the significance of the phthalate metabolites, OH-PAH metabolites, and thyroid mediators and explore which metabolites or mediators have the strongest association with the quality of the semen.
We use the dataset reported in the prior studies [25-27], which contains semen evaluations from 1070 men collected by the Reproductive Center of Tongji Hospital, Wuhan, China. Each entry is composed of 31 features (input valuables of the predictive models), including ten demographic information, namely age, BMI, cigarettes per day, fathered, race, abstinence duration, education, smoking, alcohol, and income; concentration of 8 urinary phthalate metabolites, namely MMP, MEP, MBP, MOP, MBzP, MEHP, MEHHP, and MEOHP; concentration of 3 serum thyroid hormones, namely thyroid-stimulating hormone (TSH), free total triiodothyronine (FT3) and free thyroxine (FT4); concentration of 10 polycyclic aromatic hydrocarbon (PAH) metabolites, including 1OHnap, 2OHnap, 9OHflu, 2OHflu, 4OHphe, 9OHphe, 3OHphe, 1OHphe, 2OHphe, and 1OHpyr. 5 labels (output valuables the predictive models), including progressive motility, total motility, semen volume, concentration, and sperm count, are used as the metrics of semen quality, and they are considered as our target labels for model prediction. Detailed information on measurements of these quantities can be found in our previous work [25-27]. We have two measurements of urinary phthalate metabolites in each participant, and we use the average of these two measurements to improve the reliability of phthalate measurements. The metabolite concentrations in the two samples are creatinine-normalized to account for urine dilution and ln-transformed before being averaged. It is noted that All phthalate metabolites are detected in humans’ urine, blood, semen, feces, and meconium in ng/mL. The urinary phthalate metabolites generally have the highest detectable concentrations, ranging from <limitation of detection (LOD) to > 5000 ng/mL based on the detected specific metabolites. Thus, urinary phthalate metabolites are the most common biomarkers used for assessing human exposure. We also collected the Demographic data of the study population and they are summarized in Table 1.
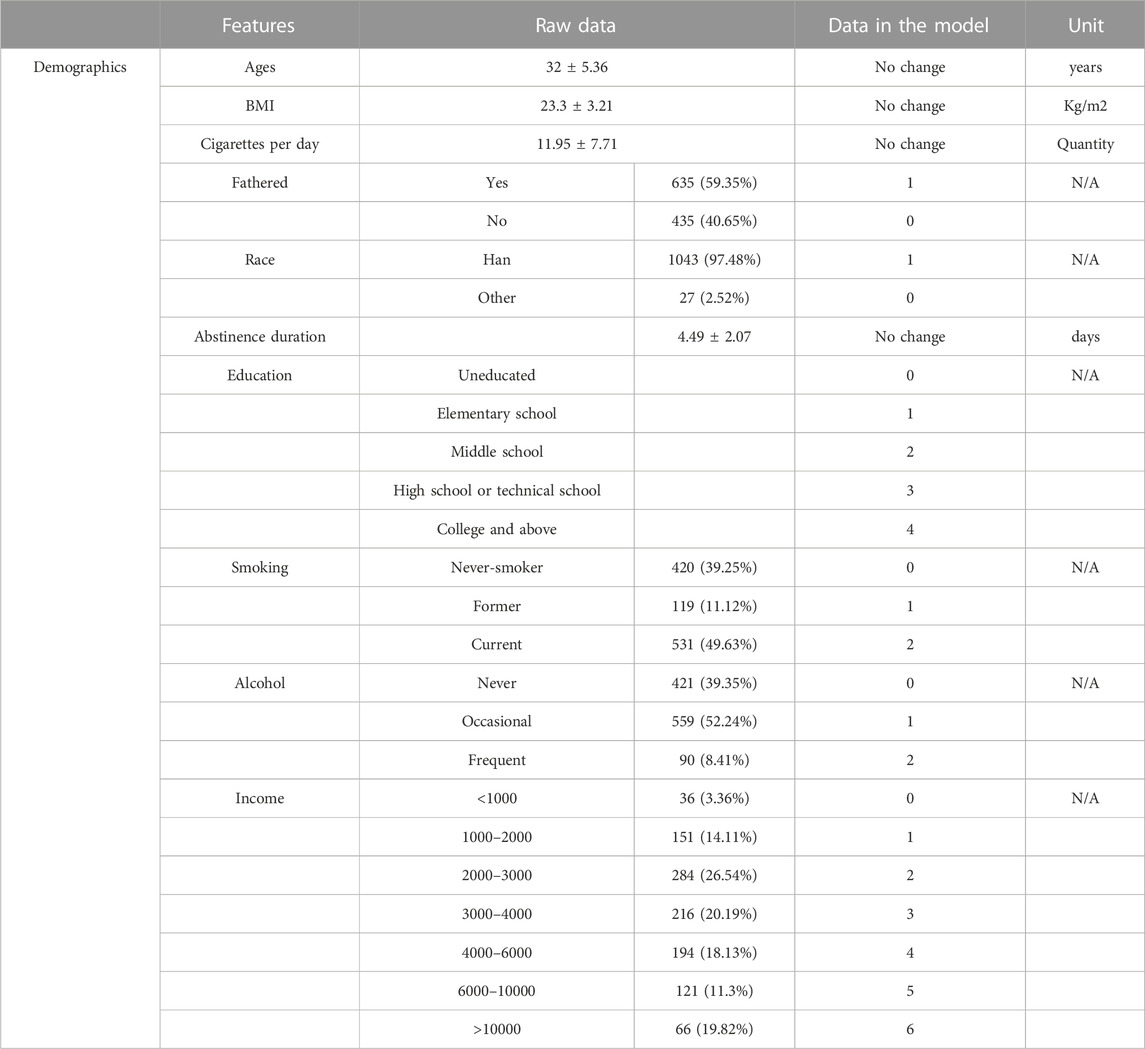
TABLE 1. Demographic characteristics [mean ± SD or n (%)] of the study population.
In the original data set, we identify missing values, unreasonable values (value is below the limit of detection, LOD), and 0 (assigned by the equipment when the corresponding concentration is below LOD) for some patients’ measurements. These data could disrupt our analysis. Thus, we first clean the original dataset through the following steps: (1) All 0s are replaced with the values of LOD divided by the square root of 2; (2) unreasonable values and missing values are replaced by the average values.
We conduct distribution fitting for all the features to transform data into symmetric distributions. This transformation is desirable when regression and prediction are performed. We observe the positive skewness in the distributions of many examined features, which fit well with the lognormal distribution. Thus, we transform all the features logarithmically such that they follow normal distributions, as shown in Figure 1. In addition, we also investigate the potential correlation among the eight examined phthalate metabolites, and our results in Figure 2 show no notable association among these features.
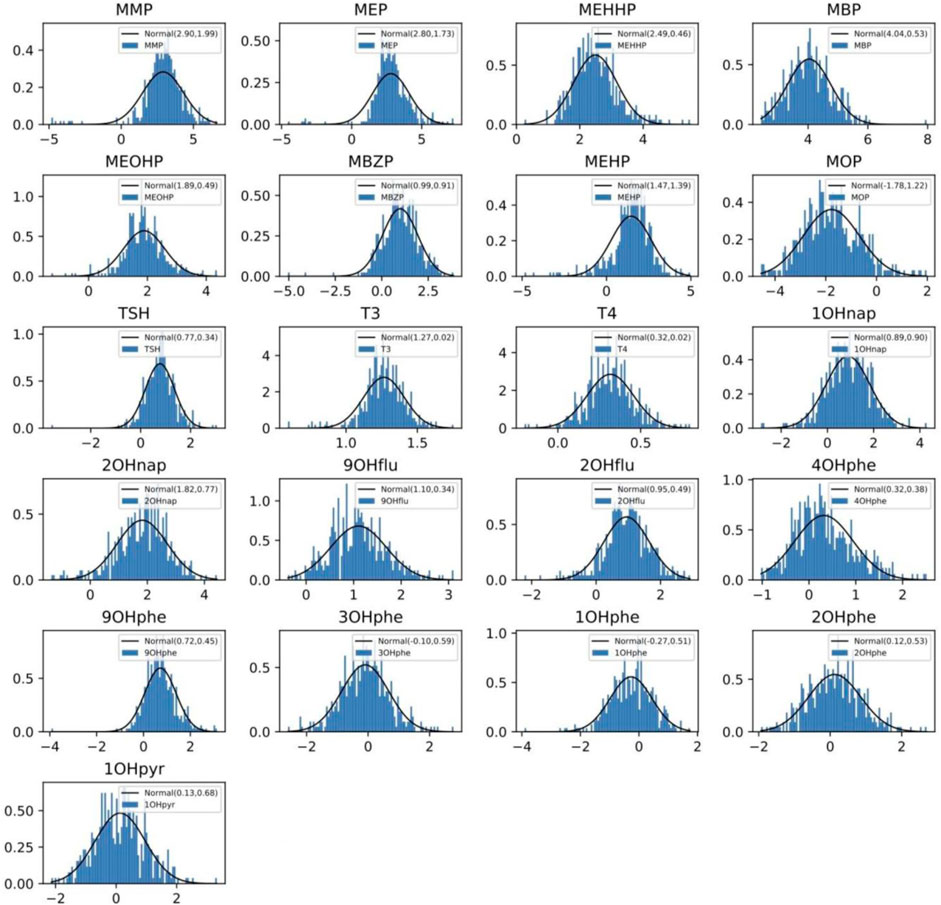
FIGURE 1. Distribution of some examined features, including eight urinary phthalate metabolites, namely MMP, MEP, MBP, MOP, MBzP, MEHP, MEHHP, and MEOHP; 3 serum thyroid hormones, namely thyroid-stimulating hormone (TSH), free total triiodothyronine (FT3) and free thyroxine (FT4); 10 polycyclic aromatic hydrocarbon (PAH) metabolites, including 1OHnap, 2OHnap, 9OHflu, 2OHflu, 4OHphe, 9OHphe, 3OHphe, 1OHphe, 2OHphe, and 1OHpyr, after data transformation.
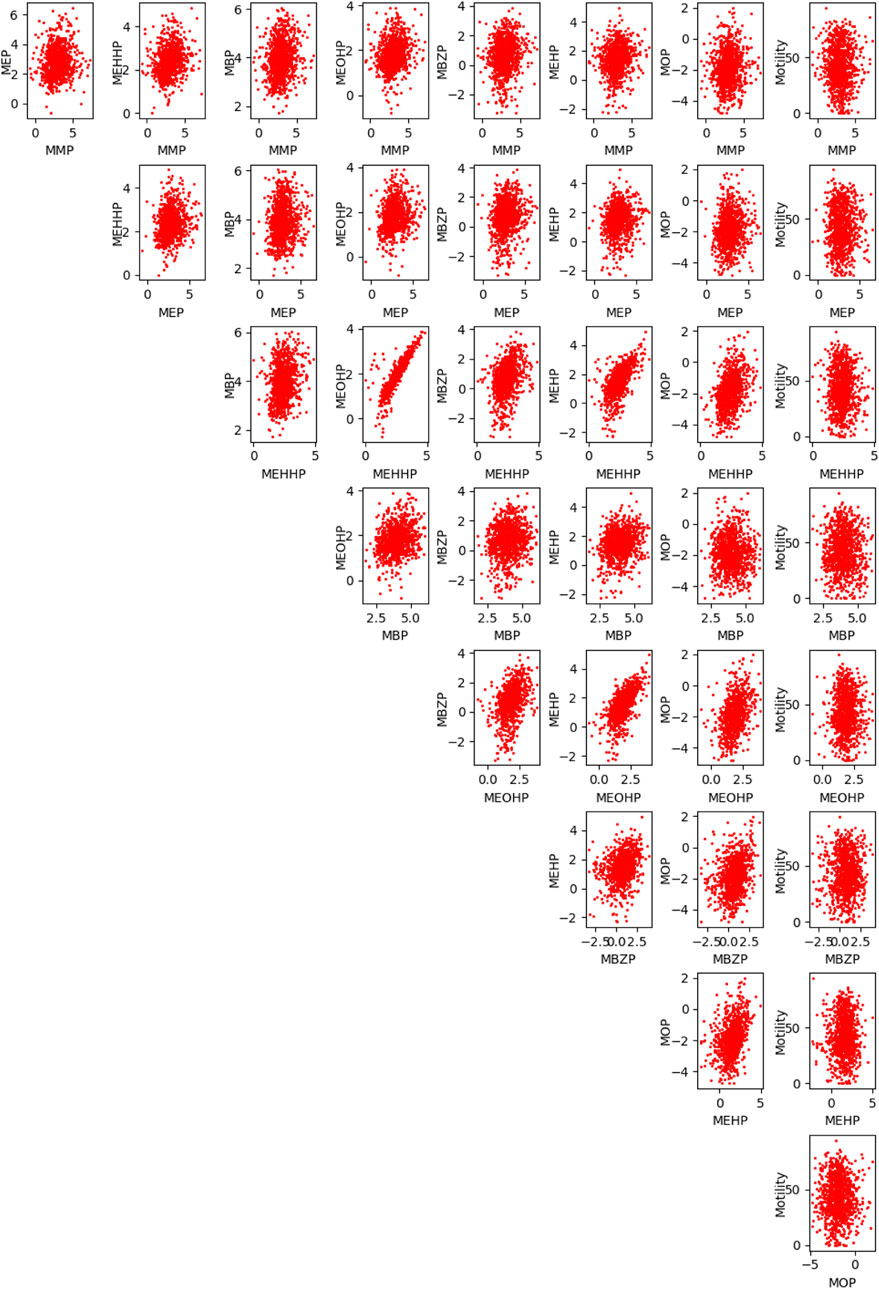
FIGURE 2. Investigation of the correlation among the eight examined phthalate metabolites, namely MMP, MEP, MBP, MOP, MBzP, MEHP, MEHHP, and MEOHP.
To explore the correlation between the pollutant metabolites and the quality of the semen, we perform analysis following three steps, namely feature selection, machine learning algorithm, and k-fold cross-validation. First, we select m top features according to the mutual information using functions from sklearn, where the features are selected based on the level of mutual dependence between the features and the target label. In the present study, m is chosen to be 1, 5, 20, and 31 (all the features), respectively. Next, we analyze the dataset by implementing multiple non-linear regression methods, respectively, including SVR, random forest, AdaBoost, gradient boosting, and feed-forward neural network. For the baseline performance, we directly use the average value of all the labels. Then, we estimate the performance of each algorithm using k-fold cross-validation with k = 10.
In addition, we study the significance of the features in the dataset to the five labels based on the gain from XGBoost, which can be used to explore the key features that are strongly associated with semen quality.
We first perform simple multi-variable linear regression to the data by using the features selected from sklearn feature selection.
Random Forest is another popular and widely utilized supervised machine learning algorithm for classification and regression problems [29, 30]. Implementation of random forest involves building decision trees using different samples, and the model predictions are determined by leveraging an ensemble of multiple decision trees. In particular, the random forest can handle the data set containing continuous variables for solving regression problems. Specifically, the majority vote of the trees will be used for classification problems, whereas the average of all the votes is computed for regression problems. This unique structure allows the model to analyze complex datasets and prevent overfitting. Based on these model features, we implement a Random Forest regressor to fit a number of classifying decision trees on various sub-samples of the dataset, as our features include both numerical and a few categorical features.
SVM, one of the most broadly used supervised learning algorithms [31], can search a decision boundary that can divide n-dimensional space into various classes so that unseen data points can be categorized into the correct class. Although SVM has been primarily used for classification problems in Machine Learning, it also can solve regression problems. In this work, we will analyze the dataset using SVR, a regression version of SVM [32]; [31]. SVR applies the same algorithm as the SVM, but a margin of tolerance ϵ is set in approximation to targets. During SVR, a function of the features that leads to the most ϵ deviation from the targets for all the training data will be identified, while errors less than ϵ will not be considered. We will implement non-linear SVR with radial basis function kernel to improve the prediction accuracy.
Next, we implement boosting techniques [33], a method widely used in machine learning to reduce errors in model predictions. A single machine learning model may not provide accurate predictions if the training dataset is not sufficient, leading to the generation of a weak learner. The application of Boosting can overcome this issue by converting multiple weak learners into a single strong learning model. We test three boosting techniques, including Gradient Boosting, AdaBoost, and XGBoost. Gradient Boosting [34] is the boosting technique developed based on the principle of the stage-wise addition method. Specifically, multiple weak learners are trained, but the strong learner algorithm is used as a final model by adding multiple weak learners trained on the same dataset. For example, the first weak learner will simply return the mean of the particular column without being trained on the dataset. The residual for output of the first weak learner will be calculated and used as output or target column for the next weak learner. AdaBoost [35] also functions based on the principle of the stage-wise addition method, but a weight factor that is associated with the errors of each weak learner will be computed such that the weak learners with better performance will be less-weighted than the weaker learners with greater errors. XGBoost [36] is another extended version of Gradient Boosting by implementing a regularization technique, improving the prediction accuracy and model efficiency from the vanilla gradient boosting algorithm. We use decision trees as base estimators for these three examined boosting techniques.
With the advance of computational power in recent years, artificial neural networks (ANNs) have emerged as the most popular machine learning models as their unique capability in handling big data. ANNs have been used for a wide variety of tasks, i.e., image segmentation and classification [37, 38], face recognition [39]; [40], self-driving cars [41]; [42], large languages models [43]; [44]. In addition to these social and engineering applications, ANNs have been employed to solve regression problems in scientific computing [45]. Since our dataset has no particular structure, we choose the multilayer perceptron (MLP), a fully connected class of feedforward ANN, to analyze the dataset instead of more complicated networks such as convolutional neural networks or recurrent neural networks. We use the MLP regressor in the sklearn.neural_network package with tanh selected as the activation function for the hidden layers. Adam optimizer is used to train the MLP, and the learning rate is 0.0001.
We will perform mutual information regression [46]; [47], which is broadly used as relevant criteria for selecting feature subsets from input datasets with a nonlinear relationship to the predicted attributes, to assess the dependence of the metrics that are associated with the quality of the semen on the studied features. A higher value obtained from mutual information indicates a higher dependency of the target metric on the examined feature. To cross-validate the findings from mutual information regression, we will also use the gain computed from XGBoost [48]; [36] to assess the variable dependence. The gain in XGBoost implies the relative contribution of the examined feature to the metrics of semen quality by taking each feature’s contribution for each tree in the model. A higher value of gain suggests this feature plays a more significant role when making predictions.
We use Bayesian optimization to automatically tune all the hyperparameters involved in the abovementioned regression methods. Bayesian optimization is a powerful optimization technique that utilizes Bayesian inference and statistical models to search for the optimal solution of a black-box function [49]; [50]. It has been extensively employed in various engineering applications to accelerate the search speed of hyperparameters by leveraging existing performance data [51]; [52]; [53]. In this work, we will employ Bayesian optimization to search for the optimal combination of hyperparameters that minimizes RMSE. We consider RMSE as a target function. In each algorithm iteration, Bayesian optimization incorporates a new set of observations (composed of a combination of hyperparameters and their corresponding error) and adjusts its prediction for the target function. Using the Gaussian process as a surrogate, we construct a function to approximate the target function and estimate uncertainties. By defining a utility function that maps hyperparameters to a utility score that links to both the error value and the variance, Bayesian optimization can search for an optimal combination of hyperparameters that provides the highest utility. We will set a range for each hyperparameter to be tuned and use this optimization method to search a variety of hyperparameters within these ranges to improve the search efficiency. For example, when performing regression using MLP, we need to optimize four hyperparameters, including depth, width, regularization strength, and optimization tolerance. Figure 3 shows that the decay of RMSE of the progressive mobility stops before the 500 iterations we set for the optimization.
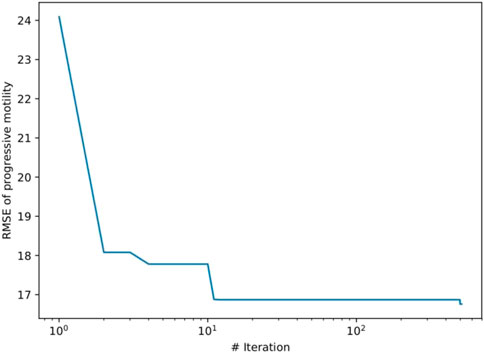
FIGURE 3. Change of RMSE of the progressive motility with respect to the training iteration with the application of Bayesian optimization.
In the current study, we use RMSE, which describes the deviation of model prediction from the true labels, to measure the performance of the models. Figure 4 summarizes the performances of the six examined models. For each model, we test five groups of features, including the top 1, 5, and 20 features from feature selection, as well as all the available features. For labels in progressive motility, total motility, volume, concentration, and count, we plot both the RMSE values of the models and their relative error compared to the baseline. It is noted that we only show the models that exceed the baseline performance for at least one label. The baseline performance from the mean predictor is also plotted for comparison. The mean predictor is shown on the left for the plot of the absolute value and shown as the grey baseline in the relative values graph. The Best results we can achieve for each label are boxed with black edges.
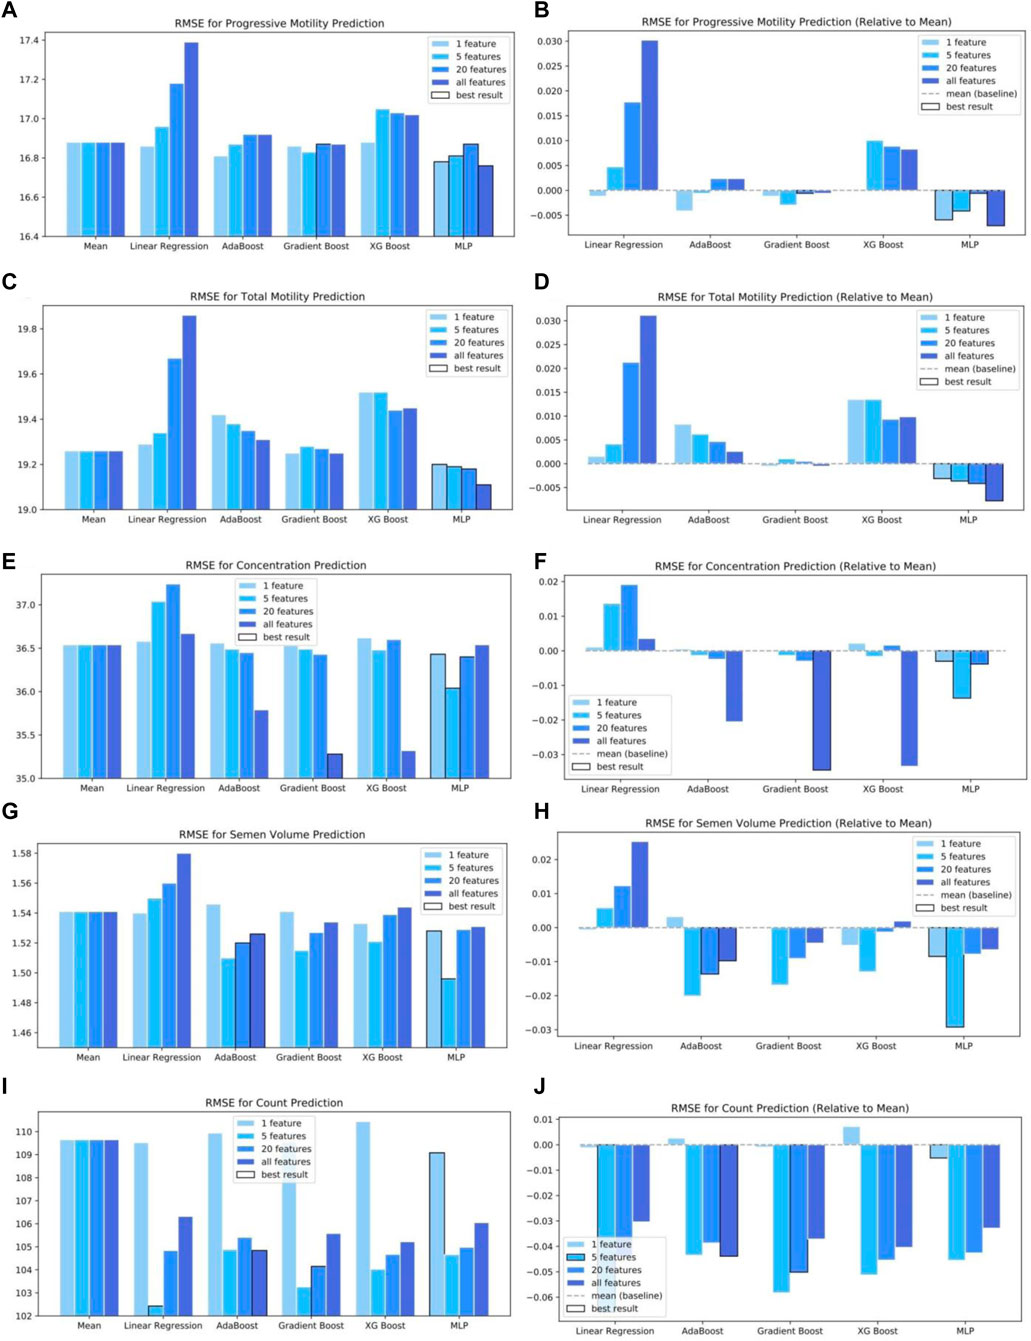
FIGURE 4. The performance of machine learning models in exploring the correlation of multiple features with different metrics associated with the quality of the semen, including RMSE for Progressive motility prediction (A) absolute and (B) relative to mean; RMSE for total motility prediction (C) absolute and (D) relative to mean; RMSE for concentration prediction (E) absolute and (F) relative to mean; RMSE for semen volume prediction (G) absolute and (H) relative to mean; RMSE for count prediction (I) absolute and (J) relative to mean.
We first employ linear regression to analyze the data, and our results in Figure 4 show that the R-squared is very low, meaning that linear regression can not accurately represent the relationship of the examined data, which is consistent with the finding from prior studies [25,54]. Then, we conduct regression with the cross terms to capture non-linear relationships while considering the top one, five, and twenty features selected from our feature selection and all features, respectively. The model results show that the R-squared is increased slightly. In particular, Figure 4 shows that when the top one feature is applied as a single input to perform the linear regression, better fitting is achieved for four labels (progressive motility, total motility, semen volume, concentration). But worse prediction is obtained for sperm count, compared to five, twenty, and all features. Overall, we find that linear regression provides fitting with an error greater than the baseline except for the case of sperm count with five or twenty features, suggesting that Linear Regression is not a suitable model for analyzing the association between the examined factors and the metrics of quality of the semen.
Next, we examine the performance of three machine learning models based on boosting techniques: AdaBoost, Gradient Boosting, and XGBoost. Figure 4 shows that with the implementation of the boosting techniques, the accuracy of the fitting is improved for the progressive motility, total motility, semen volume, and concentration as compared to the results of linear regression. In particular, AdaBoost provides better fitting for semen volume and count than the baseline. However, the fitting error for progressive mobility is still greater than the baseline for most of the tested four feature groups. As for the sperm concentration, a better fitting is achieved only when all the features are used as inputs. Regarding the total mobility fitting, AdaBoost provides worse results than the baseline. Like the AdaBoost method, the Gradient Boosting method provides a smaller error for semen volume and count than the baseline. But, the progressive and total mobility errors are only comparable to the baseline. When XGBoost is employed, a better fitting is observed for semen volume and count compared to the baseline; in contrast, the fitting errors for the progressive and total mobility are still larger than the baseline. These results suggest that due to the involvement of many features and the complex relation among these features, the performance of the machine learning models based on the boosting techniques is not consistent, implying that the selection of a suitable model based on the target metric could be essential for analyzing the dependency of the quality of the semen on environmental factors.
Due to the features mentioned above, we employ the ANNs to dissect the complex dependency of the quality of the semen on environmental factors. Developed based on the universal approximation property, which states that ANNs with sufficiently large width and depth can, in principle simulate any continuous function on a compact domain, neural networks have been widely used to approximate nonlinear functions with high-dimensional inputs and outputs [55]; [56]. As the examined dataset is not characterized by any particular data structure, we will examine the performance of MLP, a simple version of ANNs. The results in Figure 4 show that MLP provides improved results for the progressive and total mobility than those of AdaBoost, Gradient Boosting, and XGBoost methods while the fitting errors for the other three labels are comparable to the results from these three methods. These results demonstrate the advantage of deep neural networks over the conventional machine learning approaches in analyzing complex relations among high dimensional input and output variables.
We also implement SVR and Random Forest to analyze the data. However, we find that neither of these two methods could provide better results than the baseline for any of our targeted metrics for the quality of the semen. The underperformance of these two machine learning models could result from a complex link between the high dimensional input features and the resulting quality metric for the semen.
Next, we assess the significance of the phthalate metabolites, OH-PAH metabolites, and thyroid mediators to different metrics and explore the key metabolites or mediators that dictate the quality of the semen. Two approaches, namely, mutual information regression and the gain from XGBoost, are employed. The significance of each feature to the labels is listed in Figure 5. The figure on the left shows the sorted results from mutual info regression, while the figure on the right plots the gains contributed by different features. The gain is calculated by the corresponding feature’s contribution for each tree in the model. Therefore, a feature with a higher value of gain compared to other features indicates that this feature is relatively more important when generating a prediction. In general, these two approaches provide comparable results. The essential features identified by both methods include TSH, MEHHP, MOP, 10Hnap, 90Hflu, BMI, MEHP, MBZP, alcohol, 30Hphe, and 20Hflu. TSH, which is a kind of thyroid hormone. Regarding Demographics, BMI and alcohol play a more critical role than the other demographic features.
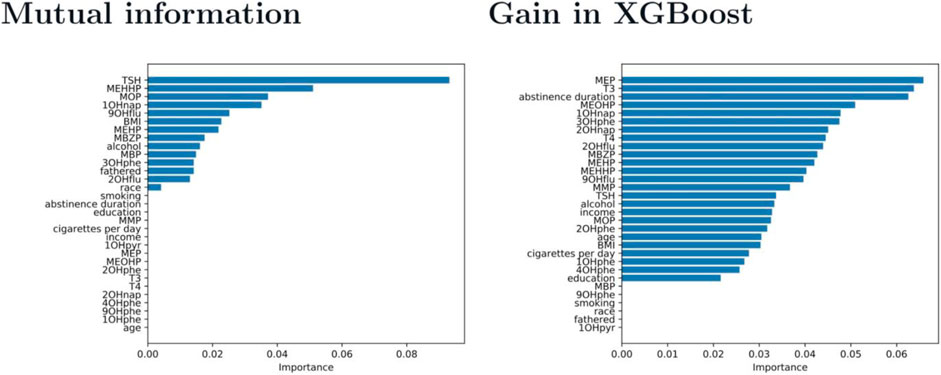
FIGURE 5. Evaluation of the significance of the phthalate metabolites, OH-PAH metabolites, and thyroid mediators to the quality of the semen using mutual information regression and the gain from XGBoost.
Reducing the content of key components of plastics that affect sperm activity could prevent their adverse impact on the human endocrine system and slow down the decline in human semen quality as human ages. As illustrated in Figure 4, no single model can provide the best fitting for all five examined labels. MLP has provided the best results for predicting progressive and total motility, while linear regression outperforms other more sophisticated models when predicting sperm count. This finding implies that the relation between features and progressive and total motility is prone to be nonlinear, whereas the association between features and sperm count is more likely to be linear. In addition, the number of features used to perform the regression also plays a role in the accuracy of the results. For example, the smallest error for progressive motility is achieved using all features, meaning that progressive motility is sensitive to all the features. However, the best fitting for sperm count is obtained by five features, meaning that count is only affected by the top several features. It is also noted that progressive and total motility are relatively harder to predict based on the available dataset compared to other features. For concentration, volume, and count, we can exceed baseline performance by 3%-6%. But for progressive motility and total motility, we can only exceed baseline by less than 1%. This may imply that the employed dataset cannot unravel the association of progressive motility and total motility with the examined features. In this case, a larger cohort or an increased number of features needs to be considered for future investigation. Specifically, we will obtain more information on each patient from our collaborators to improve our prediction accuracy. For example, we will try to obtain a dataset with more than 31 features, as they may not be sufficient to characterize an individual’s body health and body condition.
Several similar studies have been performed in different cities in China as well as in other countries. For example. Zhang et al. [57] investigated the association between phthalate exposure and human semen quality in Shanghai, and the authors discovered that there was a significant positive association between liquefied time of semen and phthalate concentrations of semen. In particular, people who reside in Shanghai are found to be more likely exposed to phthalates, especially to DBP and DEHP. However, a separate study of phthalate exposure and semen quality in the United States by Thurston et al. [58] showed no notable correlation between phthalate exposure in adulthood and classical semen quality parameters except an association between MBzP and decreased motility. The variation observed in the findings of different studies examining the connection between phthalate exposure and human semen quality can be attributed to several factors. These factors include differences in geographical locations, the size of the study cohorts, the professions of the participants, and the varying levels of phthalate product utilization. Each of these elements contributes to the complexity of understanding the relationship between phthalate exposure and semen quality.
It is noted that the goal of this work is to evaluate the performance of multiple conventional machine learning tools, i.e., SVM, random forest, AdaBoost, and deep neural networks. Conventional machine learning approaches are typically based on mathematical and statistical principles, and thus they confer good interpretability and explainability and perform well for many structured data problems. On the other hand, the rapid growth of deep learning technologies has been fueled by the emergence of big data and increased computational capabilities. Many advanced data-driven neural network structure, such as convolution neural networks [59]; [38]; [37], recurrent neural networks [60]; [61,62], Pointnets [63]; [64]; [65], Transformers [66]; [67]; [68], as well as physics-informed deep learning models [69]; [70]; [71], have been developed and employed to solve a broad range of engineering problems. Recently, Sun et al. [72] have successfully developed a prediction model of indoor phthalates concentration using a back propagation neural network. While utilizing these advanced deep-learning models could potentially improve our understanding of the relationship between phthalate exposure and human semen quality, conducting a comprehensive investigation in this direction would necessitate a separate study, which falls outside the scope of our current work.
In conclusion, we systematically study the performance of six machine learning models by analyzing the correlation among 31 features that are thought to impact human productivity and five metrics commonly used to evaluate the quality of semen. Our study demonstrates the complex associations between these features and the metric, and thus, no universal model can achieve optimal predictions on all the features and metrics. Therefore, a systematic study of the patients’ data with various machine learning models is essential in improving the quantitative analysis of the environmental factors and patients’ demographics and their impact on the quality of semen. We hope this study provides guidance for employing machine learning models in the future investigation of the association of exposure to various pollutants with semen quality.
The original contributions presented in the study are included in the article/Supplementary Material, further inquiries can be directed to the corresponding authors.
The studies involving humans were approved by the Ethics Committee of the Tongji Medical College. The studies were conducted in accordance with the local legislation and institutional requirements. The participants provided their written informed consent to participate in this study.
LL: Conceptualization, Data curation, Investigation, Software, Supervision, Writing–original draft, Writing–review and editing. YQ: Conceptualization, Data curation, Investigation, Writing–original draft, Writing–review and editing. QZ: Conceptualization, Data curation, Investigation, Writing–original draft, Writing–review and editing. YHD: Writing–original draft, Formal analysis, Investigation. HS: Writing–original draft, Formal analysis, Investigation. YXD: Writing–original draft, Formal analysis, Investigation. HL: Writing–original draft, Formal analysis, Supervision, Writing–review and editing.
The authors declare that no financial support was received for the research, authorship, and/or publication of this article.
We would like to thank Xiaoyu Jiang, her contribution to data cleaning and processing in the early stage of this study. This work is dedicated to the CRUNCH members Zhen Li, Xuhui Meng, Xiaoli Chen, and Yi Wang who are originally from Hubei province.
The authors declare that the research was conducted in the absence of any commercial or financial relationships that could be construed as a potential conflict of interest.
All claims expressed in this article are solely those of the authors and do not necessarily represent those of their affiliated organizations, or those of the publisher, the editors and the reviewers. Any product that may be evaluated in this article, or claim that may be made by its manufacturer, is not guaranteed or endorsed by the publisher.
1. Li D-K, Zhou Z, Miao M, He Y, Wang J, Ferber J, et al. Urine bisphenol-a (bpa) level in relation to semen quality. Fertil sterility (2011) 95:625–30.e4. doi:10.1016/j.fertnstert.2010.09.026
2. Balabanic D, Rupnik M, Klemencˇicˇ AK. Negative impact of endocrine-disrupting compounds on human reproductive health. Reprod Fertil Dev (2011) 23:403–16. doi:10.1071/rd09300
3. Rudel RA, Camann DE, Spengler JD, Korn LR, Brody JG. Phthalates, alkylphenols, pesticides, polybrominated diphenyl ethers, and other endocrine-disrupting compounds in indoor air and dust. Environ Sci Technol (2003) 37:4543–53. doi:10.1021/es0264596
4. Schettler T. Human exposure to phthalates via consumer products. Int J Androl (2006) 29:134–9. doi:10.1111/j.1365-2605.2005.00567.x
5. Fromme H, Ku¨ chler T, Otto T, Pilz K, Mu¨ ller J, Wenzel A. Occurrence of phthalates and bisphenol a and f in the environment. Water Res (2002) 36:1429–38. doi:10.1016/s0043-1354(01)00367-0
6. Liang D-W, Zhang T, Fang HH, He J. Phthalates biodegradation in the environment. Appl Microbiol Biotechnol (2008) 80:183. doi:10.1007/s00253-008-1548-5
7. Duty SM, Singh NP, Silva MJ, Barr DB, Brock JW, Ryan L, et al. The relationship between environmental exposures to phthalates and dna damage in human sperm using the neutral comet assay. Environ Health Perspect (2003) 111:1164–9. doi:10.1289/ehp.5756
8. Kato K, Silva MJ, Needham LL, Calafat AM. Quantifying phthalate metabolites in human meconium and semen using automated off-line solid-phase extraction coupled with on-line spe and isotope-dilution high-performance liquid chromatography-tandem mass spectrometry. Anal Chem (2006) 78:6651–5. doi:10.1021/ac0608220
9. Mortensen GK, Main KM, Andersson A-M, Leffers H, Skakkebæk NE. Determination of phthalate monoesters in human milk, consumer milk, and infant formula by tandem mass spectrometry (lc–ms–ms). Anal Bioanal Chem (2005) 382:1084–92. doi:10.1007/s00216-005-3218-0
10. Pant N, Shukla M, Patel DK, Shukla Y, Mathur N, Gupta YK, et al. Correlation of phthalate exposures with semen quality. Toxicol Appl Pharmacol (2008) 231:112–6. doi:10.1016/j.taap.2008.04.001
11. Specht IO, Toft G, Hougaard KS, Lindh CH, Lenters V, Jo¨nsson BA, et al. Associations between serum phthalates and biomarkers of reproductive function in 589 adult men. Environ Int (2014) 66:146–56. doi:10.1016/j.envint.2014.02.002
12. Han X, Zhou N, Cui Z, Ma M, Li L, Cai M, et al. Association between urinary polycyclic aromatic hydrocarbon metabolites and sperm dna damage: a population study in chongqing, China. Environ Health Perspect (2011) 119:652–7. doi:10.1289/ehp.1002340
13. Jurewicz J, Radwan M, Sobala W, Brzez´nicki S, Ligocka D, Radwan P, et al. Association between a biomarker of exposure to polycyclic aromatic hydrocarbons and semen quality. Int J Occup Med Environ Health (2013) 26:790–801. doi:10.2478/s13382-013-0152-9
14. Jeng HA, Pan C-H, Lin W-Y, Wu M-T, Taylor S, Chang-Chien G-P, et al. Biomonitoring of polycyclic aromatic hydrocarbons from coke oven emissions and reproductive toxicity in nonsmoking workers. J Hazard Mater (2013) 244:436–43. doi:10.1016/j.jhazmat.2012.11.008
15. Duty SM, Silva MJ, Barr DB, Brock JW, Ryan L, Chen Z, et al. Phthalate exposure and human semen parameters. Epidemiology (2003) 14:269–77. doi:10.1097/01.ede.0000059950.11836.16
16. Duty SM, Calafat AM, Silva MJ, Brock JW, Ryan L, Chen Z, et al. The relationship between environmental exposure to phthalates and computer-aided sperm analysis motion parameters. J Androl (2004) 25:293–302. doi:10.1002/j.1939-4640.2004.tb02790.x
17. Han X, Cui Z, Zhou N, Ma M, Li L, Li Y, et al. Urinary phthalate metabolites and male reproductive function parameters in chongqing general population, China. Int J Hyg Environ Health (2014) 217:271–8. doi:10.1016/j.ijheh.2013.06.006
18. Joensen UN, Frederiksen H, Jensen MB, Lauritsen MP, Olesen IA, Lassen TH, et al. Phthalate excretion pattern and testicular function: a study of 881 healthy Danish men. Environ Health Perspect (2012) 120:1397–403. doi:10.1289/ehp.1205113
19. Jonsson BA, Richthoff J, Rylander L, Giwercman A, Hagmar L. Urinary phthalate metabolites and biomarkers of reproductive function in young men. Epidemiology (2005) 16:487–93. doi:10.1097/01.ede.0000164555.19041.01
20. Liu L, Bao H, Liu F, Zhang J, Shen H. Phthalates exposure of Chinese reproductive age couples and its effect on male semen quality, a primary study. Environ Int (2012) 42:78–83. doi:10.1016/j.envint.2011.04.005
21. Hauser R. Urinary phthalate metabolites and semen quality: a review of a potential biomarker of susceptibility. Int J Androl (2008) 31:112–7. doi:10.1111/j.1365-2605.2007.00844.x
22. Xia Y, Han Y, Zhu P, Wang S, Gu A, Wang L, et al. Relation between urinary metabolites of polycyclic aromatic hydrocarbons and human semen quality. Environ Sci Technol (2009) 43:4567–73. doi:10.1021/es9000642
23. Hauser R, Meeker JD, Park S, Silva MJ, Calafat AM. Temporal variability of urinary phthalate metabolite levels in men of reproductive age. Environ Health Perspect (2004) 112:1734–40. doi:10.1289/ehp.7212
24. Preau JL, Wong L-Y, Silva MJ, Needham LL, Calafat AM. Variability over 1 week in the urinary concentrations of metabolites of diethyl phthalate and di (2-ethylhexyl) phthalate among eight adults: an observational study. Environ Health Perspect (2010) 118:1748–54. doi:10.1289/ehp.1002231
25. Wang Y-X, You L, Zeng Q, Sun Y, Huang Y-H, Wang C, et al. Phthalate exposure and human semen quality: results from an infertility clinic in China. Environ Res (2015) 142:1–9. doi:10.1016/j.envres.2015.06.010
26. You L, Wang Y-X, Zeng Q, Li M, Huang Y-H, Hu Y, et al. Semen phthalate metabolites, spermatozoa apoptosis, and dna damage: a cross-sectional study in China. Environ Sci Technol (2015) 49:3805–12. doi:10.1021/acs.est.5b00588
27. Wang Y-X, Zhou B, Chen Y-J, Liu C, Huang L-L, Liao J-Q, et al. Thyroid function, phthalate exposure and semen quality: exploring associations and mediation effects in reproductive-aged men. Environ Int (2018) 116:278–85. doi:10.1016/j.envint.2018.04.031
28. Yang P, Wang Y-X, Chen Y-J, Sun L, Li J, Liu C, et al. Urinary polycyclic aromatic hydrocarbon metabolites and human semen quality in China. Environ Sci Technol (2017) 51:958–67. doi:10.1021/acs.est.6b04810
29. Liu Y, Wang Y, Zhang J. New machine learning algorithm: random forest. In: Information Computing and Applications: Third International Conference, ICICA 2012; September 14-16, 2012; Chengde, China (2012). p. 246–52.
30. Abdulkareem NM, Abdulazeez AM. Machine learning classification based on radom forest algorithm: a review. Int J Sci Business (2021) 5:128–42. doi:10.5281/zenodo.4471118
31. Awad M, Khanna R, Awad M, Khanna R. Support vector regression. In: Efficient learning machines: theories, concepts, and applications for engineers and system designers, (Berlin, Germany: Springer)67–80 (2015).
32. Smola AJ, Scholkopf B. A tutorial on support vector regression. Stat Comput (2004) 14:199–222. doi:10.1023/b:stco.0000035301.49549.88
33. Webb GI. Multiboosting: a technique for combining boosting and wagging. Machine Learn (2000) 40:159–96. doi:10.1023/a:1007659514849
34. Natekin A, Knoll A. Gradient boosting machines, a tutorial. Front neurorobotics (2013) 7:21. doi:10.3389/fnbot.2013.00021
35. Schapire RE. Explaining adaboost. In: Empirical inference: festschrift in honor of vladimir N. Vapnik. Berlin, Germany: Springer (2013). p. 37–52.
36. Chen T, He T, Benesty M, Khotilovich V, Tang Y, Cho H, et al. Xgboost: extreme gradient boosting (2015). p. 1–4. R package version 0.4-2 1.
37. Deng Y, Li H. Deep learning for few-shot white blood cell image classification and feature learning. Computer Methods Biomech Biomed Eng Imaging Visualization (2023) 1–11. doi:10.1080/21681163.2023.2219341
38. Zhang Q, Sampani K, Xu M, Cai S, Deng Y, Li H, et al. Aoslo-net: a deep learning-based method for automatic segmentation of retinal microaneurysms from adaptive optics scanning laser ophthalmoscopy images. Translational Vis Sci Tech (2022) 11:7. doi:10.1167/tvst.11.8.7
39. Nazeer SA, Omar N, Khalid M. Face recognition system using artificial neural networks approach. In: 2007 International Conference on Signal Processing, Communications and Networking (IEEE); 24-27 November 2007; Dubai, United Arab Emirates (2007). p. 420–5.
40. Kasar MM, Bhattacharyya D, Kim T. Face recognition using neural network: a review. Int J Security Its Appl (2016) 10:81–100. doi:10.14257/ijsia.2016.10.3.08
41. Rao Q, Frtunikj J. Deep learning for self-driving cars: chances and challenges. In: Proceedings of the 1st international workshop on software engineering for AI in autonomous systems; 28 May 2018; Gothenburg Sweden (2018). p. 35.
42. Do T-D, Duong M-T, Dang Q-V, Le M-H (2018). Real-time self-driving car navigation using deep neural network. In 2018 4th International Conference on Green Technology and Sustainable Development (GTSD) (IEEE), 23-24 November 2018, Ho Chi Minh 7
44. Sundermeyer M, Schlu¨ ter R, Ney H. Lstm neural networks for language modeling. In: Thirteenth annual conference of the international speech communication association; September 9-13, 2012; Portland, Oregon, USA (2012).
45. Murtagh F. Multilayer perceptrons for classification and regression. Neurocomputing (1991) 2:183–97. doi:10.1016/0925-2312(91)90023-5
46. Frenay B, Doquire G, Verleysen M. Is mutual information adequate for feature selection in regression? Neural Networks (2013) 48:1–7. doi:10.1016/j.neunet.2013.07.003
47. Beraha M, Metelli AM, Papini M, Tirinzoni A, Restelli M. Feature selection via mutual information: new theoretical insights. In: 2019 international joint conference on neural networks (IJCNN) (IEEE); July 14-19, 2019; Budapest, Hungary (2019). p. 1.
48. Chen T, Guestrin C. Xgboost: a scalable tree boosting system. In: Proceedings of the 22nd acm sigkdd international conference on knowledge discovery and data mining; August 13-17, 2016; San Francisco, CA, USA (2016). p. 785–94.
49. Snoek J, Larochelle H, Adams RP. Practical bayesian optimization of machine learning algorithms. Adv Neural Inf Process Syst (2012) 25. doi:10.48550/arXiv.1206.2944
50. Wu J, Chen X-Y, Zhang H, Xiong L-D, Lei H, Deng S-H. N-acetyltransferase co-expression increases α-glucosidase expression level in Pichia pastoris. J Electron Sci Tech (2019) 17:26–30. doi:10.1016/j.jbiotec.2018.11.006
51. Frazier PI, Wang J. Bayesian optimization for materials design. In: Information science for materials discovery and design. Berlin, Germany: Springer (2015). p. 45–75.
52. Berkenkamp F, Krause A, Schoellig AP. Bayesian optimization with safety constraints: safe and automatic parameter tuning in robotics. Machine Learn (2021) 112:3713–47. doi:10.1007/s10994-021-06019-1
53. Hebbal A, Brevault L, Balesdent M, Talbi E-G, Melab N. Bayesian optimization using deep Gaussian processes with applications to aerospace system design. Optimization Eng (2021) 22:321–61. doi:10.1007/s11081-020-09517-8
54. Wang Y-X, Zeng Q, Sun Y, Yang P, Wang P, Li J, et al. Semen phthalate metabolites, semen quality parameters and serum reproductive hormones: a cross-sectional study in China. Environ Pollut (2016) 211:173–82. doi:10.1016/j.envpol.2015.12.052
55. Cuomo S, Di Cola VS, Giampaolo F, Rozza G, Raissi M, Piccialli F. Scientific machine learning through physics–informed neural networks: where we are and what’s next. J Scientific Comput (2022) 92:88. doi:10.1007/s10915-022-01939-z
56. Abiodun OI, Jantan A, Omolara AE, Dada KV, Mohamed NA, Arshad H. State-of-the-art in artificial neural network applications: a survey. Heliyon (2018) 4:e00938. doi:10.1016/j.heliyon.2018.e00938
57. Zhang YH, Zheng LX, Chen BH. Phthalate exposure and human semen quality in shanghai: a cross-sectional study. Biomed Environ Sci (2006) 19:205–9.
58. Thurston SW, Mendiola J, Bellamy AR, Levine H, Wang C, Sparks A, et al. Phthalate exposure and semen quality in fertile us men. Andrology (2016) 4:632–8. doi:10.1111/andr.12124
59. Gu J, Wang Z, Kuen J, Ma L, Shahroudy A, Shuai B, et al. Recent advances in convolutional neural networks. Pattern recognition (2018) 77:354–77. doi:10.1016/j.patcog.2017.10.013
60. Sutskever I, Martens J, Hinton GE. Generating text with recurrent neural networks. In: Proceedings of the 28th international conference on machine learning (ICML-11); June 28 - July 2, 2011; Bellevue, Washington, USA (2011). p. 1017.
61. Medsker L, Jain LC. Recurrent neural networks: design and applications. Florida, United States: CRC Press (1999).
63. Qi CR, Su H, Mo K, Guibas LJ. Pointnet: deep learning on point sets for 3d classification and segmentation. In: Proceedings of the IEEE conference on computer vision and pattern recognition; July 21 2017 to July 26 2017; Honolulu, HI, USA (2017). p. 652–60.
64. Aoki Y, Goforth H, Srivatsan RA, Lucey S. Pointnetlk: robust & efficient point cloud registration using pointnet. In: Proceedings of the IEEE/CVF conference on computer vision and pattern recognition; June 15 2019 to June 20 2019; Long Beach, CA, USA (2019). p. 7163. –7172.
65. Qi G, Hongtao L, Jianghong Q, Xingli L, Shengze C, He L, et al. A deep learning model for efficient end-to-end stratification of thrombotic risk in left atrial appendage. Eng Appl Artif Intelligence (2023) 126:106867. doi:10.1016/j.engappai.2023.106867
67. Wolf T, Debut L, Sanh V, Chaumond J, Delangue C, Moi A, et al. Transformers: state-of- the-art natural language processing. In: Proceedings of the 2020 conference on empirical methods in natural language processing: system demonstrations; November 16-20, 2020 (2020). p. 38–45.
68. Khan S, Naseer M, Hayat M, Zamir SW, Khan FS, Shah M. Transformers in vision: a survey. ACM Comput Surv (Csur) (2022) 54:1–41. doi:10.1145/3505244
69. Raissi M, Perdikaris P, Karniadakis GE. Physics-informed neural networks: a deep learning framework for solving forward and inverse problems involving nonlinear partial differential equations. J Comput Phys (2019) 378:686–707. doi:10.1016/j.jcp.2018.10.045
70. Chen Q, Ye Q, Zhang W, Li H, Zheng X. Tgm-nets: a deep learning framework for enhanced forecasting of tumor growth by integrating imaging and modeling. Eng Appl Artif Intelligence (2023) 126:106867. doi:10.1016/j.engappai.2023.106867
71. Cai S, Li H, Zheng F, Kong F, Dao M, Karniadakis GE, et al. Artificial intelligence velocimetry and microaneurysm-on-a-chip for three-dimensional analysis of blood flow in physiology and disease. Proc Natl Acad Sci (2021) 118:e2100697118. doi:10.1073/pnas.2100697118
Keywords: machine learning, artificial intelligence, quality of semen, neural networks, phthalates
Citation: Lu L, Qian Y, Dong Y, Su H, Deng Y, Zeng Q and Li H (2023) A systematic study of the performance of machine learning models on analyzing the association between semen quality and environmental pollutants. Front. Phys. 11:1259273. doi: 10.3389/fphy.2023.1259273
Received: 15 July 2023; Accepted: 03 October 2023;
Published: 17 October 2023.
Edited by:
Gurumurthy Hegde, Christ University, IndiaReviewed by:
Saravana Prakash Thirumuruganandham, Universidad Technologica de Indoamerica, EcuadorCopyright © 2023 Lu, Qian, Dong, Su, Deng, Zeng and Li. This is an open-access article distributed under the terms of the Creative Commons Attribution License (CC BY). The use, distribution or reproduction in other forums is permitted, provided the original author(s) and the copyright owner(s) are credited and that the original publication in this journal is cited, in accordance with accepted academic practice. No use, distribution or reproduction is permitted which does not comply with these terms.
*Correspondence: Lu Lu, bHUubHVAeWFsZS5lZHU=; He Li, aGUubGkzQHVnYS5lZHU=
Disclaimer: All claims expressed in this article are solely those of the authors and do not necessarily represent those of their affiliated organizations, or those of the publisher, the editors and the reviewers. Any product that may be evaluated in this article or claim that may be made by its manufacturer is not guaranteed or endorsed by the publisher.
Research integrity at Frontiers
Learn more about the work of our research integrity team to safeguard the quality of each article we publish.