 Michele Bellingeri1,2*
 Massimiliano Turchetto1,2
 Francesco Scotognella3,4Roberto Alfieri1,2
 Ngoc-Kim-Khanh Nguyen5
 Quang Nguyen6,7Davide Cassi1,2
- 1Dipartimento di Scienze Matematiche, Fisiche e Informatiche, Università di Parma, Parma, Italy
- 2Istituto Nazionale di Fisica Nucleare, Gruppo Collegato di Parma, Parma, Italy
- 3Dipartimento di Fisica, Politecnico di Milano, Milano, Italy
- 4Center for Nano Science and Technology@PoliMi, Istituto Italiano di Tecnologia, Milan, Italy
- 5Faculty of Fundamental Sciences, Van Lang University, Ho Chi Minh City, Vietnam
- 6Department of Physics, International University, Ho Chi Minh City, Vietnam
- 7Vietnam National University, Ho Chi Minh City, Vietnam
In this study, we simulate the degree and betweenness node attack over a large set of 200 real-world networks from different areas of science. We perform an initial node attack approach, where the node centrality rank is computed at the beginning of the simulation, and it is not updated along the node removal process. We quantify the network damage by tracing the largest connected component (
1 Introduction
Networks can model many real-world complex systems, where nodes (vertices) represent the constituent components and links (edges) describe the relationships among the node components [1, 2]. A paramount issue in complex network science is to determine the robustness of the overall system to the failure or attack of its nodes [3–10]. On the other hand, the robustness in complex networks is a problem closely related to understanding which kind of node removal (attack) strategy is the most effective in damaging the network [3, 11–14]. The node attack may model different real-world problems of high interest, such as the nodes/species extinction in ecological networks [15–17], the aging of nodes/chromophores in the photosynthetic network [18], the vaccination of nodes/individuals in social networks [19–22], or the malfunctioning of nodes/routers in computer networks [23, 24].
Network robustness to node attack may change in real-world networks with different structures [11]. Iyer et al. [3] studied network robustness as a function of the node clustering coefficient (or node transitivity). This study demonstrates that networks with higher clustering coefficients are more robust, with the most critical effect for the node degree and node betweenness attack. Nguyen and Trang [25] studied the Facebook social network. They found that those networks with higher modularity, i.e., networks presenting communities of nodes that are highly connected among them, have lower robustness to node removal. Zhou et al. [26] observed that increasing the assortativity of a network makes the network more robust against node removal and the network less stable. Nguyen et al. [27] showed that machine learning approaches unveil the degree assortativity, global closeness, and average node degree as the most critical factors in predicting the robustness (
Network science research shows contrasting outcomes about the role of the network structure in affecting its robustness to node attacks. On one hand, these studies are often based on small datasets of real-world networks, and they need more (robust) statistical analyses. On the other hand, research outcomes generally restrict the investigation, focusing on a few structural features of the networks, thus lacking a wide comparison of network structural indicators (NSIs) to forecast network robustness. For these reasons, understanding which structural features of real-world networks affect their robustness to node removal is still an urgent problem in network science.
In this research, we implement two well-known node attack strategies, i.e., the degree and betweenness node removal over a large set of 200 real-world networks from different areas of science.
We quantify the network functioning damage along the node attack sequence using the largest connected component (
Then, to understand how the network structure affects the network robustness (and the node attack efficacy), we correlate
We find that the Estrada heterogeneity (
2 Methods
2.1 The node attack strategies
We simulated two classic node attack (removal) strategies. The first is the removal of nodes according to their degree (DEG), i.e., the number of links to the node [3, 4, 31]. The DEG strategy removes nodes in decreasing order of connectivity, i.e., the most connected nodes (hubs) are removed first. The second node attack strategy removes nodes in decreasing order of betweenness centrality (BET) [3, 7, 32]. The betweenness centrality is a node centrality based on the shortest paths between node pairs (also called geodesic paths). The shortest path between two nodes is the minimum number of links required to travel from one node to another [33]. The betweenness centrality of a node returns the number of shortest paths from every node pair of the network passing along that node. The betweenness
We perform an “initial node attack approach,” i.e., the node centrality rank is computed at the beginning of the simulation, and it is not updated along the node removal process [11]. The “initial node attack approach” differs from the recalculated (also named adaptive) node attack, in which node centralities are updated after node removals [11, 28]. The initial node attack describes the case where it is not possible to collect information about node features during the node removal process, such as vaccinating nodes/individuals in a social contact network with limited resources (limited time or vaccines) [34] or attacking nodes/routers in a computer network with a simultaneous node attack [28].
For both the node attack strategies, in the case of ties, i.e., nodes with equal ranking, we randomly sort their sequence. We perform 103 simulations for each node attack strategy. We implemented the node attack simulations using the igraph package of the R program. The simulations are carried out on the high-performance computing (HPC) cluster of the “Università degli Studi di Parma.”
2.2 Real-world networks
We analyzed a large dataset of real-world network systems composed of 200 networks from different fields of science. The real-world networks analyzed here come from social, biological, Internet, road, transportation, neuronal, and ecological networks. The networks analyzed here are undirected (i.e., do not account for link directionality) and unweighted (do not account for link weight). The number of network nodes ranges from
2.3 Network structure indexes
We considered 20 different NSIs from the network science literature, graph theory, and chemical graph theory to predict
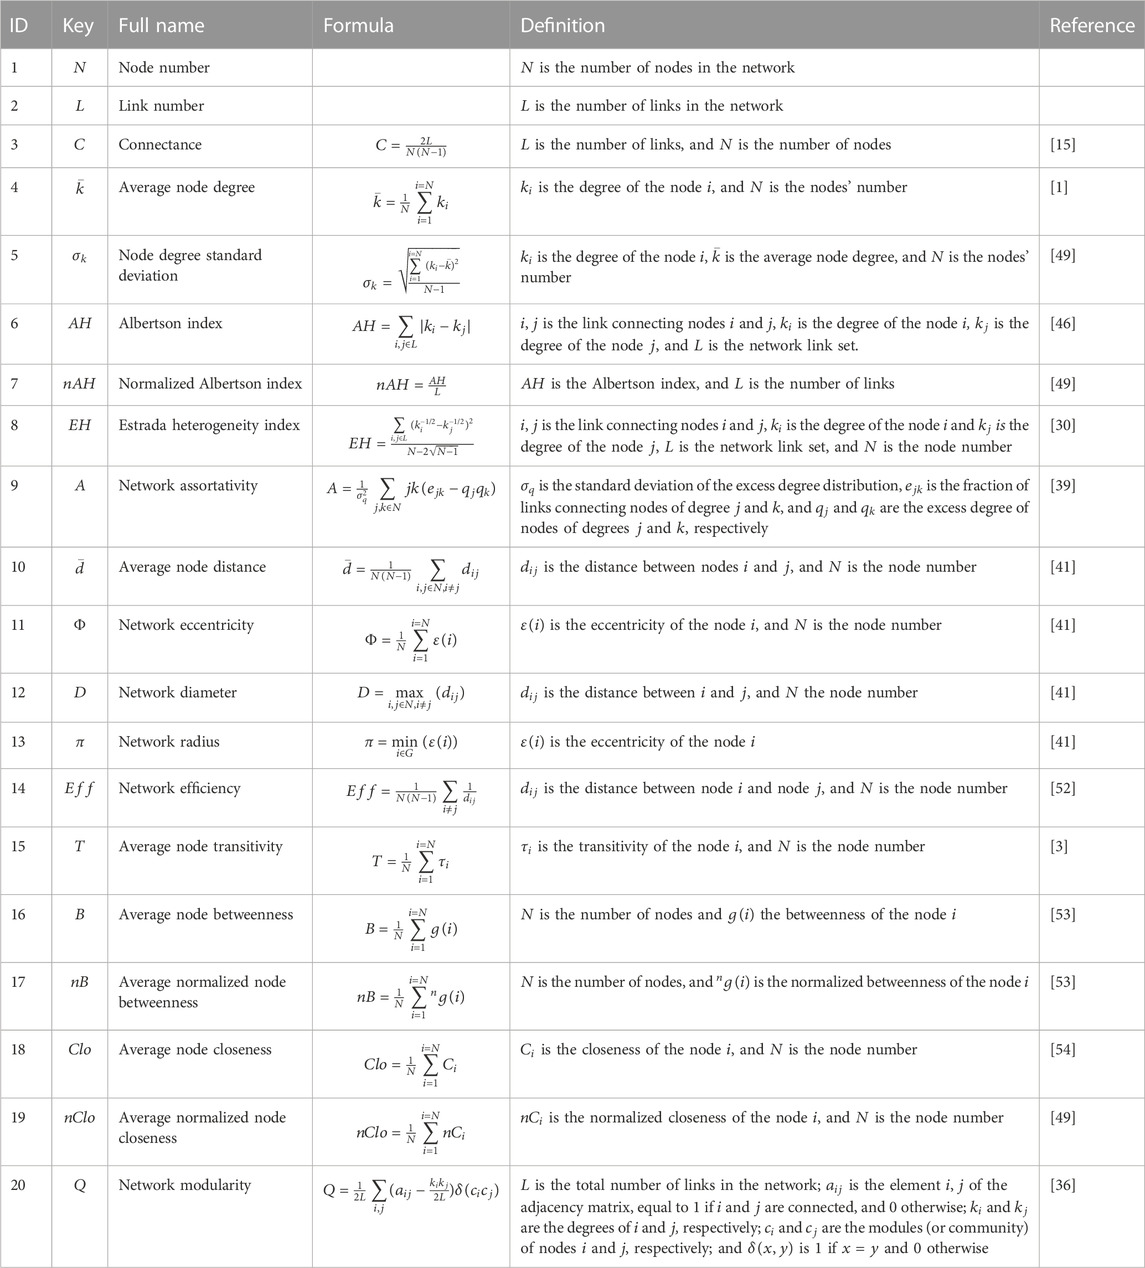
TABLE 1. Network structural indicator (NSI) list with a short definition and reference.
2.4 The network robustness
To evaluate the networks’ response to node attack, we trace
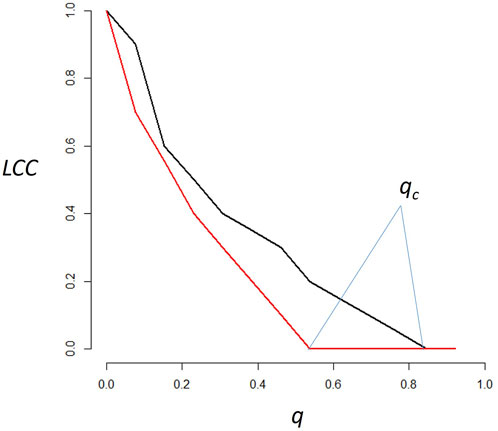
FIGURE 1.
2.5 The linear regression models
We perform regression model analyses to understand the relationship between NSI and the
where a is the intercept and
Then, we perform MLR models. MLR is an extension of SLR for multi-dimension variables
where
We use the lm function of the R program to perform the SLR and MLR models. The fitting process is computed using the OLS method, which estimates the coefficients by minimizing an appropriate loss function [49].
Last, we perform the Pearson correlation coefficient (
3 Results
Figure 2 shows the scatterplots of qc vs. NSIs for the DEG node attack strategy. Figure 3 shows the scatterplots of qc vs. NSIs for the BET node attack strategy.
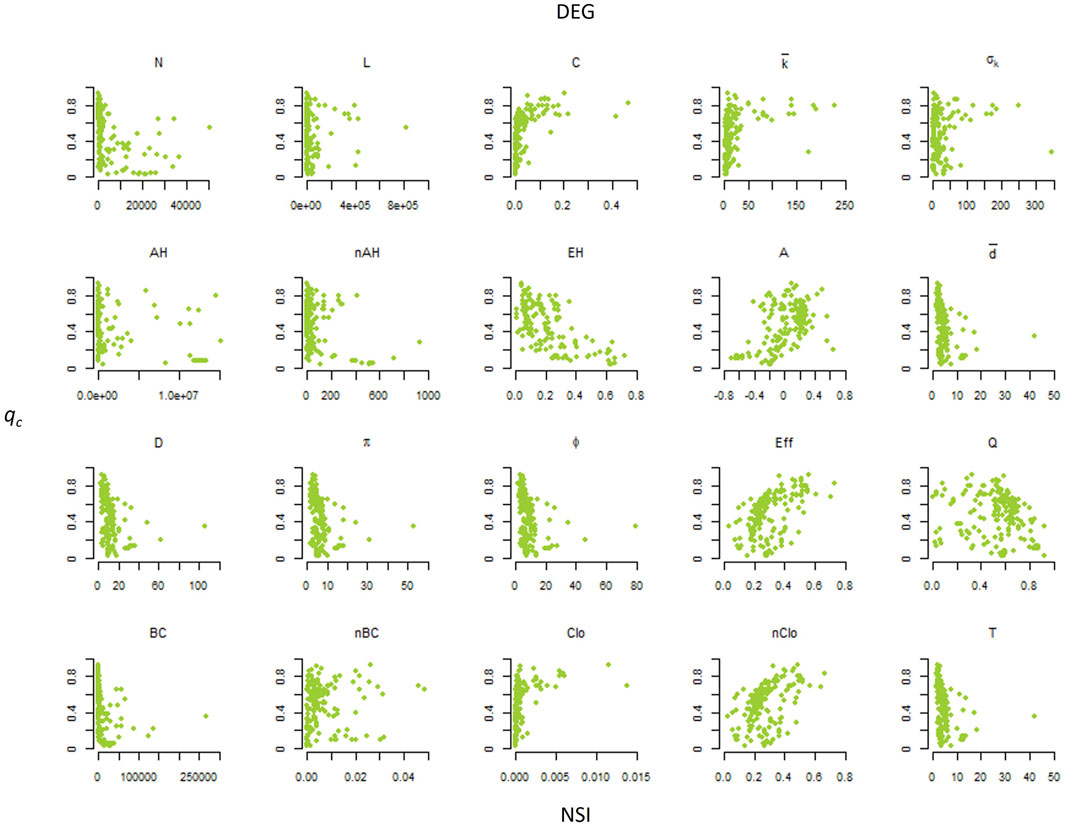
FIGURE 2. Scatterplots of the percolation threshold (qc) vs. the network structural indicators (NSIs) for the DEG node attack strategy, removing nodes with higher degrees first.
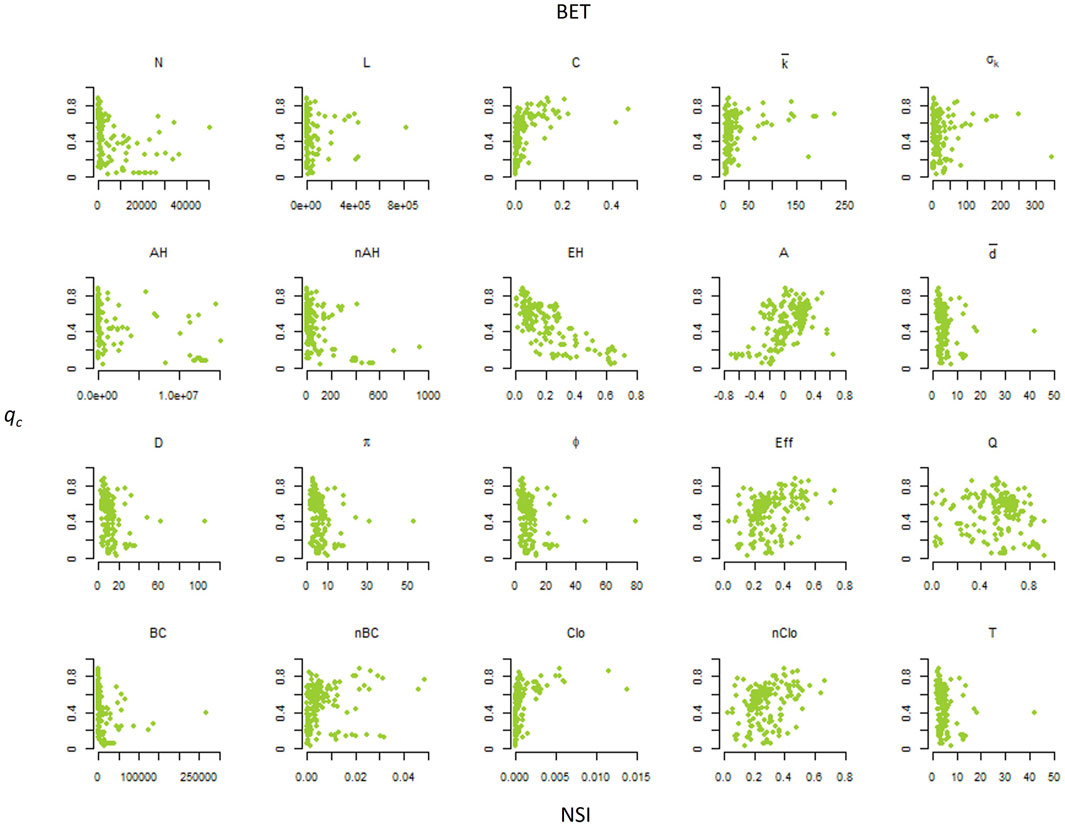
FIGURE 3. Scatterplots of the percolation threshold (qc) vs. the network structural indicators (NSIs) for the BET node attack strategy, removing nodes with higher betweenness first.
Table 2 shows the outcomes of the SLR model. The best NSI to fit an SLR model with
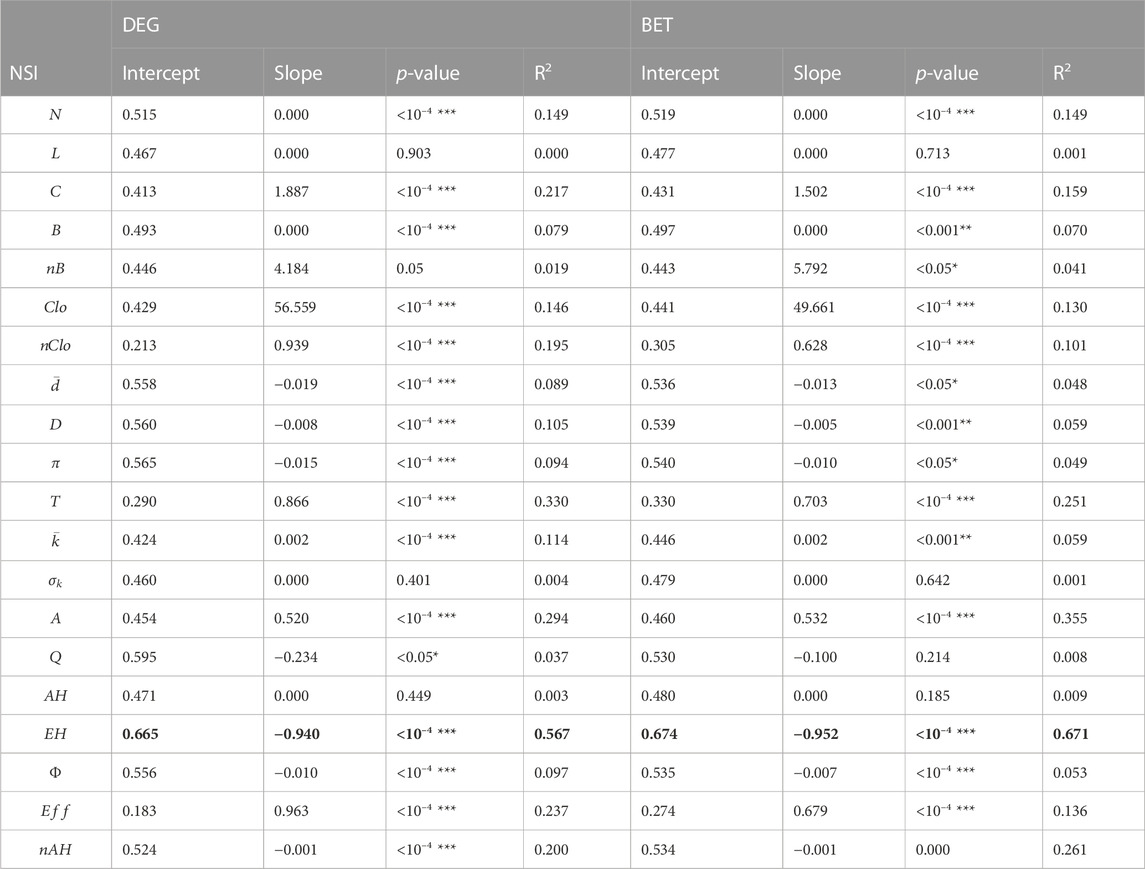
TABLE 2. Single linear regression model outcomes. The best significant predictor with the highest R2 value is in bold.
Table 3 shows the outcomes of the MLR model. The best NSI to predict
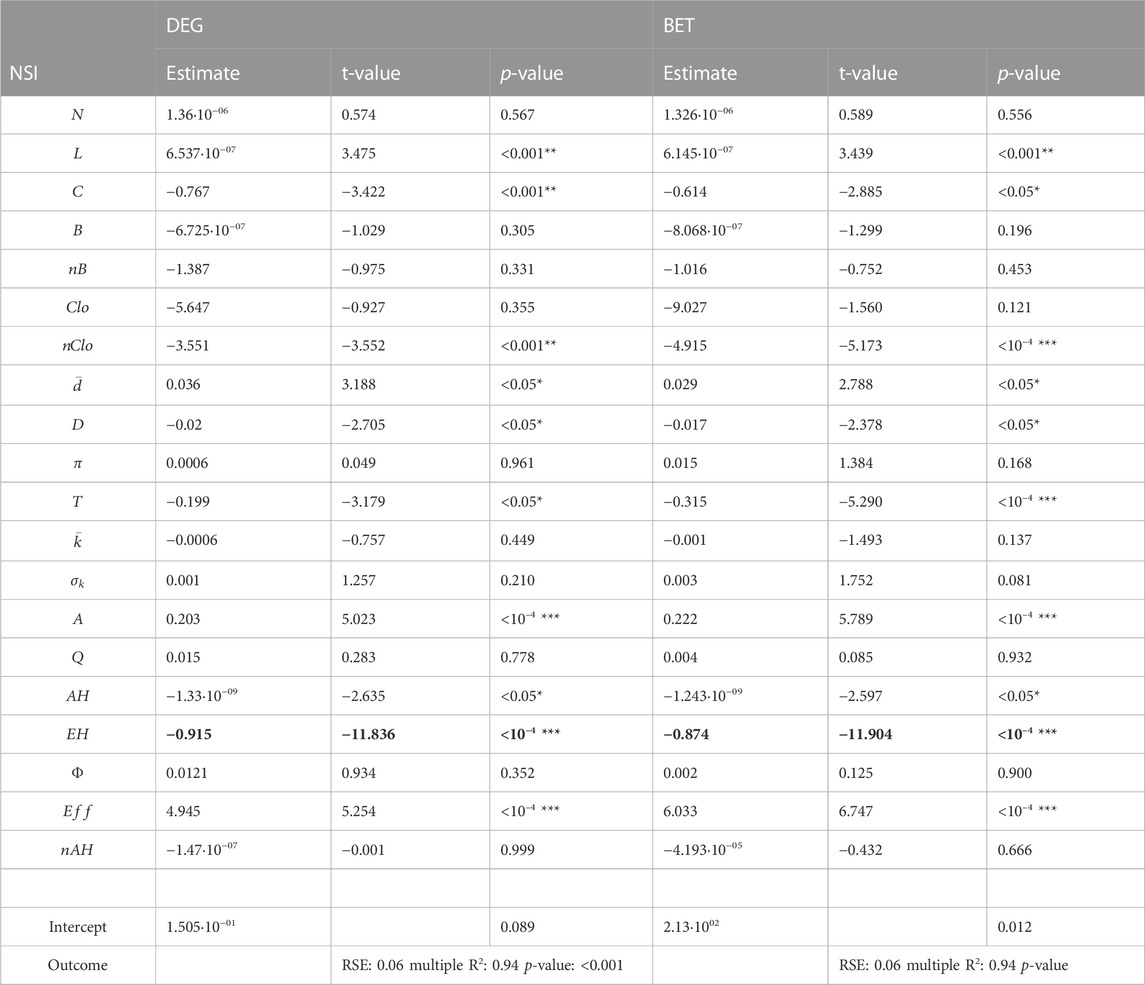
TABLE 3. Multiple linear regression model outcomes. The best significant predictor with the highest absolute t-value is in bold.
Table 4 summarizes the
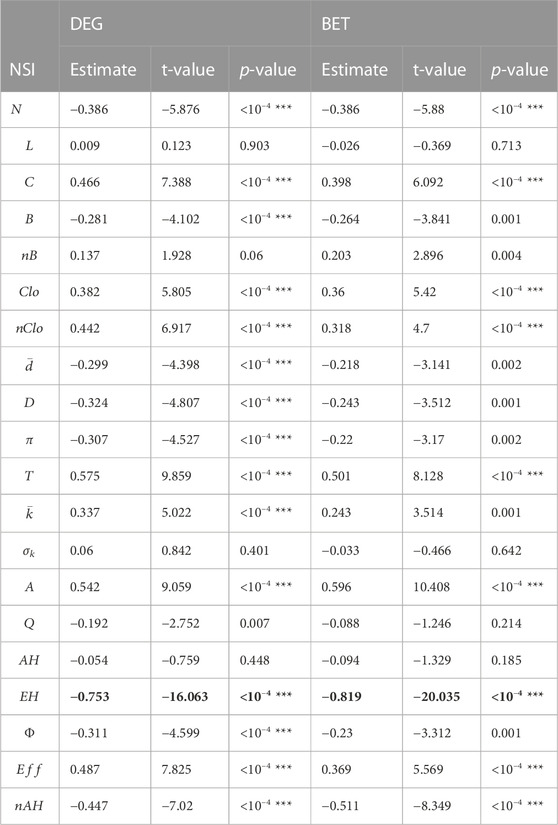
TABLE 4. Pearson correlation coefficient test outcomes. The best significant predictor with the highest absolute t-value is in bold.
4 Discussion
The
The third and fourth ring roads of Beijing City, the capital of China, are the real-world networks of the lowest
The
The assortativity coefficient
Given a certain node degree heterogeneity, assortative networks should have, on average, lower
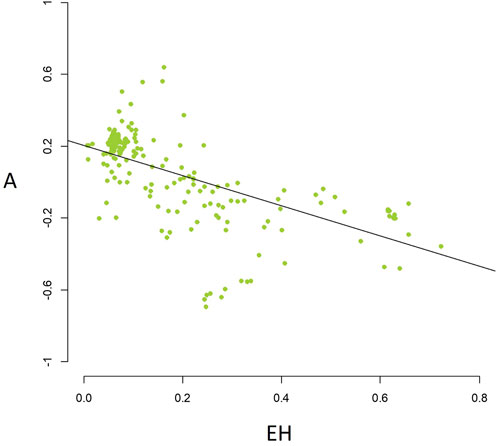
FIGURE 4. Scatterplot of the assortativity coefficient (A) vs. the Estrada heterogeneity (
Consequently, assortative networks should show higher robustness to node attack and higher
To further investigate the relationship between node degree heterogeneity and network robustness, we perform an MLR model holding only
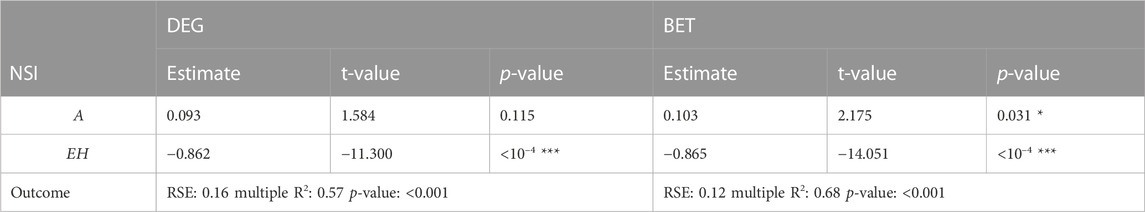
TABLE 5. Multiple linear regression model
5 Conclusion
Investigating node attack strategies provides valuable insights into enhancing network robustness by anticipating potential threats and identifying components that need protection. On the other side of the coin, node attack research plays a crucial role when the aim is to perform a fast network disruption, such as halting the spread of a disease or stopping the diffusion of a computer virus. Here, we investigate the relationship between the network structure and its robustness to node attack in a large dataset of real-world networks. Our results indicate that the degree heterogeneity of connected nodes negatively affects the network robustness. Specifically, the
This paper presents some limitations that may open new lines of research. First, we perform linear regression models only. The relationship between NSIs and the percolation threshold qc of the real-world networks may follow nonlinear models. Therefore, a natural extension of this research may consider nonlinear regression models, such as logistic, monomolecular, or exponential functions, to describe the relationship between the structure and the percolation threshold of real-world networks. Then, we adopt an initial node attack approach to study network robustness. Future research may analyze the robustness of real-world networks using recalculated node attacks, in which node ranking is updated after each node removal. Last, it would be interesting to investigate how NSIs correlate with other robustness indexes besides
Data availability statement
The original contributions presented in the study are included in the article/Supplementary Material; further inquiries can be directed to the corresponding author.
Author contributions
MB, RA, and DC conceived the research. MB wrote the simulation codes. MB and RA performed the simulations. MB performed statistical analyses. All authors contributed to the article and approved the submitted version.
Funding
This research is funded by a grant from the Italian Ministry of Foreign Affairs and International Cooperation, by the Ecosister project, funded under the National Recovery and Resilience Plan (NRRP), and Mission 4 Component 2 Investment 1.5—Call for tender No. 3277 of 30/12/2021 of Italian Ministry of University and Research funded by the European Union—NextGenerationEU Award Number: Project code ECS00000033, Concession Decree No. 1052 of 23/06/2022 adopted by the Italian Ministry. This project has received funding from the European Research Council (ERC) under the European Union’s Horizon 2020 research and innovation programme (grant agreement No. (816313)). This work is supported by the Vietnam’s Ministry of Science and Technology (MOST) under the Vietnam-Italy scientific and technological cooperation program for the period 2021–2023. This work is supported by the Vietnam National University Ho Chi Minh City (VNU-HCM), Ho Chi Minh City, Vietnam, under grant number B2018-42-01. This research is funded by a grant from the Italian Ministry of Foreign Affairs and International Cooperation.
Acknowledgments
MB, MT, DC, and RA acknowledge the Italian Ministry of Foreign Affairs and International Cooperation. The authors are greatly thankful to Van Lang University, Vietnam, for providing the budget for this study. This research has benefited from the high-performance computing (HPC) cluster of the Università degli Studi di Parma. They thank Fabio Sartori for the revision of the first manuscript draft. They also thank Prof. Stefano Poletti for the intriguing discussions about this research.
Conflict of interest
The authors declare that the research was conducted in the absence of any commercial or financial relationships that could be construed as a potential conflict of interest.
Publisher’s note
All claims expressed in this article are solely those of the authors and do not necessarily represent those of their affiliated organizations, or those of the publisher, the editors, and the reviewers. Any product that may be evaluated in this article, or claim that may be made by its manufacturer, is not guaranteed or endorsed by the publisher.
Supplementary material
The Supplementary Material for this article can be found online at: https://www.frontiersin.org/articles/10.3389/fphy.2023.1245564/full#supplementary-material
References
1. Boccaletti S, Latora V, Moreno Y, Chavez M, Hwang DU. Complex networks: Structure and dynamics. Phys Rep (2006) 424:175–308. doi:10.1016/j.physrep.2005.10.009
2. Bellingeri M, Bevacqua D, Scotognella F, Alfieri R, Nguyen Q, Montepietra D, et al. Link and node removal in real social networks: A review. Front Phys (2020) 8:8. doi:10.3389/fphy.2020.00228
3. Iyer S, Killingback T, Sundaram B, Wang Z. Attack robustness and centrality of complex networks. PLoS One (2013) 8:e59613. doi:10.1371/journal.pone.0059613
4. Nguyen Q, Vu T, Dinh H, Cassi D, Scotognella F, Alfieri R, et al. Modularity affects the robustness of scale-free model and real-world social networks under betweenness and degree-based node attack. Appl Netw Sci (2021) 6:82. doi:10.1007/s41109-021-00426-y
5. Da Cunha BR, González-Avella JC, Gonçalves S. Fast fragmentation of networks using module-based attacks. PLoS One (2015) 10. doi:10.1371/journal.pone.0142824
6. Cerqueti R, Ciciretti R, Dalò A, Nicolosi M. A new measure of the resilience for networks of funds with applications to socially responsible investments. Phys A Stat Mech Its Appl (2022) 593:126976. doi:10.1016/j.physa.2022.126976
7. Lekha DS, Balakrishnan K. Central attacks in complex networks: A revisit with new fallback strategy. Phys A Stat Mech Its Appl (2020) 549:124347. doi:10.1016/j.physa.2020.124347
8. Shang Y. Random lifts of graphs: Network robustness based on the Estrada index (2012). Available at: http://www.math.nthu.edu.tw/amen/.
9. Shang YL. Local natural connectivity in complex networks. Chin Phys Lett (2011) 28:068903. doi:10.1088/0256-307X/28/6/068903
10. Shang Y. Biased edge failure in scale-free networks based on natural connectivity. Indian J Phys (2012) 86:485–8. doi:10.1007/s12648-012-0084-4
11. Wandelt S, Sun X, Feng D, Zanin M, Havlin S. A comparative analysis of approaches to network-dismantling. Sci Rep (2018) 8:13513. doi:10.1038/s41598-018-31902-8
12. Tian L, Bashan A, Shi DN, Liu YY. Articulation points in complex networks. Nat Commun (2017) 8:14223. doi:10.1038/ncomms14223
13. Bellingeri M, Lu ZM, Cassi D, Scotognella F. Analyses of the response of a complex weighted network to nodes removal strategies considering links weight: The case of the Beijing urban road system. Mod Phys Lett B (2018) 32:1850067–11. 1850067. doi:10.1142/S0217984918500677
14. Cuadra L, Salcedo-Sanz S, Del Ser J, Jiménez-Fernández S, Geem ZW. A critical review of robustness in power grids using complex networks concepts. Energies (2015) 8:9211–65. doi:10.3390/en8099211
15. Bellingeri M, Vincenzi S. Robustness of empirical food webs with varying consumer’s sensitivities to loss of resources. J Theor Biol (2013) 333:18–26. doi:10.1016/j.jtbi.2013.04.033
16. Calizza E, Costantini ML, Rossi L. Effect of multiple disturbances on food web vulnerability to biodiversity loss in detritus-based systems. Ecosphere (2015) 6:art124–20. doi:10.1890/ES14-00489.1
17. Dunne Ja., Williams RJ, Martinez ND. Network structure and biodiversity loss in food webs: Robustness increases with connectance. Ecol Lett (2002) 5:558–67. doi:10.1046/j.1461-0248.2002.00354.x
18. Montepietra D, Bellingeri M, Ross AM, Scotognella F, Cassi D. Modelling photosystem I as a complex interacting network. J R Soc Interf (2020) 17:20200813. doi:10.1098/rsif.2020.0813
19. Sartori F, Turchetto M, Bellingeri M, Scotognella F, Alfieri R, Nguyen NKK, et al. A comparison of node vaccination strategies to halt SIR epidemic spreading in real-world complex networks. Sci Rep (2022) 12:21355. doi:10.1038/s41598-022-24652-1
20. Wang Z, Zhao DW, Wang L, Sun GQ, Jin Z. Immunity of multiplex networks via acquaintance vaccination. EPL (2015) 112:48002. doi:10.1209/0295-5075/112/48002
21. Gallos LK, Liljeros F, Argyrakis P, Bunde A, Havlin S. Improving immunization strategies. Phys Rev E - Stat Nonlinear, Soft Matter Phys (2007) 75:045104. doi:10.1103/PhysRevE.75.045104
22. Hartnett GS, Parker E, Gulden TR, Vardavas R, Kravitz D. Modelling the impact of social distancing and targeted vaccination on the spread of COVID-19 through a real city-scale contact network. J Complex Networks (2021) 9:cnab042. doi:10.1093/comnet/cnab042
23. Wang J, Jiang C, Qian J. Robustness of Internet under targeted attack: A cascading failure perspective. J Netw Comput Appl (2014) 40:97–104. doi:10.1016/j.jnca.2013.08.007
24. Doyle JC, Alderson DL, Li L, Low S, Roughan M, Shalunov S, et al. The “robust yet fragile” nature of the Internet. Proc Natl Acad Sci U S A (2005) 102:14497–502. doi:10.1073/pnas.0501426102
25. Nguyen Q, Le T-T. Structure and robustness of Facebook’s pages networks. In: Proceeding of the 2019 the 10th conference on network modeling and analysis; November 06 - 08, 2019; Dijon, France (2019).
26. Zhou D, Stanley HE, D’Agostino G, Scala A. Assortativity decreases the robustness of interdependent networks. Phys Rev E - Stat Nonlinear, Soft Matter Phys (2012) 86:066103. doi:10.1103/PhysRevE.86.066103
27. Nguyen N-K-K, Nguyen Q, Pham H-H, Le T-T, Nguyen T-M, Cassi D, et al. Predicting the robustness of large real-world social networks using a machine learning model. Complexity (2022) 2022:1–16. doi:10.1155/2022/3616163
28. Bellingeri M, Cassi D, Vincenzi S. Efficiency of attack strategies on complex model and real-world networks. Phys A Stat Mech Its Appl (2014) 414:174–80. doi:10.1016/j.physa.2014.06.079
30. Estrada E. Quantifying network heterogeneity. Phys Rev E - Stat Nonlinear, Soft Matter Phys (2010) 82:066102. doi:10.1103/PhysRevE.82.066102
31. Nie T, Guo Z, Zhao K, Lu ZM. New attack strategies for complex networks. Phys A Stat Mech Its Appl (2015) 424:248–53. doi:10.1016/j.physa.2015.01.004
32. Nguyen Q, Pham HD, Cassi D, Bellingeri M. Conditional attack strategy for real-world complex networks. Phys A Stat Mech Its Appl (2019) 530:121561. doi:10.1016/j.physa.2019.121561
33. Freeman HE. A set of measures of centrality based on betweenness. Sociometry (1977) 40:35. doi:10.2307/3033543
34. Sartori F, Turchetto M, Bellingeri M, Scotognella F, Alfieri R, Nguyen N-K-K, et al. A comparison of node vaccination strategies to halt SIR epidemic spreading in real-world complex networks. Res Sq (2022). doi:10.21203/rs.3.rs-1870717/v1
35. Albert R, Barabási A. Statistical mechanics of complex networks. Rev Mod Phys (2002) 74:47–97. doi:10.1103/revmodphys.74.47
36. Clauset C, Newman MJ, Moore C. Finding community structure in very large networks. Phys Rev E (2004) 70:066111. doi:10.1103/physreve.70.066111
37. Salathe M, James J. Dynamics and control of diseases in networks with community structure. Plos Comput Biol (2010) 6:e1000736. doi:10.1371/journal.pcbi.1000736
38. Estrada E. The many facets of the Estrada indices of graphs and networks. Sema J (2022) 79:57–125. doi:10.1007/s40324-021-00275-w
39. Noldus R, Mieghem PV. Assortativity in complex networks. J Complex Networks (2014) 3:507–42. doi:10.1093/comnet/cnv005
40. Gleeson JP, Melnik S, Hackett A. How clustering affects the bond percolation threshold in complex networks. Phys Rev E - Stat Nonlinear, Soft Matter Phys (2010) 81:066114. doi:10.1103/PhysRevE.81.066114
41. Buckley F, Harary F. Distance in graphs. Redwood City, CA: Addison-Wesley Publishing Company (1990). doi:10.1201/b16132-64
42. Lü L, Chen D, Ren XL, Zhang QM, Zhang YC, Zhou T. Vital nodes identification in complex networks. Phys Rep (2016) 650:1–63. doi:10.1016/j.physrep.2016.06.007
43. Bellingeri M, Bevacqua D, Turchetto M, Scotognella F, Alfieri R, Nguyen NKK, et al. Network structure indexes to forecast epidemic spreading in real-world complex networks. Front Phys (2022) 10:10. doi:10.3389/fphy.2022.1017015
45. Latora V, Marchiori M. Efficient behavior of small-world networks. Phys Rev Lett (2001) 87:198701––4. doi:10.1103/PhysRevLett.87.198701
46. Barthélemy M. Betweenness centrality in large complex networks. Eur Phys J B (2004) 163–8. doi:10.1140/epjb/e2004-00111-4
47. Rochat Y. Closeness centrality extended to unconnected graphs: The harmonic centrality index. Appl Soc Netw Anal (2009) 117.
48. James G, Witten D, Hastie T, Tibshirani R. An introduction to statistical learning with applications in R. Cham: Springer (2013).
50. Schober P, Schwarte LA. Correlation coefficients: Appropriate use and interpretation. Anesth Analg (2018) 126:1763–8. doi:10.1213/ANE.0000000000002864
51. Bellingeri M, Bevacqua D, Scotognella F, Lu Z-M, Cassi D. Efficacy of local attack strategies on the Beijing road complex weighted network. Phys A Stat Mech Its Appl (2018) 510:316–28. doi:10.1016/j.physa.2018.06.127
52. Wapman KH, Zhang S, Clauset A, Larremore DB. Quantifying hierarchy and dynamics in US faculty hiring and retention. Nature (2022) 610:120–7. doi:10.1038/s41586-022-05222-x
53. Newman MEJ. Mixing patterns in networks. Phys Rev E - Stat Physics, Plasmas Fluids Relat Interdiscip Top (2003) 67:026126. doi:10.1103/PhysRevE.67.026126
54. Trajanovski S, Martín-Hernández J, Winterbach W, Van Mieghem P. Robustness envelopes of networks. J Complex Networks (2013) 1:44–62. doi:10.1093/comnet/cnt004
Keywords: complex network, network robustness and resilience, machine learning, node attack sequence, statistical physics
Citation: Bellingeri M, Turchetto M, Scotognella F, Alfieri R, Nguyen N-K-K, Nguyen Q and Cassi D (2023) Forecasting real-world complex networks’ robustness to node attack using network structure indexes. Front. Phys. 11:1245564. doi: 10.3389/fphy.2023.1245564
Received: 23 June 2023; Accepted: 22 September 2023;
Published: 11 October 2023.
Edited by:
Nuno Crokidakis, Fluminense Federal University, BrazilReviewed by:
Divya Sindhu Lekha, Indian Institute of Information Technology, IndiaJihui Han, Zhengzhou University of Light Industry, China
Copyright © 2023 Bellingeri, Turchetto, Scotognella, Alfieri, Nguyen, Nguyen and Cassi. This is an open-access article distributed under the terms of the Creative Commons Attribution License (CC BY). The use, distribution or reproduction in other forums is permitted, provided the original author(s) and the copyright owner(s) are credited and that the original publication in this journal is cited, in accordance with accepted academic practice. No use, distribution or reproduction is permitted which does not comply with these terms.
*Correspondence: Michele Bellingeri, bWljaGVsZS5iZWxsaW5nZXJpQHVuaXByLml0