 Ying Liu
 Yabai He
 Mai Hu3
 Zhenyu Xu
 Xingping Wang
 Ruifeng Kan
- 1Key Laboratory of Environmental Optics and Technology, Hefei Institutes of Physical Sciences, Chinese Academy of Sciences, Hefei, China
- 2Graduate School of Science Island Branch, University of Science and Technology of China, Hefei, China
- 3Department of Mechanical and Automation Engineering, The Chinese University of Hong Kong, Hong Kong, Hong Kong SAR, China
A new gas sensor system with fast response and ultra-high sensitivity has been developed based on a combination of frequency modulation spectroscopy (FMS) and cavity ring-down spectroscopy (CRDS). The system consisted of two distributed feedback laser diodes (DFB-LDs) emitting at frequencies 6251.761 cm-1 (Laser-1) and 6257.762 cm-1 (Laser-2), respectively. A portion of Laser-1’s output was used by a frequency modulation spectroscopy technique to lock its frequency precisely at a CO2 absorption peak, while the rest of its output was coupled to an optical ring-down cavity, together with the Laser-2 output. The Laser-2 operated at a non-absorbing frequency for real-time correction of any baseline ring-down time drift caused by environmental changes (e.g., temperature, pressure). Laser frequency stabilization achieved a 5-fold improvement in CRDS detection sensitivity. This new system was able to make measurements at a data rate of 9 Hz. Based on Allan deviation analysis, the absorbance detection limit of the system was 4.4 × 10⁻¹¹ cm-1 at an optimum averaging time of ∼5 s, whereas the time-normalized sensitivity at 1 s was 7.3 × 10⁻¹¹ cm-1/Hz1/2. Measurements of atmospheric CO2 mole fraction were conducted and demonstrated its good performance and reliability. This sensor will be particularly suitable for making drift-free measurements over long periods, in the fields of environmental and industrial gas sensing.
1 Introduction
Cavity ring-down spectroscopy (CRDS) is a powerful optical sensing tool for environmental monitoring [1, 2], biomedical analysis [3, 4] and chemical reaction studies [5, 6]. It measures the absorption loss caused by intra-cavity gas-phase molecules by measuring the lifetime (ring-down time) of photons inside an optical cavity [7, 8]. CRDS is immune to laser intensity fluctuations. Together with an effectively enhanced optical absorption path length by a high finesse optical cavity [9], CRDS can reach a lower detection limit compared to other spectroscopic techniques [10]. Continuous-wave cavity ring-down spectroscopy (CW-CRDS) has typically achieved detection limits of 10−8 cm−1 to 10−10 cm−1 [11–17], restricted by the jitter of laser frequency and small variation of cavity length caused by changes in ambient temperature, pressure and mechanical vibrations. A laser frequency jitter not only brings errors to the ring-down time, but also disrupts the optical resonance interaction between a laser and an optical cavity. Equipped with high-precision temperature and pressure control of the cavity and precise wavelength monitoring module, the CW-CRDS can reach a sensitivity of 1.6 × 10⁻¹¹ cm-1/Hz1/2 [2, 18]. Alternatively, active frequency locking can also improve the sensitivity of CRDS. Notably, frequency-locking techniques, such as Pound-Drever-Hall (PDH) [19] and optical feedback (OF) [20], have been applied in CRDS. Cygan et al. [21] applied the PDH technique to lock the probe light to a resonant cavity while the cavity was locked to a high-performance He-Ne laser. The design ensured fast and high-precision stabilization of the laser frequency even during repeated unlocking and relocking of the laser to the cavity. The reported measurement sensitivity was 2 × 10⁻¹⁰ cm−1. To improve the sensitivity, Pan et al. [22] used an ultra-stable cavity and added an electro-optical modulator (EOM) to enable the scanning of the spectrum through the generated sidebands. The sensitivity of that system was 2 × 10⁻⁹ cm-1 with only 1 mW of laser power sent into the ring-down cavity. Thanks to the ultra-high frequency stability of the optical frequency comb, Wang et al. [23] and Guo et al. [24] applied it to PDH-locked CRDS and achieved detection sensitivities of 3 × 10⁻¹² cm−1 and 7.6 × 10⁻¹² cm−1, respectively. CRDS systems based on OF technique were compact. Morville et al. [25] pioneered the OF-CRDS through a V-shaped resonant cavity. Subsequently, OF-CRDS devices based on ring and linear cavities were also reported, among which the maximum sensitivity was 10−11 cm−1 [26–29]. The combinations of PDH and OF were capable of increasing the sensitivity up to 10−12 cm−1 [30, 31]. In summary, the detection sensitivity of PDH-CRDS was at least one order of magnitude higher than that of OF-CRDS. However, in PDH-CRDS, the laser frequency needed to be locked to a super-stable reference while in OF-CRDS, the phase of the feedback light needed to be adjusted in real time to avoid laser frequency mode hopping, exposing their disadvantage of complex structure or poor robustness. Additionally, the elimination of background drift can provide good sensitivity. Ye et al. [32] proposed the optical heterodyne (OH) CRDS technique and achieved a detection sensitivity of 1.6 × 10⁻¹⁰ cm−1. Saturated-absorption cavity ring-down (SCAR) spectroscopy is a variation of CRDS. By decoupling and attaining both empty-cavity background and absorption signal, the sensitivity reached 1.1 × 10⁻⁹ cm−1 [33]. Galli et al. [34] exploded the sensitivity to a mole fraction of 5 parts per quadrillion level via a combination of PDH, heterodyne-spectroscopy technique and SCAR.
In this paper, we report the development of an optical sensing system combining CRDS and laser frequency stabilizing and locking to a gas absorption line [35–38]. This ensures drift-free operation of the laser frequency for gas sensing applications over long observation periods. We utilized frequency modulation spectroscopy (FMS) [39, 40] technique on a reference gas cell containing target gas molecules to stabilize and lock the laser frequency. The implementation of this frequency-stabilized-locked CRDS (FSL-CRDS) system and a demonstration of its high detection sensitivity via measurements of ambient carbon dioxide (CO2) will be described in the following sections.
2 Experimental details
2.1 Experimental setup
The diagram of our CRDS system with an FMS-stabilized laser for CO2 gas detection is depicted in Figure 1. We used two DFB-type diode lasers (NTT Electronics, NLK1L5GAAA), operated by two commercial laser controllers (Stanford Research System, LDC501). The output power and linewidth were 10 mW and 2 MHz, respectively. The primary laser (Laser-1) for CRDS was frequency stabilized and locked to a CO2 transition based on an FMS technique, whereas a second laser (Laser-2) was used for measuring absorption-free background ring-down time. The system could be divided into two function modules: an FMS frequency-locking module and a CRDS gas mole fraction measurement module. The fiber-coupled Laser-1 output was split into two beam paths: 10% of the light went to the FMS frequency-locking module, while the remaining 90% went to the CRDS gas mole fraction measurement module. The output of Laser-2 was combined with the 90%-beam of Laser-1 via a fiber optical combiner. As the objective of this work was to measure CO2 absorption, the absorption cell in the frequency-locking module was filled with CO2 gases. The selection of an absorption line will be discussed in Section 2.2. This system is very adaptive. By changing the target gas in the absorption cell to different target gas species, the system could be tailored for sensing other gases.
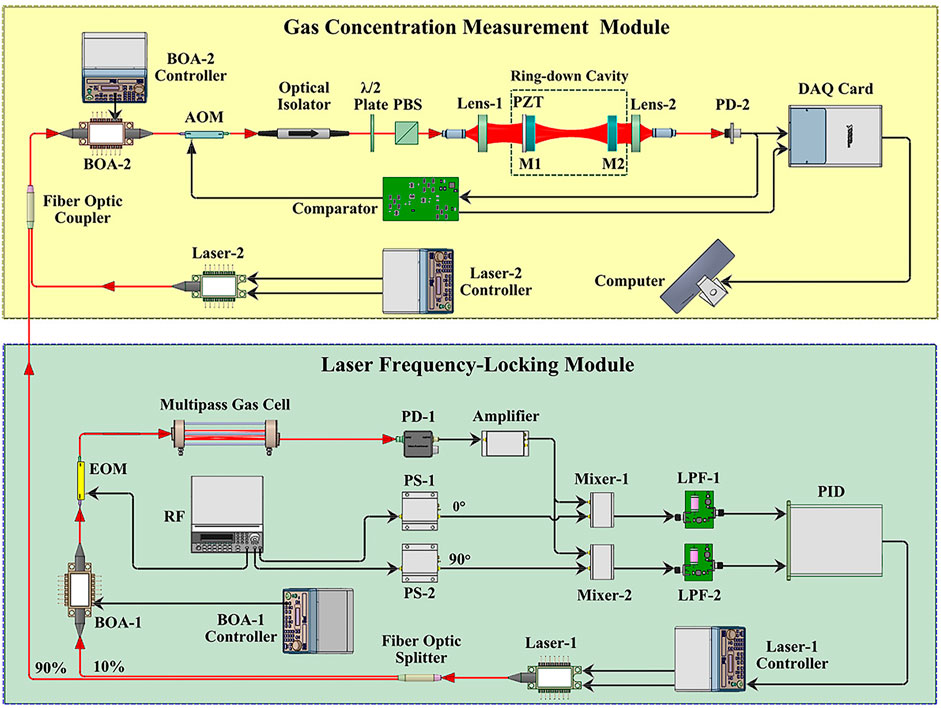
FIGURE 1. Schematic diagram of the frequency-stabilized-locked CRDS for CO2 detection. Black and red lines indicate electrical connections and optical beams, respectively. BOA: booster optical amplifier; EOM: electro-optical modulator; AOM: acousto-optic modulator; RF: radio frequency signal; PS: Phase shifter; LPF: low pass filter; PD: photodiode; PZT: piezoelectric transducer; PBS: polarization beam splitter; and DAQ: data acquisition.
In the frequency-locking module, the shape of the FMS signal should be optimized towards high amplitude, high signal-to-noise ratio and sharp slope to attain a best frequency locking effect. With this goal in mind, the following two efforts were made to the system. Firstly, a booster optical amplifier (BOA-1 in Figure 1, Thorlabs, BOA1080P) was used to amplify the 10%-beam of the Laser-1, as a high light intensity was beneficial for a high signal-to-noise ratio [41]. The phase modulation was achieved by an electro-optical modulator (EOM, Ixblue, MPZ-LN-20-00-P-P-FA-FA), which was driven by a radio frequency signal. Secondly, for a sharp slope, the CO2 sample pressure in the gas cell was set at ∼200 mbar to keep the pressure broadening below 1 GHz. As the CO2 absorption was weak, we used a Herriott multi-pass gas cell with a total path length of 10 m to increase the absorbance to ∼0.38. The transmitted light was collected by a fast photodetector (Thorlabs, DET08CFC/M) and converted into an electrical signal. The photodetector output was further amplifier by a radio-frequency amplifier (Mini-circuits, ZRL-700+) and then fed to two mixers for quadrature demodulation to obtain both the 0°-phase-shift absorption signal and 90°-phase-shift dispersion signal. Both low-pass filters after the mixers had a cutoff frequency of 1 kHz. As the FM modulation frequency of 430 MHz in this work was smaller than the spectral linewidth combining the ∼996 MHz pressure-broadening Lorentzian width (full width at half maximum, FWHM) and the ∼350 MHz FWHM Doppler width, both the signal profiles (see Section 3.1) were suitable to use for feedback controlling the laser frequency to the spectral line center. In this work, we utilized their difference signal as the error signal for laser frequency stabilization instead of only the dispersion signal. This would enable a possible cancellation of common offset drifts if happened in both channels of similar electronics. A proportional-integral-derivative controller (PID, New Focus, LB1005-S) was employed to finely regulate the operation current of Laser 1 and subsequently the laser frequency. A manual offset could be added to the error signal for fine frequency tuning.
The gas mole fraction measurement module in Figure 1 is based on the CRDS technique. The absorption coefficient
where,
To address the
In the above system, the drivers of lasers and BOAs, the radio frequency signal source, the PID controller and the data acquisition card were individual commercial products. It would be possible in the future to integrate all these functions into a compact package and to miniaturize the system.
2.2 Laser frequency selection
In this system, both FMS and CRDS techniques were used. FMS was for stabilizing and locking the frequency of Laser-1 to an absorption feature of target gas molecules filled in a gas cell—a CO2 absorption gas cell in this instance, whereas, the primary purpose of the system is for CRDS sensing measurements. Therefore, the selection of the CO2 absorption line and the corresponding frequency of Laser-1 used by the CRDS for sensing measurements of CO2 gas needed to consider: 1) the absorption line possesses an appropriate intensity, so that a resulting absorbance not too much lower than the mirror losses (1-R = 70 ppm) was preferred; 2) it is an isolated absorption line so to reduce the influence of other nearby absorption lines which may have different pressure broadening and pressure frequency shifting; 3) it is free from interferences from other gases in the atmosphere, such as water vapor, methane, etc.
In this study using NIR diode lasers, we chose the CO2 absorption line at the frequency 6251.761 cm−1 (or the wavelength 1599.55 nm) with the following characteristic details: transition quantum number notation (3001–0000) R (36)e, line intensity 5.4 × 10⁻²⁴ cm/mol, air-broadening coefficient (value of half width at half maximum, HWHM) 0.0678 cm−1/atm and self-broadening coefficient (value of HWHM) 0.083 cm−1/atm (values extracted from the HITRAN database). Figure 2 shows the simulated absorption spectra of 400 ppm CO2, 2% H2O, 2 ppm CH4, 10 ppb NO2, 300 ppb NO, 300 ppb N2O and 100 ppb CO for the frequency region from 6251.5 cm−1 to 6252 cm−1. The simulation spectra were at a temperature of 300 K, a total air pressure of 200 mbar and a path length of 1 cm, based on spectral parameters from the HITRAN database. These mole fraction values were typical for normal atmospheric air.
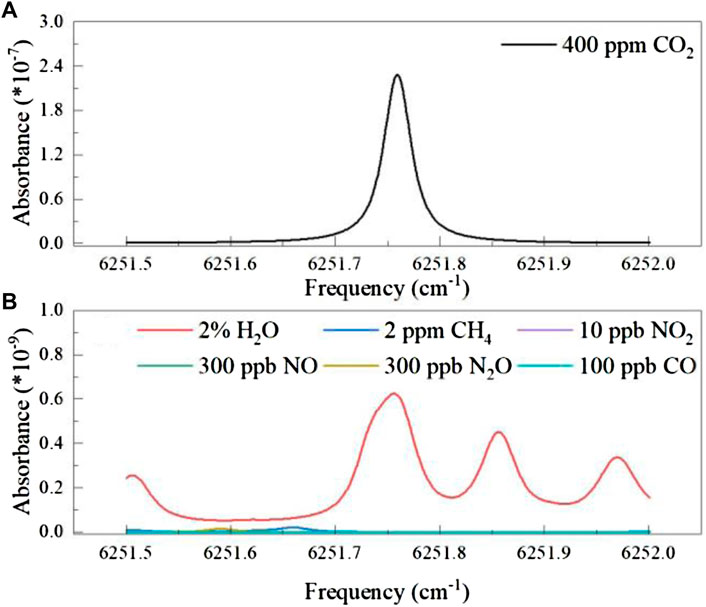
FIGURE 2. Simulation absorption spectra of (A) 400 ppm CO2 and (B) 2% H2O, 2 ppm CH4, 10 ppb NO2, 300 ppb NO, 300 ppb N2O and 100 ppb CO in air at a total sample pressure of 200 mbar, path length of 1 cm, and temperature of 300 K.
The absorbance of CO2 at the line center was 2.28 × 10⁻⁷, while the maximum absorbance among the interfering gases was 6.21 × 10⁻¹⁰ by H2O. The absorbance of the other interfering gases was at the level of 10−12 or less, and was below the detection limit of our CRDS system. To minimize the impact of residual H2O vapor in the input gas sample, we let the inlet gas sample pass through a 20-cm-long silica gel desiccant. It reduced the H2O vapor from 2% to (0.4–0.6)%, corresponding to a residual absorbance of (1.3–1.9) × 10−10. The ring-down time of the system at this CO2 absorption was about 59 μs and could be measured by data acquisition electronics reliably.
As for the frequency of Laser-2, it was managed and finely tuned so that it was away from any gas absorption lines and more importantly, it did not resonate with the optical cavity at the same time as Laser-1. This ensured that the ring-down decays of each laser were observed separately without being disturbed. The laser beam geometry was mode matched to the cavity longitudinal modes by using lenses, so that cavity transverse modes did not get excited. The frequency difference of Laser-2 should meet the requirement in Eq. 2.
where
3 Results
3.1 Effect of frequency-locking module
Based on the selected CO2 absorption line discussed in Section 2.2, two DFB lasers (NTT Electronics, NLK1L5GAAA) centered around wavelength 1,599 nm were used as light sources. Laser-1 was operated at 35°C and 69 mA. Wavelength tuning was achieved via the laser operation temperature and current. By applying a sawtooth waveform (50 Hz, 2 Vpp, as shown in Figure 3A) to the current modulation port of Laser-1 controller, the frequency of Laser-1 could be scanned over the CO2 absorption line at 6251.761 cm-1. The EOM was modulated at 430 MHz with a modulation index of 0.2. Figure 3B presents the dispersion and absorption signal waveforms of the FMS obtained by the two mixers for quadrature demodulations. The error signal used for frequency locking was obtained by their difference.
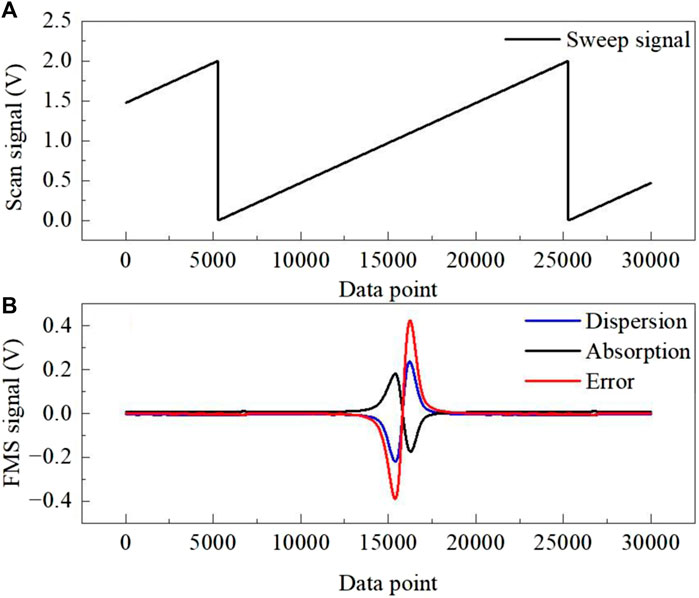
FIGURE 3. Measurements of signal profiles of the frequency modulation spectroscopy scanned over a CO2 absorption line. (A) Sweep signal for laser frequency via its operation current; (B) dispersion (blue line), absorption (black line) signal profiles, and their difference (red line) used as the error signal for feedback controlling the laser frequency.
To stabilize and lock the laser frequency, the frequency of Laser-1 was turned to the CO2 absorption line center by shifting the laser operation current from 69 mA to 85.4 mA. The error signal was fed to the PID controller and its output was connected to the modulation port of Laser-1’s controller instead of the sawtooth sweep signal. Comparisons in the error signal and ring-down time, with and without laser frequency locking, are plotted in Figure 4. For these measurements, the cavity was filled with ambient air with higher CO2 mole fraction to a 200-mbar pressure. Before locking, the average value of error signal in Figure 4A was 16.3 mV at a manual laser frequency setting. After activating the PID controller, the mean value got to 0 mV. Furthermore, the standard deviation was greatly reduced from 4.23 mV to 0.133 mV, denoting a ∼32 times improvement in the laser frequency stability. For the ring-down time measurements with CO2 absorption in Figure 4B, its fluctuation was reduced by improved laser stability. Correspondingly, the mean value of the 1000 ring-down times varied slightly from 19.175 μs to 19.074 μs while the standard deviation fell significantly from 0.228 μs to 0.053 µs The higher frequency stability made a 5-fold reduction in fluctuation of ring-down time measurements as demonstrated in Figure 4B. The exhaled CO2 of indoor air was responsible for this shorter ring-down time. To get the ring-down time quickly and efficiently, the number of acquisition points for these ring-down profiles was reduced to 125, with a corresponding acquisition time of 100 μs which was about five times the ring-down time. Figure 5A depicts the acquired ring-down profile and the modelling of exponential decay via a CSI algorithm. The maximum residual between the data and the fitting curve is about 0.002 V for the ring-down signal profile with a magnitude of 0.6 V, as shown in Figure 5B.
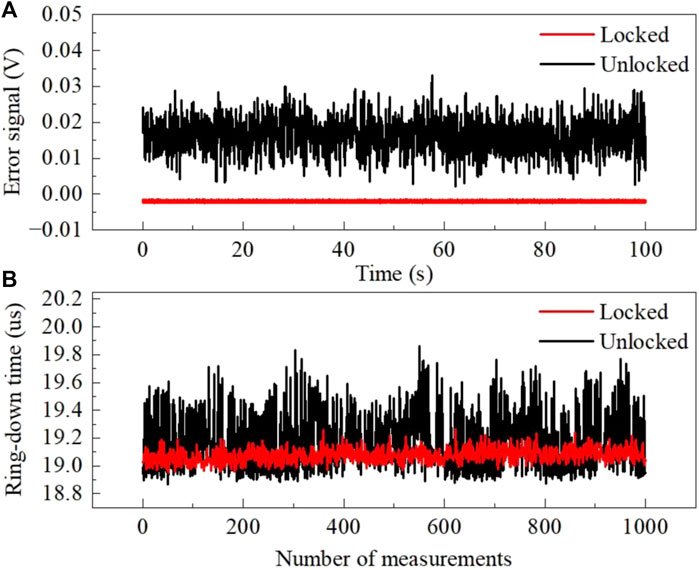
FIGURE 4. (A) Comparison in FMS error signal of the laser with locking (red line) and without locking (black line) the laser frequency. (B) Comparison in stability of ring-down time with locking (red line) and without locking (black line) the laser frequency.
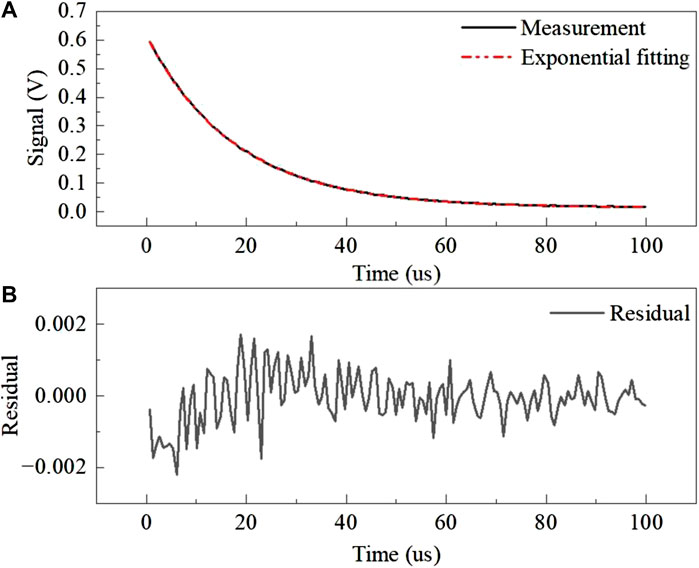
FIGURE 5. (A) Ring-down signal (black line) and fitting curve (red dash line). (B) The fitting residual.
When a laser is in free-running operation mode without frequency stabilization and locking, not only frequency jitter but also a frequency drift occurs. Therefore, tests on the long-term stability of the frequency locking effect were performed. A high-stability wavelength meter (Bristol Instruments, model 721 spectrum analyzer) was used to measure the frequency of Laser-1. Figure 6 reports the comparison of wavelength measurement data with and without locking the laser frequency to the CO2 absorption line for 7 h. Obviously, without locking there was a drift during the first 3.5 h. However, with the help of frequency locking, the laser frequency was precisely stabilized to the absolute frequency of the CO2 absorption line, and remained constant throughout the latter 3.5 h of measurements. In summary, the frequency locking based on FMS improved the laser frequency stability and effectively facilitated the subsequent high-precision CRDS measurements.
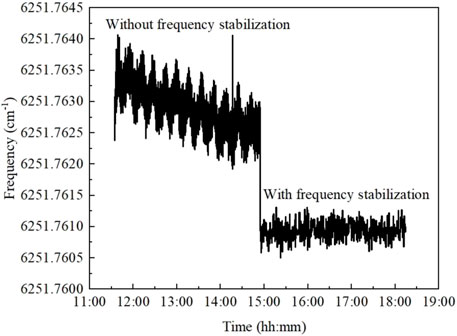
FIGURE 6. Drift and stability of the laser frequency without and with active stabilization.
3.2 Detection limit of CRDS system
The detection limit of the CDRS system is usually given by the ability to determine the minimum change
In one experiment, the gas in the 200-mm-long ring-down cavity was slowly pumped empty by a vacuum pump to become free of absorption. A total of 15,000 ring-down times of the empty cavity were acquired within a total time of 1650 s (or at a data rate of 9.1 Hz). These measurements are displayed in Figure 7A, together with an Allan deviation analysis [54] on the measurements for evaluating long-term system stability, detection limits and optimum averaging time as presented in Figure 7B. The optimum averaging time happened at around 5.0 s, and the corresponding minimum detection limit of absorption coefficient came to 4.4 × 10⁻¹¹ cm−1. When applying this to the CO2 absorption measurement conditions (Figure 2), it amounted to a minimum detectable mole fraction of 78 ppb of CO2. The time-normalized noise equivalent absorption coefficient at 1 s was 7.3 × 10⁻¹¹ cm−1/Hz1/2. It was noted that the Allan deviation started to increase after 5 s. This was possibly due to a mediocre hermeticity of the ring-down cavity and surface adsorption/desorption and minor laser frequency fluctuations under such high measurement sensitivity. The plot shows the ultimate stability of the system’s “absorption-free” background. Therefore, drifts of an empty-cavity ring-down time should be checked within a <5 s time interval before it starts to increase. For measurements with gas samples in the cavity, a change in ring-down time relative to such absorption-free ring-down time measured by laser-2 reduces impact of background drifts.
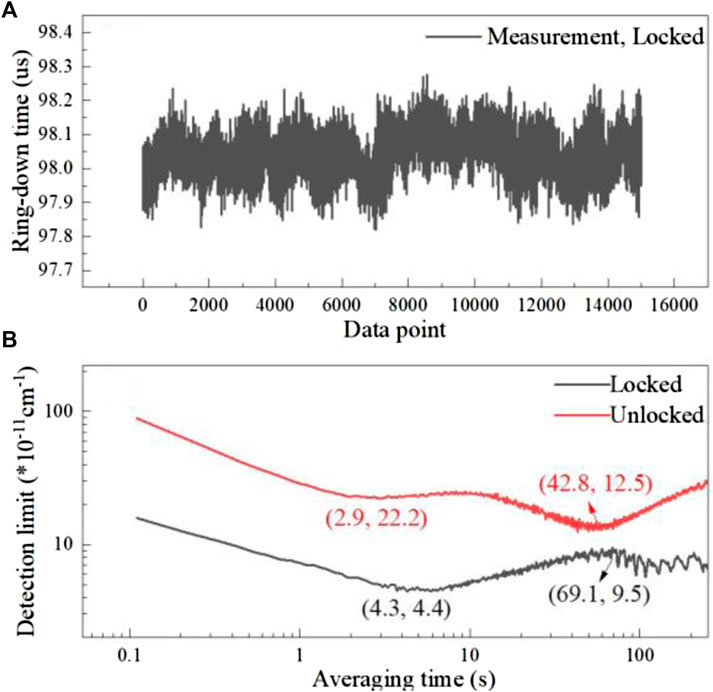
FIGURE 7. (A) Measurements of 15,000 ring-down events within a total time of 1650 s. (B) The Allan deviation analysis with locking (black line) and without locking (red line) for evaluating the sys-tem stability and detection limit.
We made comparison measurements on the same ring-down cavity with and without laser frequency locking. The Allan deviation plot for the measurements with-out laser frequency locking is presented also in Figure 7B. For averaging time of less than 10 s, the improvement in Allan deviations with laser frequency stabilization is about x5.
3.3 Calibration measurements
CO2 standard gas samples at mole fractions of 400 ppm, 600 ppm, 800 ppm, and 1000 ppm (with an uncertainty of 2%, from a commercial supplier) were used to calibrate the CRDS system. With the gas flow rate fixed at 60 mL/min, the measurement time at each and every mole fraction lasted for more than 10 min and the cavity was purged by N2 gas when changing gas samples to avoid any interference. Figure 8 depicts the results of the calibration measurements. Apparently, the system exhibits a good linear response over a wide range of CO2 mole fractions with an outstanding linear correlation coefficient of 0.99999. The fitting parameters a and b of the straight-line modelling will be used for calculating CO2 mole fraction of CRDS measurements of unknown atmospheric samples.
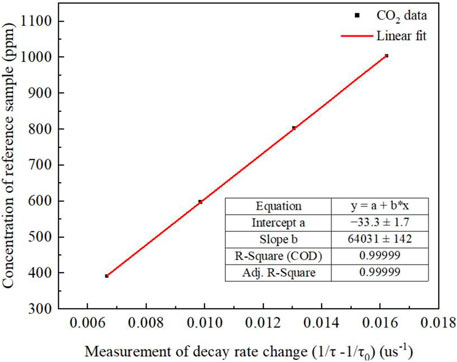
FIGURE 8. Calibration measurements of the CRDS system on reference CO2 samples.
3.4 Measurements of ambient CO2
Measurements of ambient CO2 were performed by our CRDS system and spanned approximately 7 h. Both the temperature and pressure values were recorded simultaneously in real-time to avoid errors in the mole fraction introduced by their fluctuations during the long-time measurement. Each mole fraction value was obtained based on averaging 14 pairs of acquired ring-down times
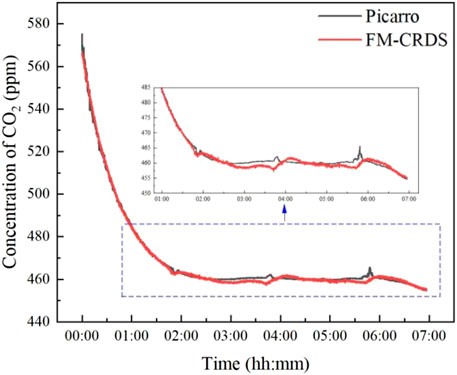
FIGURE 9. Comparison measurements of our developed system against a commercial Picarro G2401 instrument.
4 Conclusion
We demonstrated that a 5-fold improvement in detection sensitivity of cavity ring-down spectroscopy (CRDS) can be achieved by reducing the frequency fluctuation of the laser source used. We used a frequency modulation spectroscopy (FMS) technique on an absorption line of the target CO2 molecules in a multi-pass gas cell. In addition to reducing the frequency fluctuation, this locked the laser frequency to a CO2 absorption line of 6251.761 cm-1 (or wavelength 1599.55 nm) and thereby ensured a drift-free operation of the laser frequency for long-term gas sensing and monitoring applications. Additionally, a second laser operating at a nearby non-absorbing wavelength had been used for measuring the “empty cavity” ring-down time. This ensured that any change of environmental conditions on the CRDS baseline drift was subtracted from absorption calculations. Two booster optical amplifiers helped to increase the output powers of the low-power diode lasers. Finally, from the Allan deviation analysis, the sensitivity of the system with a cavity length of 200 mm was achieved as low as 4.4 × 10⁻¹¹ cm−1, and the corresponding optimum averaging time was ∼5 s. A further improvement in sensitivity might be achieved by increasing the cavity length in a future study. For the measurements of CO2 in the ambient air, a comparison experiment between our system and a commercial Picarro instrument was conducted over 7 h. The results verified the reliability of our system, whose measurement da-ta rate was 9 Hz. Our developed frequency-stabilized-locked CRDS (FSL-CRDS) system achieved both ultra-high precision and rapid measurements of atmospheric CO2, exhibiting a wide application prospect in the field of environmental and industrial gas sensing.
Data availability statement
The raw data supporting the conclusion of this article will be made available by the authors, without undue reservation.
Author contributions
Conceptualization, YL and MH; methodology, YL and MH; software, YL and BC; validation, YL and XW; formal analysis, ZX and LY; investigation, MH and BC; resources, ZX; data curation, LY; writing—original draft preparation, YL; writing—review and editing, YH and YL; visualization, XW; supervision, ZX; project administration, RK; funding acquisition, RK. All authors contributed to the article and approved the submitted version.
Funding
This research was funded by the National Natural Science Foundation of China (Grant No. 62205346), and the Youth Innovation Promotion Association CAS (Grant No. 2022451).
Conflict of interest
The authors declare that the research was conducted in the absence of any commercial or financial relationships that could be construed as a potential conflict of interest.
The reviewer XL declared a shared affiliation with the author(s) to the handling editor at the time of review.
Publisher’s note
All claims expressed in this article are solely those of the authors and do not necessarily represent those of their affiliated organizations, or those of the publisher, the editors and the reviewers. Any product that may be evaluated in this article, or claim that may be made by its manufacturer, is not guaranteed or endorsed by the publisher.
References
1. Atkinson DB. Solving chemical problems of environmental importance using cavity ring-down spectroscopy. The Analyst (2003) 128:117–25. doi:10.1039/B206699H
2. Crosson ER. A cavity ring-down analyzer for measuring atmospheric levels of methane, carbon dioxide, and water vapor. Appl Phys B (2008) 92:403–8. doi:10.1007/s00340-008-3135-y
3. Zhou S, Han Y, Li B. Pressure optimization of an EC-QCL based cavity ring-down spectroscopy instrument for exhaled NO detection. Appl Phys B (2018) 124:27. doi:10.1007/s00340-018-6898-9
4. Ai Y, Li J, Li Q, Sun M, Li Y, Wang C. Cavity ringdown spectroscopy of nitric oxide in the ultraviolet region for human breath test. J Breath Res (2020) 14:037101. doi:10.1088/1752-7163/ab8184
5. Bechtel KL, Zare RN, Kachanov AA, Sanders SS, Paldus BA. Moving beyond traditional UV-visible absorption detection: Cavity ring-down spectroscopy for HPLC. Anal Chem (2005) 77:1177–82. doi:10.1021/ac048444r
6. Mondal K, Kaipara R, Rajakumar B. Investigation of the absorption cross section of phenyl radical and its kinetics with methanol in the gas phase using cavity ring-down spectroscopy and theoretical methodologies. J Phys Chem A (2019) 123:9682–92. doi:10.1021/acs.jpca.9b09302
7. Ma G, He Y, Chen B, Deng H, Liu Y, Wang X, et al. Quasi-simultaneous sensitive detection of two gas species by cavity-ringdown spectroscopy with two lasers. Sensors (2021) 21:7622. doi:10.3390/S21227622
8. Romanini D, Lehmann KK. Ringdown cavity absorption spectroscopy of the very weak HCN overtone bands with six, seven, and eight stretching quanta. J Chem Phys (1993) 99:6287–301. doi:10.1063/1.465866
9. Thorpe MJ, Moll KD, Jones RJ, Safdi B, Ye J. Broadband cavity ringdown spectroscopy for sensitive and rapid molecular detection. Science (2006) 311:1595–9. doi:10.1126/science.1123921
10. Funke HH, Grissom BL, McGrew CE, Raynor MW. Techniques for the measurement of trace moisture in high-purity electronic specialty gases. Rev Sci Instrum (2003) 74:3909–33. doi:10.1063/1.1597939
11. Romanini D, Kachanov AA, Stoeckel F. Diode laser cavity ring down spectroscopy. Chem Phys Lett (1997) 270:538–45. doi:10.1016/S0009-2614(97)00406-5
12. Schulz KJ, Simpson WR. Frequency-matched cavity ring-down spectroscopy. Chem Phys Lett (1998) 297:523–9. doi:10.1016/S0009-2614(98)01173-7
13. Orr BJ, He Y. Rapidly swept continuous-wave cavity-ringdown spectroscopy. Chem Phys Lett (2011) 512:1–20. doi:10.1016/j.cplett.2011.05.052
14. He Y, Kan R, Englich FV, Liu W, Orr BJ. Simultaneous multi-laser, multi-species trace-level sensing of gas mixtures by rapidly swept continuous-wave cavity-ringdown spectroscopy. Opt Express (2010) 18:20059–71. doi:10.1364/OE.18.020059
15. He Y, Jin C, Kan R, Liu J, Liu W, Hill J, et al. Remote open-path cavity-ringdown spectroscopic sensing of trace gases in air, based on distributed passive sensors linked by km-long optical fibers. Opt Express (2014) 22:13170–89. doi:10.1364/OE.22.013170
16. McHale LE, Hecobian A, Yalin AP. Open-path cavity ring-down spectroscopy for trace gas measurements in ambient air. Opt Express (2016) 24:5523–35. doi:10.1364/OE.24.005523
17. Ma W, Zhou X, Cao Z, Xu F, Tian J, Zhou Y, et al. Development of CO2 gas analyzer based on continuous wave cavity ring-down spectroscopy. Chin J Quant Elect (2021) 38:633–40. doi:10.3969/j.issn.1007-5461
18. Crosson ER, Davis KJ. Cavity ringdown analyzer for atmospheric inversion and eddy-covariance flux measurements. In: Proceedings of the Annual ISA Analysis Division Symposium; April 2-6 2006; Anaheim, CA (2006). p. 199–210.
19. Drever RWP, Hall JL, Kowalski FV, Hough J, Ford GM, Munley AJ, et al. Laser phase and frequency stabilization using an optical resonator. Appl Phys B (1983) 31:97–105. doi:10.1007/BF00702605
20. Lang R, Kobayashi K. External optical feedback effects on semiconductor injection laser properties. IEEE J Quant Elect (1980) 16:347–55. doi:10.1109/JQE.1980.1070479
21. Cygan A, Lisak D, Maslowski P, Bielska K, Wojtewicz S, Domyslawska J, et al. Pound-Drever-Hall-locked, frequency-stabilized cavity ring-down spectrometer. Rev Sci Instrum (2011) 82:063107. doi:10.1063/1.3595680
22. Pan H, Cheng C, Sun Y, Gao B, Liu A, Hu S. Laser-locked, continuously tunable high resolution cavity ring-down spectrometer. Rev Sci Instrum (2011) 82:103110. doi:10.1063/1.3655445
23. Wang J, Sun Y, Tao L, Liu A, Hu S. Communication: Molecular near-infrared transitions determined with sub-kHz accuracy. J Chem Phys (2017) 147:091103. doi:10.1063/1.4998763
24. Guo R, Teng J, Cao K, Dong H, Cui W, Zhang T. Comb-assisted, Pound-Drever-Hall locked cavity ring-down spectrometer for high-performance retrieval of transition parameters. Opt Express (2019) 27:31850–63. doi:10.1364/OE.27.031850
25. Morville J, Romanini D, Kachanov AA, Chenevier M. Two schemes for trace detection using cavity ringdown spectroscopy. Appl Phys B (2004) 78:465–76. doi:10.1007/s00340-003-1363-8
26. Motto-Ros V, Morville J, Rairoux P. Mode-by-mode optical feedback: Cavity ringdown spectroscopy. Appl Phys B (2007) 87:531–8. doi:10.1007/s00340-007-2618-6
27. Hamilton DJ, Nix MGD, Baran SG, Hancock G, Orr-Ewing AJ. Optical feedback cavity-enhanced absorption spectroscopy (OF-CEAS) in a ring cavity. Appl Phys B (2010) 100:233–42. doi:10.1007/s00340-009-3811-6
28. Ma G, Liu Y, Deng H, Xu Z, He Y, Kan R. High finesse optical feedback cavity ringdown spectroscopy. Opt Precision Eng (2022) 30:2305–12. doi:10.37188/OPE.20223019.2305
29. Wang X, Zhao G, Jiao K, Chen B, Kan R, Cong Z, et al. Optical feedback linear cavity ringdown spectroscopy. Front Phys (2022) 10:857371. doi:10.3389/FPHY.2022.857371
30. Burkart J, Romanini D, Kassi S. Optical feedback frequency stabilized cavity ring-down spectroscopy. Opt Lett (2014) 39:4695–8. doi:10.1364/OL.39.004695
31. Zhao G, Bailey DM, Fleisher AJ, Hodges JT, Lehmann KK. Doppler-free two-photon cavity ring-down spectroscopy of a nitrous oxide (N2O) vibrational overtone transition. Phys Rev A (2020) 101:062509. doi:10.1103/PhysRevA.101.062509
32. Ye J, Hall JL. Cavity ringdown heterodyne spectroscopy: High sensitivity with microwatt light power. Phys Rev A (2000) 61:061802. doi:10.1103/PhysRevA.61.061802
33. Giusfredi G, Bartalini S, Borri S, Cancio P, Galli I, Mazzotti D, et al. Saturated-absorption cavity ring-down spectroscopy. Phys Rev Lett (2010) 104:110801. doi:10.1103/PhysRevLett.104.110801
34. Galli I, Bartalini S, Ballerini R, Barucci M, Cancio P, De Pas M, et al. Spectroscopic detection of radiocarbon dioxide at parts-per-quadrillion sensitivity. Optica (2016) 3:385–8. doi:10.1364/OPTICA.3.000385
35. Dong L, Yin W, Ma W, Jia S. A novel control system for automatically locking a diode laser frequency to a selected gas absorption line. Meas Sci Technol (2007) 18:1447–52. doi:10.1088/0957-0233/18/5/033
36. Wang G, Cai T, Wang L, Tan T, Zhang W, Gao X. Application of digital frequency locking techniques in real-time measurement of methane in atmosphere. Chin J Lasers (2011) 38:169–73. doi:10.3788/CJL201138.1008002
37. Numata K, Chen J, Wu S, Abshire JB, Krainak MA. Frequency stabilization of distributed-feedback laser diodes at 1572 nm for lidar measurements of atmospheric carbon dioxide. Appl Opt (2011) 50:1047–56. doi:10.1364/AO.50.001047
38. Hong G, Liang X, Liu H, Zhang H, Shu R. Detection of CO2 average concentration in atmospheric path by cw modulated differential absorption Lidar. Spectrosc Spectral Anal (2020) 40:3653–8. doi:10.3964/J.ISSN.1000-0593(2020)12-3653-06
39. Bjorklund GC. Frequency-modulation spectroscopy: A new method for measuring weak absorptions and dispersions. Opt Lett (1980) 5:15–7. doi:10.1364/OL.5.000015
40. Bjorklund GC, Levenson MD, Lenth W, Ortiz C. Frequency-modulation (FM) spectroscopy – theory of lineshapes and signal-to-noise analysis. Appl Phys B (1983) 32:145–52. doi:10.1007/BF00688820
41. Supplee JM, Whittaker EA, Lenth W. Theoretical description of frequency modulation and wavelength modulation spectroscopy. Appl Opt (1994) 33:6294–302. doi:10.1364/AO.33.006294
42. Chen B, Sun Y, Zhou Z, Chen J, Liu A, Hu S. Ultrasensitive, self-calibrated cavity ring-down spectrometer for quantitative trace gas analysis. Appl Opt (2014) 53:7716–23. doi:10.1364/AO.53.007716
43. Long D, Fleisher AJ, Liu Q, Hodges JT. Ultra-sensitive cavity ring-down spectroscopy in the mid-infrared spectral region. Opt Lett (2016) 41:1612–5. doi:10.1364/OL.41.001612
44. Karhu J, Lehmann K, Vainio M, Metsala M, Halonen L. Step-modulated decay cavity ring-down detection for double resonance spectroscopy. Opt Express (2018) 26:29086–98. doi:10.1364/OE.26.029086
45. Abe H, Hashiguchi K, Lisak D. Dual-laser cavity ring-down spectroscopy for real-time, long-term measurement of trace moisture in gas. Meas Sci Technol (2019) 30:015002. doi:10.1088/1361-6501/aae95c
46. Deng H, Li R, Liu H, He Y, Yang C, Li X, et al. Optical amplification enables a huge sensitivity improvement to laser heterodyne radiometers for high-resolution measurements of atmospheric gases. Opt Lett (2022) 47:4335–8. doi:10.1364/OL.468198
47. Huang H, Lehmann KK. CW cavity ring-down spectroscopy (CRDS) with a semiconductor optical amplifier as intensity modulator. Chem Phys Lett (2008) 463:246–50. doi:10.1016/j.cplett.2008.08.030
48. Dudek JB, Tarsa PB, Velasquez A, Wladyslawski M, Rabinowitz P, Lehmann KK. Trace moisture detection using continuous-wave cavity ring-down spectroscopy. Anal Chem (2003) 75:4599–605. doi:10.1021/ac0343073
49. Huang H, Lehmann KK. Effects of linear birefringence and polarization-dependent loss of supermirrors in cavity ring-down spectroscopy. Appl Opt (2008) 47:3817–27. doi:10.1364/AO.47.003817
50. Fleisher AJ, Long DA, Liu Q, Hodges JT. Precision interferometric measurements of mirror birefringence in high-finesse optical resonators. Phys Rev A (2016) 93:013833. doi:10.1103/PhysRevA.93.013833
51. Wang J, Sun Y, Tao L, Liu A, Hua T, Meng F, et al. Comb-locked cavity ring-down saturation spectroscopy. Rev Sci Instrum (2017) 88:043108. doi:10.1063/1.4980037
52. Hu M, Chen X, Zhang H, Hu M, Jin W, Li M, et al. Fast optical cavity ring-down spectroscopy detection based on first harmonic frequency locking. Opt Precision Eng (2022) 30:363–71. doi:10.37188/OPE.20223004.0363
53. Halmer D, von Basum G, Hering P, Mürtz M. Fast exponential fitting algorithm for real-time instrumental use. Rev Sci. Instrum. (2004) 75:2187–91. doi:10.1063/1.1711189
Keywords: optical sensing, cavity ring-down spectroscopy, laser frequency stabilization, ultra-high sensitivity, drift-free measurement
Citation: Liu Y, He Y, Hu M, Chen B, Xu Z, Yao L, Wang X and Kan R (2023) Cavity ring-down spectroscopy with a laser frequency stabilized and locked to a reference target gas absorption for drift-free accurate gas sensing measurements. Front. Phys. 11:1238869. doi: 10.3389/fphy.2023.1238869
Received: 12 June 2023; Accepted: 11 July 2023;
Published: 19 July 2023.
Edited by:
Carrie Womack, University of Colorado Boulder, United StatesReviewed by:
Xie Liang, Institute of Semiconductors, Chinese Academy of Sciences (CAS), ChinaGiuseppe Brunetti, Politecnico di Bari, Italy
Copyright © 2023 Liu, He, Hu, Chen, Xu, Yao, Wang and Kan. This is an open-access article distributed under the terms of the Creative Commons Attribution License (CC BY). The use, distribution or reproduction in other forums is permitted, provided the original author(s) and the copyright owner(s) are credited and that the original publication in this journal is cited, in accordance with accepted academic practice. No use, distribution or reproduction is permitted which does not comply with these terms.
*Correspondence: Ruifeng Kan, a2FucnVpZmVuZ0BhaW9mbS5hYy5jbg==