 Weihao Gao
 Lei Shao
 Fang Li3
 Li Dong
 Chuan Zhang
 Peiwu Qin
 Wenbin Wei
 Lan Ma
94% of researchers rate our articles as excellent or good
Learn more about the work of our research integrity team to safeguard the quality of each article we publish.
Find out more
ORIGINAL RESEARCH article
Front. Phys., 09 January 2024
Sec. Medical Physics and Imaging
Volume 11 - 2023 | https://doi.org/10.3389/fphy.2023.1235856
Background: Our study aims to develop an artificial intelligence-based high-precision cataract classification and grading evaluation network using fundus images.
Methods: We utilized 1,340 color fundus photographs from 875 participants (aged 50–91 years at image capture) from the Beijing Eye Study 2011. Four experienced and trained ophthalmologists performed the classification of these cases based on slit-lamp and retro-illuminated images. Cataracts were classified into three types based on the location of the lens opacity: cortical cataract, nuclear cataract, and posterior subcapsular cataract. We developed a Dual-Stream Cataract Evaluation Network (DCEN) that uses color photographs of cataract fundus to achieve simultaneous cataract type classification and severity grading. The accuracy of severity grading was enhanced by incorporating the results of type classification.
Results: The DCEN method achieved an accuracy of 0.9762, a sensitivity of 0.9820, an F1 score of 0.9401, and a kappa coefficient of 0.8618 in the cataract classification task. By incorporating type features, the grading of cataract severity can be improved with an accuracy of 0.9703, a sensitivity of 0.9344, an F1 score of 0.9555, and a kappa coefficient of 0.9111. We utilized Grad-CAM visualization technology to analyze and summarize the fundus image features of different types of cataracts, and we verified our conclusions by examining the information entropy of the retinal vascular region.
Conclusion: The proposed DCEN provides a reliable ability to comprehensively evaluate the condition of cataracts from fundus images. Applying deep learning to clinical cataract assessment has the advantages of simplicity, speed, and efficiency.
Age-related cataract is the most significant cause of blindness in the world. According to the Global Burden of Disease Study 2020 Report, the leading cause of blindness in people aged 50 and over worldwide in 2020 was cataract, with more than 15 million cases. There is also 78.8 million population suffering from moderate and severe vision impairment due to cataracts worldwide [1]. Cataracts are currently only effectively treated with surgery. However, due to the uneven development of different areas and shortage of medical resources, many cataract patients have not received proper treatment. It is essential to improve the ability of cataract early detection and classification.
There are three main types of cataracts based on the location of the lens opacity: cortical cataract (CC), nuclear cataract (NC), and posterior subcapsular cataract (PSC) [2]. CC is a wedge-shaped opacity that grows from the outer edge of the lens toward the center [3]. NC represents progressive opacification of the central region of the lens and hardening of the lens nucleus. PSC is opacity in the lens’s posterior capsule, often seen in younger individuals and diabetics [4]. People with a history of ocular trauma were more likely to have CC and PSC [5]. Studies have shown that both systemic and topical steroid use are serious risk factors for developing PSC [6, 7]. PSC can develop faster than two other types of cataracts and is more likely to cause visual impairment [8]. Patients are also likely to have two or three types of cataracts simultaneously.
Studies have shown that when more than one types of cataracts occur together, they have a more significant impact on vision-specific functions. Individually, PSC has the greatest impact before NC and CC [3]. This suggests that the effects of different cataract types are additive and should be considered when assessing the visual-specific functional levels in cataract patients [3].
Based on the type and severity of cataract, the patient’s ability to perform vision-related tasks is affected differently, and the timing and method of surgery vary. Therefore, individualized assessment and management of cataract patients are necessary. Different clinical cataract classification standards have been introduced independently based on these cataract types. Lens Opacities Classification System III and other systems separately assess the severity of three different types based on slit-lamp and retro-illumination images [9–14]. However, manually identifying cataract types and severity can be time-consuming, especially in places without enough experienced medical power. As the cataract gets worse, the fundus image will appear blurrier. Xu et al. [15] propose a cataract gradation system based on fundus images by observing the degree of blurring. The lens is located in the anterior part of the eyeball, while the fundus is situated in the posterior part. The use of fundus cameras for retinal imaging of cataract patients is challenging because light scattering can severely reduce image quality due to lens opacity, resulting in blurry image features. The imaging of fundus images and the description of the lens structure have been introduced in the supplementary documents.
To the best of our knowledge, all cataract studies based on machine learning or deep learning and fundus images focus on assessing cataract severity. For example, Yang et al. [16] built up an ensemble learning model based on independent features extracted from fundus images and Back Propagation Neural Network models. Researchers attempt to add local vessel information to enhance the recognition performance of automatic cataract grading [17]. Previous studies have also used pre-trained Convolutional Neural Network (CNNs) and transfer learning for automatic cataract classification [18]. Methods investigated to detect cataract types automatically mostly were done on retro-illumination images [19–21].
Despite efforts to utilize artificial intelligence and fundus images for the identification of cataracts, such endeavors have largely overlooked the distinctive characteristics of different types of cataracts present in fundus images, as well as neglecting the importance of distinguishing between cataract types when evaluating their severity.
To address these gaps, this work develops a Dual-Stream Cataract Evaluation Network (DCEN) for automatic assessment of cataract from fundus images using modern deep learning algorithms, which can simultaneously give a diagnosis of cataract type and severity. In contrast to the three times manual assessment performed by doctors using slit-lamp examination and retro illumination imaging to evaluate cataracts, using fundus images and artificial intelligence for assessing the type and severity of cataracts has the advantages of being simple, fast, and efficient. It is suitable for physical examination and screening of various healthy populations. In addition, based on the interpretability of the deep learning model, we summarize and verify the characteristics of different cataracts in fundus images, which also improves the understanding of fundus images of cataracts.
In summary, this paper makes two key contributions:
1, This article introduces the DCEN model that can accurately diagnose both the type and severity of cataracts. The study demonstrates that the diagnosis of cataract type can serve as an auxiliary signal to significantly improve the accuracy of severity diagnosis.
2, We summarized and validated the characteristics of fundus images of different types of cataracts. This enhances our understanding of fundus images of cataracts.
The data for development and evaluation in our research were collected from the Beijing Eye Study 2011, conducted by Beijing Tongren Hospital [22]. The Beijing Eye Study 2011 was a population-based cross-sectional study conducted in five communities in the urban district of Haidian (north of Central Beijing) and three communities in the village area of Yufa, Daxing District (south of Beijing). In our experiment, we used 1,340 retinal fundus images from 875 cataract patients, including NC (1,111), CC (194), and PSC (35). Each eye has only one unique macula-centered fundus image. These cases were jointly classified by four experienced and trained ophthalmologists based on slit-lamp and retro-illuminated images. The cortical and posterior subcapsular opacities appeared as darkly shaded areas on a white background of retro-illuminated images. The percentage of the areas with lens opacities was measured using grids manually. In our study, the retro-illuminated image diagnostic criterion for PSC is posterior subcapsular opacity of 1% or more, and the criterion for CC is cortical opacity of 5% or more. The degree of nuclear opacity of the lens was assessed in seven grades, using the Age-Related Eye Disease Study grading system [11]. Grade 1 indicates no nuclear opacity in the lens, while grade 7 indicates very dense nuclear lens opacity. The standard for diagnosing an NC is a nuclear cataract grade of 4 or more. In this study, the acquisition of retinal fundus images was performed using the CR6-45NM fundus camera by Canon, Inc., slit lamp images used as diagnostic criteria were captured using the BG-4 unit by Topcon Medical Systems, Inc.
In the severity task, based on clinical needs, we determined that grades 4 and 5 were mild cataract, and grades 6 and 7 were severe cataract. CC with less than 20% cortical opacity was defined as mild, and CC with greater than 20% cortical opacity was defined as severe. Due to the relatively small number of PSC images and the fact that all patients had less than 20% posterior subcapsular opacity, all images with PSC were classified as mild.
The fundus dataset was allocated into two groups with an 80:20 training-to-testing ratio. The data division is based on the fundus image of the eye as a unit. The degree of cataracts in the left and right eyes of the same patient are mostly different. When training and validating the model, OD and OS are mixed based on random assignment. The training set consisted of 888 NC fundus images, 155 CC fundus images, and 28 PSC fundus images, while the test dataset consisted of 223 NC fundus images, 39 CC fundus images, and 7 PSC fundus images. In the training set, 841 fundus images were diagnosed as mild and 230 as severe; in the test set, 208 fundus images were diagnosed as mild and 61 as severe. All participants in this study were between 50 and 91 years old, with a median age of 67 years. Among them, 429 were female, comprising 55.3% of the total participants. The data allocation of fundus images is random and there is no data filtering and partitioning based on patient age, gender, or disease history. The overall dataset is illustrated in Figure 1A. Additional information about the study participants is summarized in Table 1.
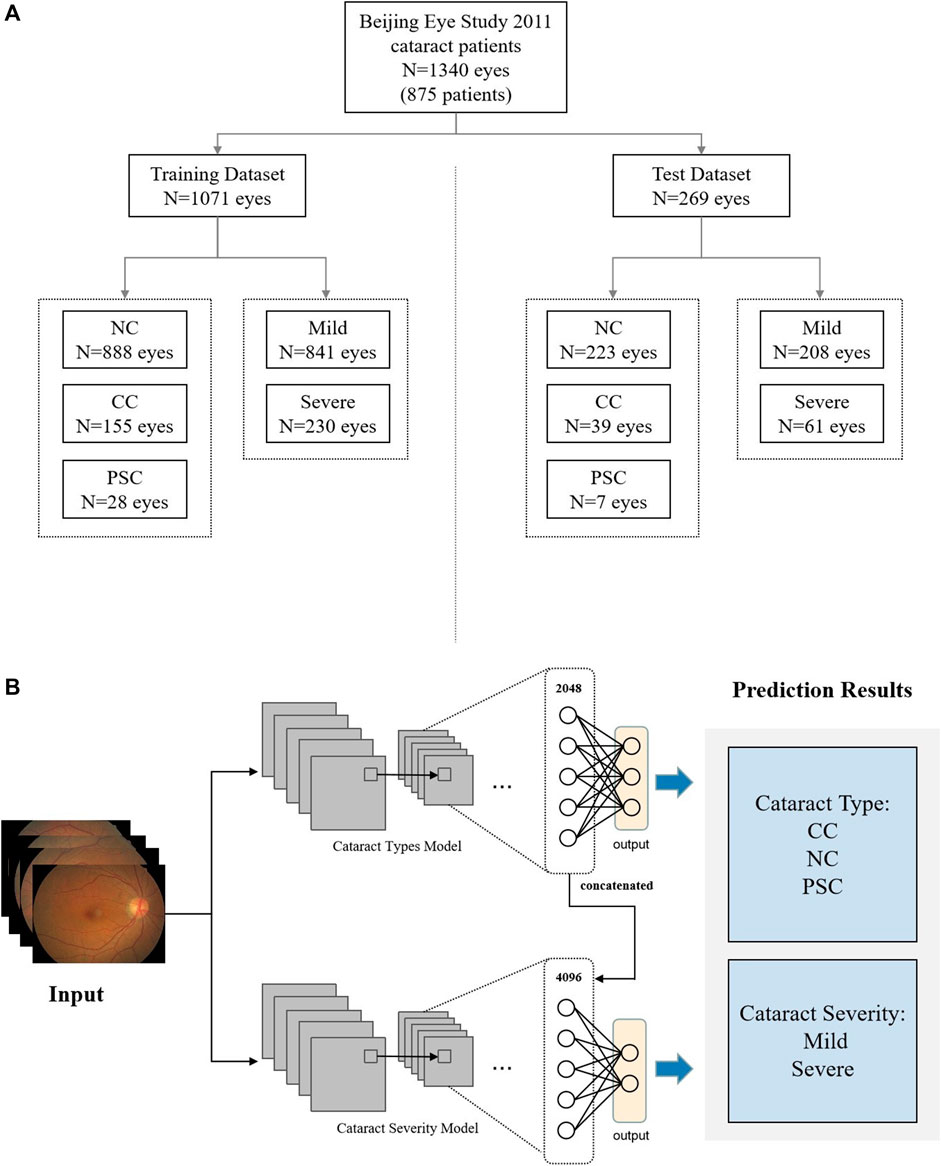
FIGURE 1. Workflow for data assignment and DCEN model. (A) Data management for training and test datasets. (B) Schematic of our DCEN model.

TABLE 1. Basic characteristics of the datasets.
In order to measure the overall performance of our method and comparable methods, we utilized the following metrics: accuracy (ACC), macro sensitivity (Sen), macro F1 score (F1), and kappa coefficient (Kappa). ACC, Sen, F1, and Kappa are the four primary evaluation measures used to quantify the quality of classification results. Kappa is a significant indicator for evaluating diagnostic reliability and is suitable for assessing the accuracy of models in situations where the classes are imbalanced. The aforementioned evaluation metrics are defined as follows:
PR represents precision, which refers to the proportion of true positive samples among the samples predicted as positive by the model. The term
Convolutional Neural Networks (CNNs) have demonstrated a remarkable ability to recognize and classify images. By using a convolution matrix instead of traditional nodes, they provide better understanding of color changes, edges, and contrast. In this study, we aim to explore whether deep learning models can accurately identify different types of cataracts through fundus images and characterize the distinct features of three cataract types.
For the cataract types classification task, we evaluated the performance of ResNet34, ResNet50, ResNet101 [23], AlexNet [24], VGG-16 [25], GoogLeNet [26], and DenseNet [27] on the Beijing Eye Study 2011 Dataset for classifying the three cataract types. The experimental results revealed that ResNet outperformed other neural networks significantly.
Moreover, we employed a combination of model visualization analysis, information entropy analysis of fundus blood vessels, and clinical knowledge to investigate the distinctive characteristics of cataracts in fundus images. These analyses enabled us to obtain robust and informative descriptions of the blurry features associated with different cataract types.
Inspired by this, in the task of identifying the severity of cataracts, we proposed a DCEN method that distinguish the severity of cataract based on feature fusion of the cataract classification model and the cataract grading model. We fused the feature vector of the type classification model with the severity classification model and used the type result as auxiliary signals to help the model distinguish the severity of cataract in a more targeted manner.
In the first task, it was found that the ResNet series baseline model has superior performance in identifying the degree of fundus blur. Based on ResNet50, we experimented the performance of different attention mechanisms, including Convolutional Block Attention Module (CBAM) [28], Bottleneck Attention Module (BAM) [29], and Squeeze-and-excitation Network (SENet) [30]. Attention mechanisms have been shown to significantly improve the performance of baseline models in various tasks. The basic idea behind attention is to allow the model to selectively focus on certain parts of the input, rather than treating all parts equally. This is achieved by assigning weights to different parts of the input, which are learned during training. By doing so, attention allows the model to effectively capture long-range dependencies and complex patterns in the input, which can be difficult for baseline models to do. Overall, attention mechanisms provide a powerful tool for improving the performance of baseline models, and have become a popular technique in modern machine learning.
The framework of our adopted DCEN is shown in Figure 1B. Two Resnet50 models were used to diagnose the cataract type and severity respectively. Using the diagnostic results of cataract type as auxiliary signals greatly improved the accuracy of severity assessment. During the training process, two ResNet50 backbone networks were trained in two stages: one for diagnosis of cataract type and the other for cataract severity diagnosis. After the diagnosis model of cataract type was trained, the 2048-dimensional features of each fundus image in the cataract type model inference results were concatenated in the cataract severity model to train the severity task. The results of cataract types classification and cataract severity gradation are presented in Tables 2, 3, respectively. We have adopted Focal Loss [31] as the loss function for all models. All of these experiments were developed and trained using PyTorch [32].
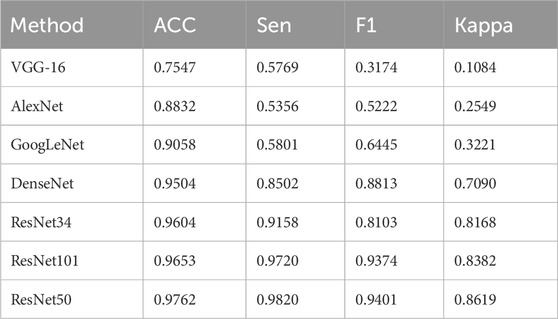
TABLE 2. Comparison results of cataract type classification (The best results are marked in bold).
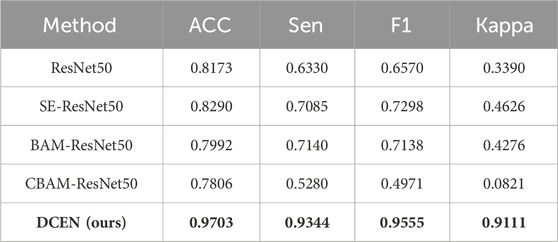
TABLE 3. Comparison results of cataract severity classification (The best results are marked in bold).
Gradient-weighted Class Activation Mapping (Grad-CAM) technique can produce visual explanations for CNN-based models and does not require any change to its architecture [33]. By using the gradients of target category flowing into different convolutional layers, we produced final class activation maps highlighting important regions in the fundus image. Perform a forward pass through the ResNet50 network to obtain the output feature map from the last convolutional layer. Since ResNet50 has 5 layers, first, we perform a forward operation to obtain the output after the last three layers, which we write as
where
where
As shown in Figure 2, we can upsize the heatmap to the same resolution as the input image, colorize the gray-scale heatmap and superimpose the colored heatmap onto the original image. Convert the normalized feature map into a heatmap, and overlay it onto the original image to visualize which regions of the input are most important for the given classification result. The heat map result tells us which part of the original input image contributes to helping the model make a particular classification decision. In this experiment, With the deepening of the network, the heat map changes. Based on the heat map and its changes, we can better understand how the system can classify cataract fundus images. On this basis, we summarize and verify the characteristics of different types of cataract fundus images.

FIGURE 2. Examples of NC, CC and PSC fundus images and their corresponding Grad-CAM heat maps in different layers. (A) NC fundus images, with the deepening of the network, the attention of the deep learning model gradually focuses on the extension of the optic disc to the temporal side. (B) CC fundus images, the heat map attention is eventually located at the inferior region of the fundus image and spreads toward the macula area. (C) PSC fundus images, where the heat map shows that the model’s attention is focused near the center of the macula. In each heat map, Red and yellow areas represent regions the model is positively influenced by when predicting cataract types. Red indicates a stronger contribution than yellow, and purple regions have little to no contribution towards the prediction.
To assess retinal vascular blur in fundus images, we followed the steps outlined below. First, we implemented Gaussian filtering to smooth out background noise in the fundus image. This step aimed to prevent misinterpretation of the background features as retinal blood vessels. We then captured different areas of the fundus image based on the three regions identified in our study. Finally, we computed the information entropy of the extracted image for statistical analysis.
The concept of information entropy characterizes the amount of information provided by a signal or image. Shannon [34] proposed it and is widely used to evaluate the degree of ambiguity in images. Since all our images were blood vessel samples from fundus images, the greater the image entropy, the clearer the blood vessel boundaries, which implies lower blurring degree of the fundus image at that location. Specifically, for grayscale images, we computed the image entropy using the formula below, where pi represents its proportion in the image when the grayscale value is i:
First, we experimented with the ability of different deep learning models to classify three different types of cataracts from fundus images. The experimental results are shown in Table 2. The experimental results indicate that ResNet34, ResNet50, and ResNet101 perform much better than four other deep learning models. The epochs, batch size, and learning rate indexes were 100, 16, and 0.0001, respectively.
Although a very good classification effect has been achieved in the ResNet series models, the fundus characteristics of the three types of cataracts are still unclear. To discover the difference between three types of cataracts in fundus images, we reconstructed the heat maps based on the ResNet50 classification system using the Grad-CAM technique [33]. Since ResNet50 structure has five stages. We obtained the layer 3, layer 4, and layer 5 heat map images from NC, CC, and PSC fundus images using the Grad-CAM after the activation feature map in stage 3, stage 4, and stage 5. Examples of applying Grad-CAM to three types of cataracts are shown in Figure 2. With the gradual deepening of the network, the interest areas of the system have changed.
NC type cataract denotes the gradual clouding of the central area of the lens and the progressive hardening of the lens nucleus. The overall trend of blurring spreads from the center of the lens to the periphery. As shown in the layer 3 heat maps, the system’s attention extends from the optic disc outward along the retinal vessels (Figure 2A). With the deepening of the network, the attention of the deep learning model gradually focuses on the extension of the optic disc near the temporal side. Grad-CAM heat maps obtained by CC in layer 3 focus on the inferior region of fundus images (Figure 2B). As the layer progresses, the heat map attention is eventually located at the inferior region of the fundus image and spreads toward the macula area. The PSC occurs at the back of the lens, just in front of the posterior capsule, usually on the visual axis (Figure 2C). As the model deepens, the heat map shows that the model’s attention is focused near the center of the macula.
Through the observation of fundus images, heat maps, and clinical characteristics of various types of cataracts, we have made the following inferences regarding the fundus features of cataracts:
1. The blurred area of NC spreads from the optic disc towards the temporal side in the fundus image.
2. The blurred area of CC extends from the inferior region towards the center of the fundus image.
3. The blurring of PSC occurs around the macula.
According to the heat maps of Figure 2, we define three different areas on the fundus image. The region near the temporal side of the optic disc is region 1, and the inferior region of the fundus image is region 2. The original size of fundus images is 512*512, and we set region 1 as 120*120 and region 2 as 512*120. Region 3 is a 150*150 image sample cut from the original fundus image with the macula as the center (Figure 3A). As inferred from this study, these three regions represent the blurred source locations of NC, CC, and PSC, respectively.
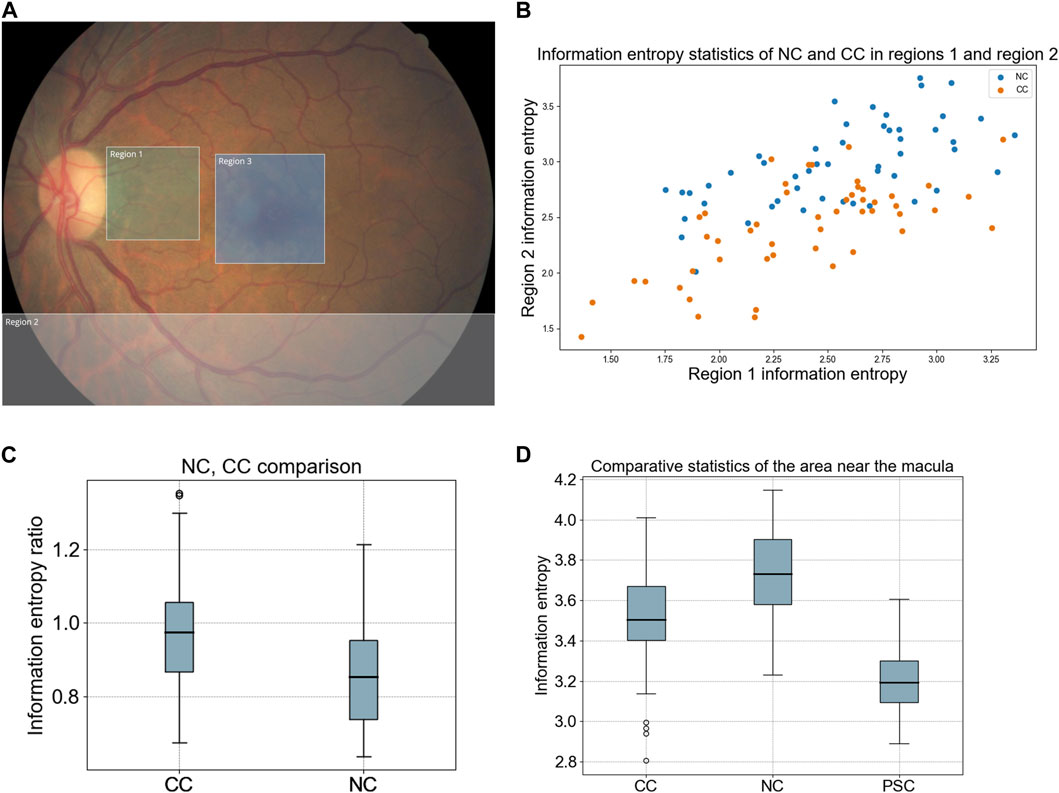
FIGURE 3. Information entropy statistics of three different regions of fundus images. (A) Example of fundus image region division. Region 1 represents the blur location of the NC, spreads from the optic disc to the temporal side in the fundus image. Region 2 represents the blur location of the CC, inferior region of the fundus image. Region 3 represents the blur location of the PSC, in the center of the macula. (B) Information entropy statistics of NC and CC vessel extractions in region 1 and region 2. (C) Divide the information entropy obtained by the blood vessel sample of region 1 by the information entropy of the blood vessel sample of region 2. This ratio was used to evaluate the blur relationship between two locations. (D) the statistical results of information entropy of three types of cataracts in region 3 represented by box plot.
Entropy is a scientific concept and measurable physical property that represents the level of uncertainty, disordered, or chaos. Here we use image entropy to evaluate the clarity of blood vessels in different areas of a fundus image. To evaluate the characteristics of NC and CC, we selected 50 NC images and 50 CC images. Three doctors randomly selected two blood vessel locations in region 1 and region 2 of the fundus images according to Figure 3A (LS, LD, CZ). For consistency purposes, doctors are required to select from the temporal inferior vein and the small veins extending from the optic disc to the macula in the designated area. After recording the coordinates, the original images were filtered using a Gaussian filter. Subsequently, we extracted 30 × 30 pixel images from the locations of blood vessels, which represented blood vessel samples from two distinct positions within the original fundus images. The statistical results of the blood vessel information entropy of regions 1 and 2 are shown in Figure 3B. As this scatter-plot shows, the information entropy of CC is lower than that of NC in two different areas, and this tendency is more pronounced in region 2.
A new index is obtained by dividing the information entropy of region 1 by the information entropy of region 2. The larger the index, the clearer the center of the fundus image and the blurrier, the inferior region. The information entropy ratio of the CC is significantly greater than that of the NC (Figure 3C). The blur trend of NC spreads from the optic disc to the temporal side, while the blur trend of CC spreads from the inferior region of the periphery to the center.
To evaluate this feature of PSC, we selected 50 NC samples with grade 4 and 50 CC samples with cortical opacity less than 50% and 15 PSC samples with posterior subcapsular opacity less than 10%. We perform Gaussian filtering on the original fundus image and then take a sample image of region 3. Then we calculate the information entropy of these sample images. The information entropy of the PSC sample is significantly lower than two other types of cataracts, which means that the number of observable vessels in region 3 of PSC are less than that of two other cataracts (Figure 3D). This result is in line with our deduction on the characteristics of the PSC fundus image.
Based on our research, we found that the blurry appearance of the fundus varies greatly due to different types of cataracts. In order to improve the accuracy of cataract severity diagnosis based on fundus images, we consider fusing the feature vectors from the classification model into a severity grading network, namely, DCEN, a Dual-Stream Cataract Evaluation Network. This is a method that utilizes a highly accurate cataract three-classification diagnostic model to achieve a binary-classification of cataract severity. The final result is able to output both the cataract type and the binary-classification of severity level. Its specific working mode is shown in Figure 1B. Firstly, we locked in the parameters of the diagnosis model of type and trained another ResNet50 model by connecting the diagnosis results with the severity model parameters. Since the classification network for cataract types based on ResNet50 achieves an accuracy of 0.9762 and an F1 value of 0.9401, we believe that this deep learning model effectively captures the fundus image features. We used the 2048 parameter output of each image in the trained model as an auxiliary signal to participate in the training of cataract severity. By utilizing auxiliary signals, the severity of different types of cataracts can be learned in a targeted manner.
As shown in Table 3, due to the distinct features of NC and CC in fundus images, ResNet alone, even when combined with different attention mechanisms, cannot effectively distinguish cataract severity. However, by using DCEN, which concatenates the final 2048-dimensional vector generated from the inference results of the cataract type model with the severity of cataract and then trains the severity model, can significantly improve the diagnostic accuracy of cataract severity. We achieved a 97.03% ACC, 93.44% Sen, 95.55% F1, and 91.11% Kappa. The comparison between DCEN and different attention mechanisms based on ResNet is shown in Figure 4. Please refer to the additional file for the ROC curves. Moreover, DCEN shows strong ability to recognize the severity of cataracts in both OS and OD fundus images. We have summarized the confusion matrix for cataract severity classification for OS and OD in the attached file. A highly accurate cataract type inference model can produce vector results that serve as an attention mechanism based on prior knowledge, enabling targeted evaluation of the severity of different types of cataract fundus images. Therefore, for a potential cataract fundus image, our model can not only diagnose its type tendency but also provide a clear distinction of its severity.

FIGURE 4. Comparison of confusion matrix results for cataract severity grading task across different models. (A) ResNet50 (B) BAM-ResNet50 (C) SE-ResNet50 (D) CBAM-ResNet50 (E) DCEN.
We report a DCEN model can achieve robust performance in cataract comprehensive evaluation from fundus images. The key findings of our study are as follows. Firstly, we achieved both high-precision cataract type classification and severity grading based on fundus images. Since different types of cataracts have different fundus manifestations, we use the results of type inference to assist in the assessment of severity, which greatly improves the accuracy of severity classification. And this severity grading is based on strict nuclear hardness ratings and cortical area blur ratios.
Furthermore, based on the Grad-CAM technique, we summarized the imaging features of three types of cataracts in the form of heat maps. We verified these difficult-to-detect features through information entropy statistics of the sample images. Although it has always been known clinically that the blurring trends of different cataracts are different, since these differences are too subtle on the fundus images, there has not been any research pointing out these differences. Our description and evaluation of blurred fundus images in cataracts offer excellent medical imaging explanations for the clinical characteristics of various types of cataracts.
Existing work on cataract grading based on fundus images uses machine learning or deep learning methods to assess the overall degree of blurring [35]. These works ignore the differences in the characteristics of different types of cataracts, and the severity standards are mostly based on the subjective judgment of doctors, without providing clear indicators.
Our study found that feature fusion for type classification is an effective method for cataract severity grading from fundus images, which is expected to become a standard approach for cataract assessment based on fundus images. This automatic cataract classification model provides a feasible technical solution for early detection of cataracts, which has the potential to provide more convenient cataract assessment in areas with insufficient medical resources in the face of a large population of cataracts.
Cataract patients may also suffer from other blinding eye diseases, so ophthalmologists have to diagnose them before surgery. The cloudy lens in cataract patients causes a hazy degeneration in the fundus image, making it difficult to observe the patient’s retinal vessels. Previous researchers have proposed different methods to enhance fundus images of cataract patients [36–41]. However, these works did not consider the fuzzy characteristics of different types and degrees of cataracts. There have been no studies that have found differences in blurry features of different types of cataracts on fundus images. Our study also contributes to inspiring research on enhancing fundus images in cataract patients by providing prior knowledge about the haze features of different types of cataracts.
This analysis has limitations and there are opportunities for future improvements. The three different types of cataracts used in this model are unevenly distributed in quantity. Although the model ultimately achieved high capabilities in assessing cataract status, richer data would lead to even better results. The feature differences of patient age, sex, and other factors may bias deep learning algorithms. Trapped by limited data volume, no deeper exploration has been conducted on this issue. Another limitation of our study is that all retinal fundus images were obtained using the same instrument, so further research is needed to investigate the differences in cataract characteristics under different instruments. Moreover, the retinal fundus images may have artifacts, and other lesions caused by eye diseases such as hemorrhage or drusen may also affect the effectiveness of the model. Further validation of the diagnostic ability of cataract types and severity using fundus images requires the collection of richer fundus image data, as well as extensive performance validation in multiple centers. We hope that further data collection can address these limitations.
We demonstrate a DCEN method for a cataract clinical assessment model based on fundus images and deep learning algorithms, which can simultaneously provide 97.62% accuracy of cataract type classification and 97.03% accuracy of cataract severity classification. Our method has exhibited promising results and has the potential to become a reliable technical solution for artificial intelligence-based cataract screening or preoperative evaluation in clinical applications.
The original contributions presented in the study are included in the article/Supplementary Material, further inquiries can be directed to the corresponding authors.
WG, LS, LD, CZ, and WW contributed to study conception. LS, LD, CZ, FL, and PQ collected the data; WG and LM designed and implemented the algorithm. WG carried out experimental work and conducted the model explanation analysis. WG, LS, FL, LD, ZD, WW, and LM analyzed the data. WG and LS wrote the manuscript. All authors contributed to the article and approved the submitted version.
This research is supported by the Shenzhen International Science and Technology Information Center and Shenzhen Bay Laboratory.
The authors declare that the research was conducted in the absence of any commercial or financial relationships that could be construed as a potential conflict of interest.
All claims expressed in this article are solely those of the authors and do not necessarily represent those of their affiliated organizations, or those of the publisher, the editors and the reviewers. Any product that may be evaluated in this article, or claim that may be made by its manufacturer, is not guaranteed or endorsed by the publisher.
The Supplementary Material for this article can be found online at: https://www.frontiersin.org/articles/10.3389/fphy.2023.1235856/full#supplementary-material
DCEN, Dual-Stream Cataract Evaluation Network; CC, cortical cataract; NC, nuclear cataract; PSC, posterior subcapsular cataract; CNN, Convolutional Neural Networks; CBAM, Convolutional Block Attention Module, BAM, Bottleneck Attention Module, SENet, Squeeze-and-excitation Network; Grad-CAM, Gradient-weighted Class Activation Mapping.
1. Steinmetz JD, Bourne RR, Briant PS, Flaxman SR, Taylor HR, Jonas JB, et al. Causes of blindness and vision impairment in 2020 and trends over 30 years, and prevalence of avoidable blindness in relation to VISION 2020: the Right to Sight: an analysis for the Global Burden of Disease Study. Lancet Glob Health (2021) 9(2):e144–e160. doi:10.1016/S2214-109X(20)30489-7
2. Asbell PA, Dualan I, Mindel J, Brocks D, Ahmad M, Epstein S. Age-related cataract. The Lancet (2005) 365(9459):599–609. doi:10.1016/S0140-6736(05)17911-2
3. Chew M, Chiang PPC, Zheng Y, Lavanya R, Wu R, Saw SM, et al. The impact of cataract, cataract types, and cataract grades on vision-specific functioning using Rasch analysis. Am J Ophthalmol (2012) 154(1):29–38. doi:10.1016/j.ajo.2012.01.033
4. Foster PJ, Wong TY, Machin D, Johnson GJ, Seah SKL. Risk factors for nuclear, cortical and posterior subcapsular cataracts in the Chinese population of Singapore: the Tanjong Pagar Survey. Br J Ophthalmol (2003) 87(9):1112–20. doi:10.1136/bjo.87.9.1112
5. Wong TY, Klein BEK, Klein R, Tomany SC. Relation of ocular trauma to cortical, nuclear, and posterior subcapsular cataracts: the Beaver Dam Eye Study. Br J Ophthalmol (2002) 86(2):152–5. doi:10.1136/bjo.86.2.152
6. Seddon J, Fong D, West SK, Valmadrid CT. Epidemiology of risk factors for age-related cataract. Surv Ophthalmol (1995) 39(4):323–34. doi:10.1016/S0039-6257(05)80110-9
7. Hodge WG, Whitcher JP, Satariano W. Risk factors for age-related cataracts. Epidemiologic Rev (1995) 17(2):336–46. doi:10.1093/oxfordjournals.epirev.a036197
8. Stifter E, Sacu S, Weghaupt H. Functional vision with cataracts of different morphologies: comparative study. J Cataract Refractive Surg (2004) 30(9):1883–91. doi:10.1016/j.jcrs.2004.01.038
9. Chylack LT, Wolfe JK, Singer DM, Leske MC, Bullimore MA, Bailey IL, et al. The lens opacities classification system III. Arch Ophthalmol (1993) 111(6):831–6. doi:10.1001/archopht.1993.01090060119035
10. Klein BEK, Klein R, Linton KLP, Magli YL, Neider MW. Assessment of cataracts from photographs in the beaver dam eye study. Ophthalmology (1990) 97(11):1428–33. doi:10.1016/S0161-6420(90)32391-6
11. Age-Related Eye Disease Study Research Group. The Age-Related Eye Disease Study (AREDS) system for classifying cataracts from photographs: AREDS report no. 4. Am J Ophthalmol (2001) 131(2):167–75. doi:10.1016/S0002-9394(00)00732-7
12. Fan S, Dyer CR, Hubbard L, Klein B. An automatic system for classification of nuclear sclerosis from slit-lamp photographs. In: Medical Image Computing and Computer-Assisted Intervention-MICCAI 2003: 6th International Conference; November, 2003; Montréal, Canada. Springer Berlin Heidelberg (2003). p. 592–601.
13. Sparrow JM, Bron AJ, Brown NAP, Ayliffe W, Hill AR. The Oxford clinical cataract classification and grading system. Int Ophthalmol (1986) 9:207–25. doi:10.1007/BF00137534
14. Hall AB, Thompson JR, Deane JS, Rosenthal AR. LOCS III versus the Oxford Clinical Cataract Classification and Grading System for the assessment of nuclear, cortical and posterior subcapsular cataract. Ophthalmic Epidemiol (1997) 4(4):179–94. doi:10.3109/09286589709059192
15. Xu L, Yang CW, Yang H, Wang S, Shi Y, Song XD. The study of predicting the visual acuity after phacoemulsification according to the blur level of fundus photography. Ophthalmol China (2010) 19(2):81–3.
16. Yang JJ, Li J, Shen R, Zeng Y, He J, Bi J, et al. Exploiting ensemble learning for automatic cataract detection and grading. Comp Methods Programs Biomed (2016) 124:45–57. doi:10.1016/j.cmpb.2015.10.007
17. Xu X, Zhang L, Li J, Guan Y, Zhang L. A hybrid global-local representation CNN model for automatic cataract grading. IEEE J Biomed Health Inform (2019) 24(2):556–67. doi:10.1109/JBHI.2019.2914690
18. Pratap T, Kokil P. Computer-aided diagnosis of cataract using deep transfer learning. Biomed Signal Process Control (2019) 53:101533. doi:10.1016/j.bspc.2019.04.010
19. Li H, Ko L, Lim JH, Liu J, Wong DWK, Wong TY. (2008). Image based diagnosis of cortical cataract, 2008 30th Annual International Conference of the IEEE Engineering in Medicine and Biology Society, Vancouver, BC, Canada, August, 2008.
20. Li H, Lim JH, Liu J, Wong DWK, Foo Y, Sun Y, et al. Automatic detection of posterior subcapsular cataract opacity for cataract screening. In: 2010 Annual International Conference of the IEEE Engineering in Medicine and Biology; August, 2010; Buenos Aires, Argentina. IEEE (2010). p. 5359–62.
21. Zhang W, Li H. Lens opacity detection for serious posterior subcapsular cataract. Med Biol Eng Comput (2017) 55:769–79. doi:10.1007/s11517-016-1554-1
22. Zhang JS, Xu L, Wang YX, You QS, Da Wang J, Jonas JB. Five-year incidence of age-related cataract and cataract surgery in the adult population of greater Beijing: the Beijing Eye Study. Ophthalmology (2011) 118(4):711–8. doi:10.1016/j.ophtha.2010.08.021
23. He K, Zhang X, Ren S, Sun J. Deep residual learning for image recognition. In: Proceedings of the IEEE conference on computer vision and pattern recognition; June, 2016; Las Vegas, NV, USA (2016). p. 770–8.
24. Krizhevsky A, Sutskever I, Hinton GE. ImageNet classification with deep convolutional neural networks. Commun ACM (2017) 60(6):84–90. doi:10.1145/3065386
25. Simonyan K, Zisserman A. Very deep convolutional networks for large-scale image recognition (2014). https://arxiv.org/abs/1409.1556 (Accessed on June 13, 2021).
26. Szegedy C, Liu W, Jia Y. Going deeper with convolutions. In: 2015 IEEE Conference on Computer Vision and Pattern Recognition (CVPR); June, 2015; Boston. MA, USA (2015).
27. Huang G, Liu Z, Van Der Maaten L, Weinberger KQ. Densely connected convolutional networks. In: Proceedings of the IEEE conference on computer vision and pattern recognition; July, 2017; Honolulu, HI, USA (2017). p. 4700–8.
28. Woo S, Park J, Lee JY, Kweon IS. Cam: convolutional block attention module. In: Proceedings of the European conference on computer vision (ECCV); September, 2018; Munich, Germany (2018). p. 3–19.
29. Park J, Woo S, Lee JY, Kweon IS. Bam: Bottleneck attention module (2018). https://arxiv.org/abs/1807.06514 (Accessed on June 13, 2021).
30. Hu J, Shen L, Sun G. Squeeze-and-excitation networks. In: Proceedings of the IEEE conference on computer vision and pattern recognition; June, 2018; Salt Lake City, UT, USA (2018). p. 7132–41.
31. Lin TY, Goyal P, Girshick R, He K, Dollár P. Focal loss for dense object detection. In: Proceedings of the IEEE international conference on computer vision; October, 2017; Venice, Italy (2017). p. 2980–8.
32. Paszke A, Gross S, Massa F, Lerer A, Bradbury J, Chanan G, et al. Pytorch: an imperative style, high-performance deep learning library. Adv Neural Inf Process Syst (2019) 32 (Accessed on May 1, 2020). doi:10.48550/arXiv.1912.01703
33. Selvaraju RR, Cogswell M, Das A, Vedantam R, Parikh D, Batra D. Grad-cam: visual explanations from deep networks via gradient-based localization. In: Proceedings of the IEEE international conference on computer vision; October, 2017; Venice, Italy (2017). p. 618–26.
34. Warren W, Shannon CE. The mathematical theory of communication. Urbana: University of Illinois Press (1963).
35. Zhang XQ, Hu Y, Xiao ZJ, Fang JS, Higashita R, Liu J. Machine learning for cataract classification/grading on ophthalmic imaging modalities: a survey. Machine Intelligence Res (2022) 19(3):184–208. doi:10.1007/s11633-022-1329-0
36. Peli E, Peli T. Restoration of retinal images obtained through cataracts. IEEE Trans Med Imaging (1989) 8(4):401–6. doi:10.1109/42.41493
37. Qiu D, Cheng Y, Wang X. End-to-end residual attention mechanism for cataractous retinal image dehazing. Comp Methods Programs Biomed (2022) 219:106779. doi:10.1016/j.cmpb.2022.106779
38. Li H, Liu H, Hu Y, Fu H, Zhao Y, Miao H, et al. An annotation-free restoration network for cataractous fundus images. IEEE Trans Med Imaging (2022) 41(7):1699–710. doi:10.1109/TMI.2022.3147854
39. Li H, Liu H, Hu Y, Higashita R, Zhao Y, Qi H, et al. Restoration of cataract fundus images via unsupervised domain adaptation. In: 2021 IEEE 18th International Symposium on Biomedical Imaging (ISBI); April, 2021; Nice, France. IEEE (2021). p. 516–20.
40. Liu H, Li H, Ou M, Zhao Y, Qi H, Hu Y, et al. Domain generalization in restoration of cataract fundus images via high-frequency components. In: 2022 IEEE 19th International Symposium on Biomedical Imaging (ISBI); March, 2022; Kolkata, India. IEEE (2022). p. 1–5.
Keywords: artifcial intelligence, cataract, cataract screening, fundus image, cortical cataract, nuclear cataract, posterior subcapsular cataract
Citation: Gao W, Shao L, Li F, Dong L, Zhang C, Deng Z, Qin P, Wei W and Ma L (2024) Fundus photograph-based cataract evaluation network using deep learning. Front. Phys. 11:1235856. doi: 10.3389/fphy.2023.1235856
Received: 13 June 2023; Accepted: 26 December 2023;
Published: 09 January 2024.
Edited by:
Roy Clarke, University of Michigan, United StatesReviewed by:
Tae Keun Yoo, B&VIIT Eye center, Republic of KoreaCopyright © 2024 Gao, Shao, Li, Dong, Zhang, Deng, Qin, Wei and Ma. This is an open-access article distributed under the terms of the Creative Commons Attribution License (CC BY). The use, distribution or reproduction in other forums is permitted, provided the original author(s) and the copyright owner(s) are credited and that the original publication in this journal is cited, in accordance with accepted academic practice. No use, distribution or reproduction is permitted which does not comply with these terms.
*Correspondence: Lan Ma, bWFsYW5Ac3oudHNpbmdodWEuZWR1LmNu; Wenbin Wei, d2Vpd2VuYmludHJAMTYzLmNvbQ==
†These authors have contributed equally to this work
‡These authors jointly supervised this work
Disclaimer: All claims expressed in this article are solely those of the authors and do not necessarily represent those of their affiliated organizations, or those of the publisher, the editors and the reviewers. Any product that may be evaluated in this article or claim that may be made by its manufacturer is not guaranteed or endorsed by the publisher.
Research integrity at Frontiers
Learn more about the work of our research integrity team to safeguard the quality of each article we publish.