 Hannah Ulrich
 Sophie Sigl3
- 1Fakultät für Luft- und Raumfahrttechnik, Institut für Thermodynamik, Universität der Bundeswehr München (UniBw M), Neubiberg, Germany
- 2Erlangen Graduate School in Advanced Optical Technologies (SAOT), Friedrich-Alexander-Universität Erlangen-Nürnberg (FAU), Erlangen, Germany
- 3Lehrstuhl für Technische Thermodynamik (LTT), Friedrich-Alexander-Universität Erlangen-Nürnberg (FAU), Erlangen, Germany
- 4Department of Physics, Faculty of Engineering, Lund University, Lund, Sweden
In this work two-color laser-induced fluorescence (2c-LIF) is applied to calibrate and measure the temperature in a micrometric monodisperse ethanol droplet chain. A dye mixture of fluorescein disodium (FL) and sulforhodamine 101 (SRh) is used, in order to form a sensitive signal ratio of one temperature dependent and one independent fluorophore. Spectral and planar fluorescence detection via a fiber-coupled spectrometer and a camera system, consisting of two sCMOS cameras, is set up around the droplet chain. Additionally, absorption measurements of the dye mixture in ethanol are conducted using a photo-spectrometer to analyze the temperature sensitivity of the dyes as well as potential re-absorption and fluorescence cross-talk effects. The spectral setup allowed an investigation of the wavelength range in which morphology dependent resonances (MDR) occur at the phase boundary of the droplet. Thus, the optical filters, determining the color channels in the camera system, are chosen to avoid detection of the lasing signal and providing maximal temperature sensitivity at the same time. The calibrated signal ratios are applied in temperature measurements of evaporating heated droplets in the droplet chain, showing the cooling with larger distance from the nozzle.
1 Introduction
Liquid phase and especially droplet thermometry are essential for the development of various industrial and technical spraying applications like spray drying, spray cooling or liquid fuel injection in internal combustion (IC) engines, rockets or burners [1, 2]. In the last decades several approaches were introduced to measure the temperature in the liquid phase of sprays or droplets [3–6], one of which is 2c-LIF thermometry [7, 8]. The concept is based on the Boltzmann distribution of a fluorescent dye molecule. In the absorbing as well as excited state, the respective population shows a specific temperature dependency. This effect is used to form a temperature dependent signal ratio of two wavelength areas, which are recorded by two detectors and respective filters (referred to as “color channels”). Based on their research on concentration studies via LIF, Lemoine et al. [9, 10] applied the 2c-LIF technique to measure the temperature in a turbulent water jet. Therefore, a fiber coupled detection system with two photo multiplier tubes (PMTs) was set up around a water jet doped with rhodamine B (RhB) as fluorescent dye. The same detection system was used by Perrin et al. [11] in a droplet stream injected into a heated environment. The applicability of the dye pyrromethene 597-C8 (Pyr) as fluorescent dye is tested in various fuels. However, for this dye lasing effects (or morphology-dependent resonances, MDR), which occur at the phase boundary inside the droplets due to their spherical shape, are very distinct. One approach to circumvent the detection of this adverse signal is the admixture of an additional light absorber to the dye/solvent mixture, for example, Oil Blue N (OBN). Based on these measurements, Palmer et al. [12, 13] continued the research of the two-dye mixture in an n-dodecane droplet stream. The concept of enhanced energy transfer (EET) onto an absorber dye was approved and investigated in a spray. Using a pulsed laser and an electron-multiplying charge-coupled device (EMCCD), the detection of spatially resolved droplets could be conducted. In a range from 300 K to 340 K the ratio change with temperature shows linear behaviour and a temperature sensitivity of 0.29%/K could be obtained [14]. However, the fluorescence of Pyr is also drastically reduced by the absorber and other dye concepts and methods to reduce MDRs need to be analysed. Natrajan et al. [15] proposed a dye mixture of temperature-sensitive RhB and temperature-insensitive sulforhodamine 101 (SRh) and calibrated the signal ratio with two CCD cameras detecting the signal of a heated microfluidic device. The RhB–SRh dye combination in ethanol and water showed temperature sensitivities of 1.5 %/K and 2.7 %/K, respectively. To get and share further insight into the variety of fluorescent dyes for thermometry, several authors published overviews of various fluorescent dyes in different solvents [16–18]. Accordingly, Prenting et al. [16] suggest the use of a single dye coumarin 152 for measurements in an ethanol SpraySyn flame. Except for two coumarin derivates (152 and 153) none of the other dyes (such as RhB, Rh101, Pyr, DCM, etc.) exhibited a higher ratio change than 1.0%/K in cuvette measurements. 2c-LIF was successfully applied to measure averaged temperature field images in the SpraySyn flame. Other auspicious dyes in polar and non-polar liquids for thermometry are, for example, Eosin-Y with a sensitivity of 1.6%/K in water (2.0%/K in glycol) and Nile red (for non-polar heat transfer oils such as Marlotherm LH with a sensitivity of 4.2%/K), both measured in a tempered cuvette [19]. However, both dyes showed MDRs in the LIF signal in droplet sizing experiments based on the LIF/Mie ratio [20–22].
The dye mixture of fluorescein disodium (FL) and sulforhodamine 101 (SRh) is promising for polar liquids. It was first proposed by Chaze et al. [23] and successfully applied for temperature measurements in impinging 2.5 mm-sized water droplets on a heated surface. The detection of the FL color band is only recommended above 540 nm, avoiding the detection of the spectral region in which self-absorption of FL occurs. This way a temperature sensitivity of 2.7%/K could be achieved. Mishra et al. [17] attained a sensitivity of 2.4%/K calculated from the single dye spectra detected in a cuvette with ethanol as a solvent. However, this 2-dye concept was not utilized in micrometric ethanol droplets before, which is the aim of the present paper. Ethanol is an important solvent for many pharmaceutical or process engineering systems and it is also an important fuel component. Its atomization and evaporation behaviour and its liquid temperature under various injection conditions must be studied, e.g., by using optical techniques. For this purpose, the dye concentration of this two-dye 2c-PLIF concept must be adjusted. Reabsorption as well as signal crosstalk is studied in a spectral characterization of absorption and fluorescence of the dye couple. Still, the challenge of MDR needs to be addressed. After identification of spectral positions of MDRs, filter regions for two-colour LIF can be identified in order to achieve a maximal temperature sensitivity and reducing effects of re-absorption and dye concentration on the signal ratio. Afterwards, a planar LIF setup is utilized for calibration of the signal ratio in a wide temperature range of the micrometric droplets. Finally, the droplet temperature is measured using 2c-PLIF in evaporating ethanol droplets downstream the nozzle of a droplet generator.
2 Materials and methods
The following section covers fundamentals on LIF and explains the benefit of the two-color approach. Furthermore, the experimental setup and the implementation are described.
2.1 Theory of 2c-LIF
The 2c-LIF technique is based on the simultaneous detection and ratio formation of two differently temperature dependent fluorescence signals in a spectrum. Therewith, the contribution of several influencing factors on the signal can be eliminated for the temperature determination. Fundamentals are only briefly addressed in this work, as several works report a detailed derivation of the intensity equations relevant for 2c-LIF, see, e.g., Lemoine et al. [10] and Lavieille et al. [10, 24]. Accordingly, the fluorescence signal intensity Ifl/W/m2 after the absorption of laser photons can be expressed with
while β/K and Kspec/mol-1 are constants describing the physical and fluorescent properties of the respective dye in a two-dye concept. Kspec relates to the molar absorption coefficient ε and the fluorescence quantum yield (FQY) [11]. In this formulation of the LIF working equation, the temperature dependence of the quantities β
The exponential part of the equation results from the Arrhenius approach, including the influence of the absorption cross section and the quenching rate on the temperature dependence. β is the wavelength dependent temperature sensitivity factor, which expresses the signal change per unit kelvin [10]. The equation contains another constant Kopt
The 2c-LIF approach uses a ratio Rfl of two signal intensities, which is derived from two selected wavelength bands in the fluorescence spectrum of the dye. Therefore, the dependence on the laser intensity, the sample volume and the molecular dye concentration can be eliminated from the ratio equation:
To further cancel out the system dependencies K, the ratio is normalized to a reference operating point at a known temperature.
2.2 Experimental setup
A V-750 UV/VIS-spectrophotometer (Jasco) is used for investigations of the absorption behavior of the dissolved dye mixtures. The calculation of the absorbance from the measured transmittance T values can be expressed via Lambert Beer’s law:
A closable Hellma quartz cuvette (10 mm optical path) containing the sample is tempered in the cuvette holder and a transmission measurement is conducted. When measuring in the cuvette, the optical path length is relatively large compared to the droplet diameter in the emission measurements. This means that a large dye concentration is required for the droplet fluorescence measurements in order to achieve a sufficiently high signal to noise ratio (SNR). Therefore, solutions with deviating dye concentrations are prepared for absorption (cuvette) and emission (droplet) investigations as specified below. As solvent, absolute ethanol (EMSURE, purity >99.9%) is used and dosed with 10 mg/L FL (CAS: 518-47-8) and 1 mg/L SRh (CAS: 60311-02-6), investigating the absorption behaviour. Additionally, in order to clarify the influence of the dye admixture on the physical properties of the solvents, measurements of density, surface tension and dynamic viscosity were conducted, see.
Table 1 These properties are essential for the droplet formation in sprays and changes with dye addition would make the spray investigations redundant. Three different mixtures (pure ethanol, ethanol dosed with FL and ethanol dosed with FL and SRh) are tested and only a slight increase in viscosity (i.e., a difference of 0.038 mPas) could be detected when the dyes are added. All measurements were conducted at 293 K. Density and dynamic viscosity determination is performed with a Stabinger viscometer (SVM 3001, Anton Paar) after ASTM D 7042:2021 and the detection of the surface tension after DIN EN 14370:2004.
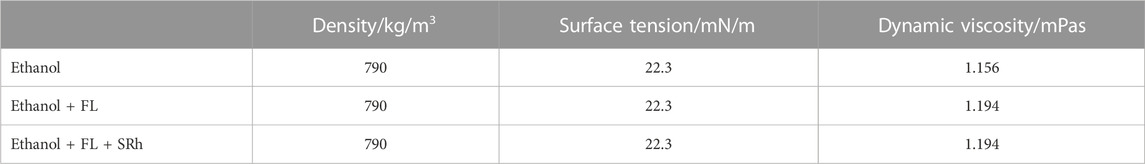
TABLE 1. Fluid properties of ethanol and the mixtures with fluorescein disodium and additional admixture of sulforhodamine 101.
Figure 1 shows the experimental fluorescence emission measurement setup. A pulsed Nd:YAG laser (Q-SMART, Quantel) is operated at 532 nm with a fluence of 2.7 mJ/cm2, ensuring measurements within the linear LIF signal intensity regime. The expanded, collimated laser beam passes the monodisperse droplet chain, generated by a tempered droplet generator (FMAG 1520, TSI). The FMAG is dosed with the dye-solvent mixture by a syringe pump and additional tempered focussing air, forming 100 µm sized droplets (for most of the studies, smallest droplet sizes are around 20 µm depending on the investigated liquid). The droplet size is determined by previously calibrating the resolution with a multi-frequency grid distortion target (Thorlabs, R1L3S3P) in the focal plane. Two recirculating chillers (for the liquid and air flow) regulate the mixture to temperatures between 283 K and 343 K, while the maximal temperature range is limited by the boiling point of the solvents. Deviating to the absorption measurements, a dye concentration of 750 mg/L FL and 75 mg/L SRh is applied in the droplet chain. These higher dye concentrations are necessary for sufficiently high LIF signals of the micrometric droplets. Preliminary measurements were performed to find an optimum in the mixture ratio of both dyes regarding reabsorption between the molecules and a similar high emission signal.
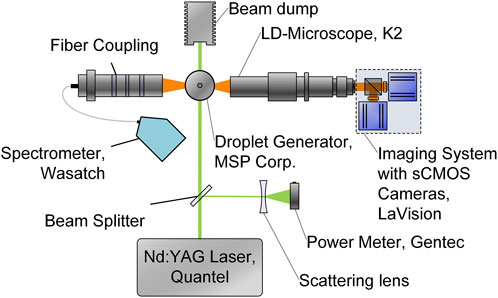
FIGURE 1. Optical setup with spatial and spectral detection of the fluorescence emission around a tempered monodisperse droplet chain.
At 90° detection angle a long-distance microscope (Infinity K2 DistaMax) is mounted to an imaging system which includes two sCMOS cameras (Imager, LaVision), resulting in a resolution of 3.25 pixel/µm. This system includes a dichroic mirror to split the signal into two wavelength ranges. Both parts of the signal pass through a specific band-pass filter (554/23 BrightLine HC and 615/24 BrightLine HC), only allowing a detection of the shaded color bands as indicated in Figure 4 (the filter selection is discussed below in detail). For the imaging measurements, 2,000 pictures were recorded at a frame rate of 10 Hz and repeated on three different days. Every image contains two or three droplets of the droplet chain, leading to a total of several thousand droplets per operating point. On the opposite side of the droplet generator, a fiber-coupled spectrometer (WP-VIS-A-S-50, Wasatch Photonics) is mounted. Preceding the optical fiber, the optical system consists of two achromatic doublets and a notch filter, ensuring the screening out of the excitation wavelength. Each measurement is integrated for 50 ms and 100 single spectra are averaged. This procedure is conducted ten times on three different days, leading to a total of 3,000 spectra.
In the imaging setup, the signal is split by a dichroic mirror and further detected by two cameras. In the post-processing of the calibration data, one image is mapped onto the other via a transformation matrix and a warping algorithm. Using a binarization, the edges and thus the droplets in the pictures are detected and further evaluated. Single droplets are selected as “useful” or are otherwise not considered, according to their size and deformation. Only droplets close to 100 µm with no perceptible deformation are considered for calibration measurements (although thermometry is also possible in non-spherical structures, see below). The measurement location is about 5 mm below the nozzle exit at which spherical droplets are formed (the downstream distance depends on the temperature, determining, e.g., the surface tension and liquid viscosity and thus the droplet stability). For calibration measurements the droplet temperature is assumed to be the same as the adjusted temperature of the droplet generator and corrected afterwards, see Section 3.3.
With these specifications, a minimum of 12,500 droplets is taken into account for further evaluation. The integrated LIF-signal of the droplet is strongest in its center. This is because of the maximum depth in z-direction of the droplet and since the whole droplet is illuminated by the laser beam (beam diameter of 8 mm). A circular region of interest (ROI) is determined for evaluation, excluding the droplet rim. In this outer area the lowest SNR is achieved, which leads to the highest temperature variations as also shown by Palmer et al. [14]. In this ROI, the signal is spatially averaged for both channels and a signal ratio is calculated for the single images. Afterwards the single signal ratios are averaged for determination of the temperature dependent calibration curve.
3 Results and discussion
The next section shows all results ranging from MDR studies and the filter selection to calibration data. Finally, an evaporation study downstream the droplet generator is conducted to apply the measurement technique.
3.1 Preliminary studies on MDR effects and their circumvention
When measuring in spherical droplets, lasing effects may occur due to internal total reflections on the droplet/air phase boundary. These amplified emission signals are also known as whispering gallery modes (WGM) or MDR. Different refractive indices between the liquid in the droplet and the ambient air lead to a high total internal reflection (TIR) angle, which can be determined to be 47.2° for ethanol/air after Snell’s law. The combination of the TIR angle and the spherical shape lead to the droplet acting as an optical cavity with resonating light circulating along the internal rim.
The resonance wavelengths and the respective emission linewidths are affected by the morphology of the scattering media. This includes the droplet size and its shape, as well as the refractive index of the solvent [26]. In a previous work based on the dye nile red in ethanol/isooctane mixtures, the lasing peak was a function of the ethanol concentration. The peak position was red-shifted with larger ethanol amount and pure ethanol showed the lowest MDR peak [20]. Larger droplet sizes exhibited more distinct MDRs in the LIF signal in accordance with the theory [21]. Consequently, MDR can be useful, e.g., for the determination of droplet properties such as the diameter [27, 28]. For 2c-LIF thermometry, MDR pose a major signal influence and disturb the signal ratio approach if detected in one of the color channels. One proposal to circumvent the detection of MDR effects is the addition of an absorber molecule, which does not emit fluorescence itself (e.g., OBN as an absorber for Pyr lasing, as mentioned in the introduction) [11]. Another possibility is to use ‘controlled color switching’ (of the MDR) to another wavelength outside of the color channels [27]. Both options are based on an effective energy transfer between the dye molecules.
The subsequent investigation serves for analysis of MDR effects for the individual dyes and the dye combination in ethanol. The fluorescence spectra of the single dyes FL and SRh, as well as a mixture in ethanol droplets at ambient temperature are shown in Figure 2. The FL spectrum shows a gap from the 532 nm notch filter applied and a MDR peak at 571 nm. SRh indicates an emission maximum at 593 nm with a lasing maximum at 648 nm. A reduction of the signal at the FL peak with simultaneous increase of the SRh peak is observed in the mixture. This can be explained by reabsorption of the FL emission by SRh molecules.
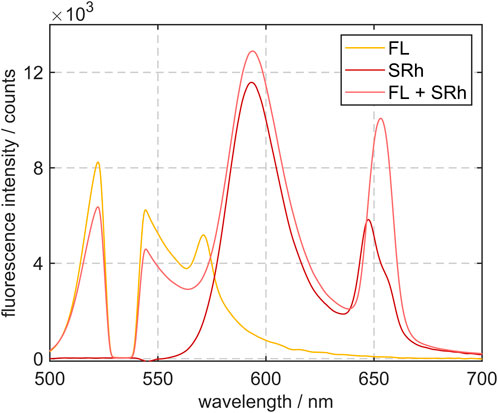
FIGURE 2. Fluorescence emission spectra of 100 μm sized ethanol droplets with addition of the dye FL (750 mg/L), SRh (75 mg/L) and a dye mixture of both FL and SRh. The missing signal around 532 nm is due to the notch filter.
Due to the high molecular weight of both dyes, the mixture ratio of the dyes is assured in case of evaporation of ethanol. Both dyes remain in the droplet leading to a dye enrichment and a fluorescence signal increase. However, this will hardly affect the signal ratio, when the filters are chosen accordingly and as long as no concentration quenching of the LIF signal occurs. In addition to the signal reabsorption, the MDR peak in the FL spectrum is absorbed by SRh in the mixture. Instead the MDR signal of the dye mixture shows a peak at 652 nm, which means at higher wavelengths than the MDR peak of the solely studied dye SRh. Consequently, the optical filters are chosen outside of this wavelength area, as specified above.
Supplementary measurements have been performed in the possible droplet diameter range of the droplet generator to ensure that for a diameter variation no additional MDR modes are detected. Tang et al. [29] stated that the number of lasing modes could be increased in the case of larger droplets in comparison to smaller droplets. For the present solutions with the single dyes FL and SRh, spectra in droplets from 60 µm up to 120 µm have been recorded and are shown in Figure 3. In general, no clear droplet-size dependence of the average MDR peak position could be observed. However, the MDR peak rises relatively to the main fluorescence peak of SRh for smaller droplets. A deviation from this pattern can be observed for 100 µm sized ethanol droplets dosed with SRh, showing a higher MDR peak than the 120 µm sized droplets. This deviation could be explained by a correlation of the spectral position of the MDR and the droplet size, resulting in intensity variations of the lasing signal. Koegl et al. [21] presented similar findings of certain droplet sizes showing larger MDR in the LIF signal images.
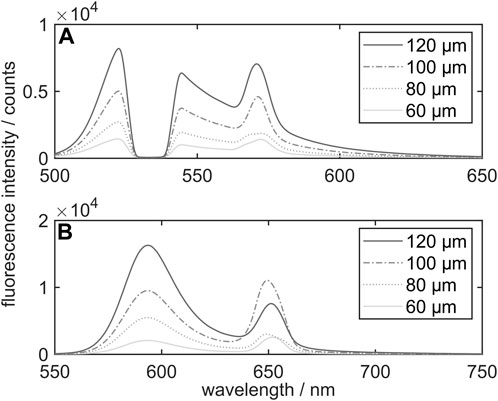
FIGURE 3. Fluorescence emission spectra (including MDR) of ethanol droplets with addition of the dye FL (750 mg/L (A)) and SRh (75 mg/L (B)) at droplet sizes ranging from 60 μm to 120 μm.
3.2 Filter selection
The 2c-LIF approach is based on the ratio of two intensity signals, each originating from a respective color channel in the fluorescence spectrum. These color channels can cover two differently sensitive segments of one single dyes’ emission spectrum. Therefore, using only one dye, it may be difficult to reach a high temperature dependence of the signal ratio. Furthermore, the ‘blue’ part of the spectrum may be affected by re-absorption effects and a varying dye concentration intensifies this problem. Palmer et al. [14] successfully performed micrometric droplets measurements in a heated surrounding with only Pyr as fluorophore. To avoid MDR effects, OBN was added, which contributes to the spectrum without fluorescence emission but by absorption of the emitted photons of Pyr. A temperature sensitivity of 0.29%/K could be reached in this application. In order to raise the sensitivity, a two-dye approach using two different dyes with contrary temperature dependent emission behaviors may be promising. In general, two-dye 2c-LIF concepts for increased sensitivity were proposed by Sakakibara et al. [30] and were recommended in several works [15, 30, 31]. Thus, each color channel covers one emission spectrum of the two opposed temperature dependent fluorescence signals.
Figure 4 shows both, the absorption and fluorescence emission spectra of the single dyes used in this work. Absorption measurements were carried out in a cuvette, while the emission spectra were detected in droplets and thus, show MDR peaks. Shaded color bands describe the two intensity color channels representing the selected optical filters. The “blue” channel (at lower wavelengths) equals the transmission curve of the Semrock 554/23 BrightLine HC filter and covers wavelengths from 543 nm to 566 nm. In this wavelength segment the detected emission signal originates mostly from FL molecules. Absorption by SRh is relatively strong in this color channel and reduces the fluorescence signal, which however is the fundamental for color switching (red-shifting) of the MDR peak. The ‘red’ channel corresponds to the transmission of the Semrock 615/24 BrightLine HC filter between 603 nm and 627 nm. Reabsorption of SRh-fluorescence plays only a minor role in this wavelength region and the emission is dominated by SRh. Ultimately, both filters were chosen so that fluorescence crosstalk and self-absorption can be neglected in these wavelength areas.
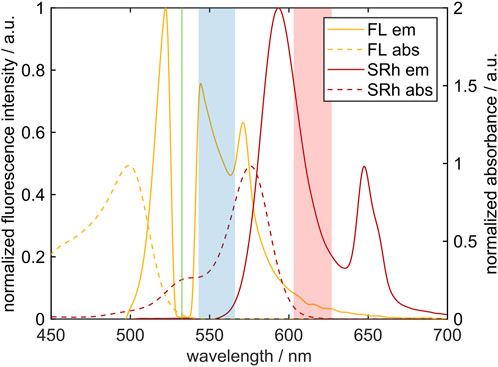
FIGURE 4. Absorption spectra (dashed line) measured in a cuvette and fluorescence emission spectra (solid line) measured in the droplet chain of both single dyes FL and SRh in ethanol. The color channels of the selected optical filters are depicted as shaded rectangles. The Nd:YAG laser line for excitation of both dyes is marked in green at 532 nm. Please note that the y-axis of the absorption spectra is extended to 2 for better visualization.
3.3 Calibration data
The results of the absorption measurements from 283 K to 343 K and the excitation wavelength of the laser at 532 nm are depicted in Figure 5. Two major peaks at λ ≈ 500 nm and 550 nm can be observed. The first one at shorter wavelengths is due to the absorption of FL and this maximum is significantly higher than the second peak, which is attributed to absorption of SRh. This difference in absorption is partly due to the mixture composition of 10:1 (FL:SRh). At higher temperatures, the FL absorption peak increases whereas the SRh peak only shows a slight blue shift. The very small and additionally negative temperature dependence and the superimposition with the increased FL band lead to this shift. A similar trend with a higher temperature increase for FL is consequently expected for the fluorescence of both dyes.
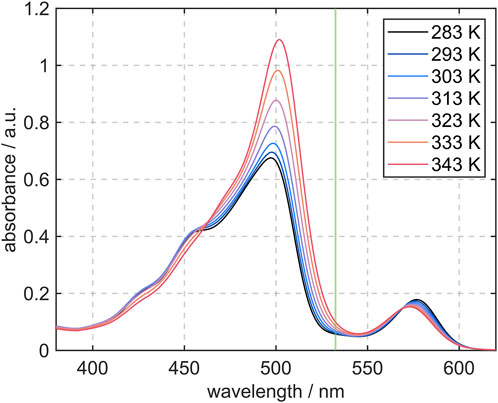
FIGURE 5. Absorption spectra of the dye mixture (10 mg/L FL and 1 mg/L SRh) in ethanol measured in a tempered cuvette at temperatures ranging from 283 K to 343 K. The Nd:YAG laser line for excitation of both dyes is marked in green at 532 nm.
The graphs in Figure 6 show the fluorescence emission spectra of the utilized dye mixture at different temperatures, indicating the MDR peak at wavelengths of λ > 640 nm. Moreover, the combination of the temperature sensitive FL and the temperature insensitive SRh leads to a high sensibility of the fluorescence intensity ratio. For this ratio, two color bands with an optimum high (“blue”) and low (“red”) temperature sensitivity were elaborated and accordingly, the filters for further measurements with an imaging system were selected as described before. These filter regions are hereafter referred to as channel 1 (“blue”) and channel 2 (“red”). The integrated signals under the graph in the shaded regions are applied for the subsequently built signal ratio. The range around 532 nm is blocked by the notch filter and would otherwise show the maximum of the FL spectrum. Compared to the absorption spectra, the emission peaks attributable to the single dyes show a signal intensity in the same order of magnitude, despite the different dye concentration in the mixture. With a concentration of 1.99·10−3 mol/L for FL, the number of moles in the volume is approximately 16 times as high as it is for SRh with a concentration of 1.24·10−4 mol/L. This is due to the absorption cross section of FL, which is very low at the 532 nm and therefore only a low share of photons is absorbed. With a higher temperature, the absorption range of FL increases and shows a slight red-shift, increasing the absorbance of laser photons. Accordingly, the temperature dependence of the FL spectrum is visible in the fluorescence emission. The FL peak (in the blue channel) increases with more than factor 1.5 for a temperature rise of 70 K, while normalized to the SRh maximum (which accordingly does not change in this depiction). This behavior of SRh emission was predictable from the absorption spectrum in Figure 5, as no strong dependence on the temperature could be observed.
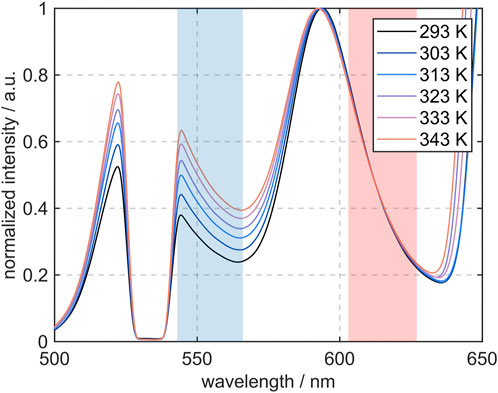
FIGURE 6. Fluorescence emission spectra of the dye mixture (750 mg/L FL and 75 mg/L SRh) measured in 100 μm sized ethanol droplets at temperatures ranging from 293 K to 343 K. The color channels of the selected filters (based on temperature sensitivity) are marked in blue and red. The signal increase in the region around 650 nm corresponds to the MDR signal.
Figure 7 shows the normalized LIF ratios at different temperatures and the resulting linear fit for the measurements with the spectrometer (s) and with the cameras in the imaging system (c). The slope of the imaging system calibration curve is steeper than the one of the spectrometer. For a direct comparison, the inclusion of the quantum efficiencies and detection angles of the optical components and the incorporation of the signals at the droplet rim in the image processing are missing or rather leading to a deviation of the slopes. By detecting with the imaging system, the filters limit the evaluated channels, whereas these limits are straight theoretical cut-offs in the evaluation of the spectrometer measurements.
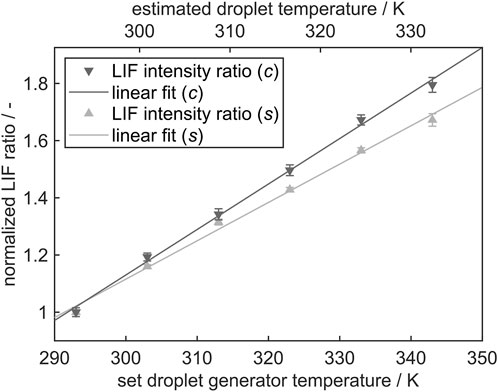
FIGURE 7. Normalized fluorescence intensity ratio of the integrated spectral channels for the simultaneous measurements with the spectrometer (s) and the camera system (c) with according standard deviations. The signal ratios are normalized to 293 K. The upper x-axis shows the estimated droplet temperature while the lower x-axis depicts the temperature, the droplet generator was tempered to.
It should be noted that two x-axes are included in the diagram. One presents the set temperature of the droplet generator, the other one is the estimated temperature in the measurement location. The estimated temperature curve is based on a two-point calibration at 293 K (ambient temperature) and the maximal studied temperature of 343 K. The temperature difference between the adjusted liquid temperature in the droplet generator (343 K, which is also assumed to be constant within the first 2 mm downstream) and the liquid temperature at the measurement position for calibration (5 mm downstream) is 10.7 K. This difference is determined iteratively by conducting 2c-PLIF measurements downstream. The spatial differences in signal ratios and thus temperatures were extrapolated linearly in order to find the most plausible temperature evolution, see Figure 9. Further details are provided in the subsequent section.
By adjusting the temperature to the estimated droplet temperature at the measurement position as described above, the calibration curve for the imaging system shows a slope of 2.02%/K, the curve for the spectrometer setup a slope of 1.71%/K, describing the resulting temperature sensitivity. In comparison, Chaze et al. [31] and Mishra et al. [5] achieved higher values for the sensitivity of the same dye combination, stating values of 2.5%/K to 3.0%/K (in water) and 2.4%/K (in ethanol). However, different setups (mm-sized droplets and cuvettes, different band-pass filters), dye concentrations or liquids (water) were used and no standard deviations are shown for an estimation of the reproducibility. As MDR effects were not considered, much broader color channels were chosen in the previous publications, probably leading to higher differences in the signal ratio and thus a steeper slope. It was mentioned that the temperature insensitive SRh band showed certain fluctuations, which could be due to the reported ring structures in a later work of Chaze et al. [23]. As shown in the present work, MDR effects can be avoided by selection of according optical filters. Using a dichroic mirror instead of a beam splitter, the signal loss was counteracted.
Respective single shot images of both channels (“FL” at lower and “SRh” at higher wavelengths) are shown in Figure 8. The temperature dependent signal variation in the “blue” channel (FL) is clearly visible between the coldest and the hottest operating point. No apparent temperature dependence can be observed in the ‘red channel’ (SRh) images. MDR effects, normally visible as very bright ring structures around the droplet, are not detected.
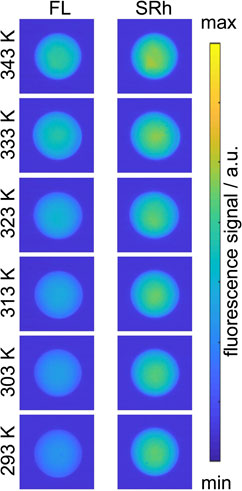
FIGURE 8. Single images of 100 μm sized droplets at temperatures from 293 K to 343 K viewed through “blue” channel (FL, left) and the “red” channel (SRh, right column). The droplets show no MDR signal at the phase boundary.
3.4 Evaporation study downstream the droplet chain
The evaporation of heated ethanol droplets alongside the droplet chain is investigated at distance intervals of 0.5 mm, starting at the nozzle exit. The initial temperature was adjusted to 343 K. At each measurement point 300 images are recorded and the signal ratio and thus the average temperature are evaluated. The temperature course over the distance from the nozzle with exemplary single shot intensity ratio images are shown in Figure 9.
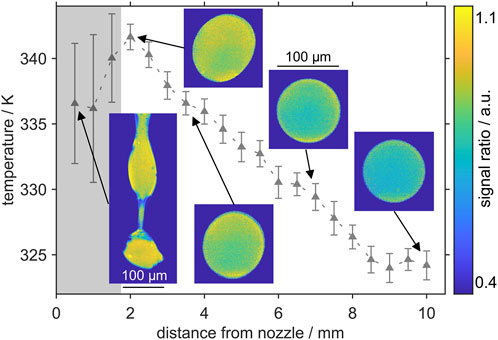
FIGURE 9. Temperature profile of the droplets measured downstream the droplet chain. The droplet generator was tempered to 343 K. The shaded area marks the nozzle exit before single droplets detach from the liquid core. Here, large variations occur and high local signal intensities lead to an underestimation of the temperature.
At 2 mm distance from the nozzle, actual droplets have detached from the liquid core and show transient oscillation. The image at 3.5 mm distance shows still a slightly deformed droplet before a stable spherical droplet is formed further downstream. In general, a decrease of the temperature with distance from the nozzle can be observed. A temperature of 341.6 K is determined at 2 mm. The cooling of the liquid is considered to be marginal in the first 2 mm of the droplet chain due to the surrounding hot shielding gas, which was also heated to 343 K. Other groups using droplet generators for calibration assumed no evaporation until the formation of spherical droplets [32]. Consequently, between 0 mm and 2 mm the measured temperatures are underpredicted and show a larger uncertainty in terms of shot-to-shot standard deviations. In this first section of the droplet chain, Rayleigh breakup of the liquid core is observed and no droplets have formed yet. In this area, the temperature detection shows largest shot to shot deviations of up to +/-5.6 K (8.2%). Further discussion on the underprediction is provided below.
At the distances further downstream the nozzle decreasing temperatures are detected until a minimum temperature is reached. The slope between 2 mm and 9 mm is almost constant. In this study the temperature does not vary anymore between 9 mm and 10 mm. Within the studied spatial domain of 7 mm length (2 mm–9 mm distance to the nozzle), a temperature reduction of about 17.7 K was observed, which will be discussed in the subsequent paragraphs. In general, the droplet evaporation and cooling/heating are transient problems. The heated droplet is cooled down due to the heat transfer with the ambient air and the large evaporation enthalpy of the ethanol droplets. The relative velocity is reduced by drag, which varies due to slight droplet deformations. Under the present conditions, the internal temperature of a droplet can be assumed as uniform, which is confirmed by the experiments showing no distinct temperature stratification in the droplet. The measured temperature deviations at the droplet boundary, which are visible in some single-shot images of Figure 9 (e.g., at 2 mm), are not physical and occur due to larger measurement uncertainties (local SNR). The SNR is very low close to the droplet surface and the droplets do not show a uniform signal ratio over the droplet diameter. These inhomogeneities could also be explained by internal optical effects, like reflection and subsequent refraction on the phase boundary. Depending on the ray angle of the fluorescence emission, a “false” image may appear in the camera detector, as described further by Dulin et al. [33] for transparent pipes. In general, the uniform temperature condition is true for a rapid mixing inside the droplet (i.e., a fast internal heat conduction) compared to the slow heat transfer between the droplet and the ambience. The instationary cooling behavior is expressed by the non-dimensional Biot number Bi
which is the ratio of the heat transfer coefficient α between the droplet and the ambience and the liquid heat conductivity λL of the droplet. The characteristic length scale L of a sphere equals one-third of droplet radius [34]. At the present conditions, Bi = 0.103 is obtained, which implies that internal heat conduction is very fast so that almost no temperature gradient can be observed in the droplet. The Biot number was calculated for an average droplet velocity uD = 1.24 m/s and an initial liquid heat conductivity of ethanol λL = 156 mW/(m·K) at 343 K [35]. Under comparable conditions but other liquids (fuels), similar Biot numbers were reported in the literature [36, 37]. Furthermore, for small Biot numbers in the range of 0.1–0.25, effects of droplet distortions of up to 35% were studied by Dai et al. [36]. However, the droplet deformation due to drag showed no significantly improved internal heat transfer [36].
The temperature reduction of about 17.7 K within 7 mm is partly due to the cooling of the hot droplet in the cold ambient air. This cooling by the heat transfer with the ambience accounts for a temperature decrease of about 7.3 K within 7 mm (or within about 6 ms) estimated by using the lumped capacitance model being valid for small Biot numbers (Bi < 0.1) [34]. Additionally, a temperature reduction due to evaporation of at least 10 K is reasonable for ethanol droplets. In a numerical simulation, a droplet temperature reduction of about 17 K for isolated ethanol droplets was observed for initial droplet diameters of 5 μm–40 µm within the first 1.2 ms [38] (the initial droplet temperature was 293 K). This corresponds to a droplet size reduction of 3.4% for an initially 10 μm large droplet. In the present measurements, no droplet size variations were evaluable, since the droplets showed large initial deformations. However, a simplified evaporation model for the steady phase following Sazhin et al. [39] confirmed a small droplet size reduction to about 98.9 μm at the present conditions.
In general, it could be shown that the optimized two-dye 2c-PLIF technique is able to provide droplet temperatures of evaporating droplets in a heated droplet chain on a single shot basis. Depending on the temperature the typical SNR were in the range of 21–105 (average of 47) for the blue channel and between 379 and 662 (average of 446) for the red channel. Temperature variations of 1.4 K could be resolved, for example, between 4.0 mm and 4.5 mm. The average temperatures are 336.0 K and 334.6 K, respectively. The standard deviations were typically around +/-1.0 K.
The larger uncertainty in the jet breakup region may have various reasons. In this near-nozzle region, some “hot” and “cool” spots are observed in the liquid jet, which are not physical. Probably, this is due to fluorescence light reflections at the bare surface of the droplet generator or at the liquid jet itself originating from other regions in the jet, which are projected on the droplet under investigation. These background reflections or scattering effects cannot be compensated easily and other measures such as 2-photon LIF [40] could be required for this purpose. These reflections are partly reabsorbed in the jet or droplets and lead to falsified signal ratios and temperatures as well. This fluorescence scattering and reabsorption is also an issue for droplets close to the liquid core. There, in some images a much brighter illuminated droplet surface is clearly visible originating from fluorescence of neighboring droplets. This also contributes to higher and unphysical droplet temperatures in the near-field of the droplet generator.
4 Conclusion
This work presents the optimization of a two-dye 2c-LIF thermometry approach and its first-time application for measurements in a monodisperse ethanol droplet chain. With the use of two contrarily temperature dependent fluorescence dyes (FL and SRh) calibration measurements were conducted in a tempered cuvette (absorption) and a droplet generator (emission). Two detection systems - a fiber-coupled VIS spectrometer and a camera system with two sCMOS cameras - enabled detailed measurements of interfering MDR signals. With the two-dye approach ‘controlled color switching’ of the MDR signal to a high wavelength was possible without addition of another absorber dye, which is common practice for other LIF dyes. At around 652 nm the average MDR peak is located outside of the main fluorescence emission bands of the dye mixture spectrum. Thus, two optical filters for the camera system could be selected in wavelength regions without lasing signal. The filter bands are different from the suggested ones in the literature for water. With this improved approach, a calibration curve with a promising temperature sensitivity of the signal ratio (2.02%/K for detection with the camera system) was attained in micrometric droplets of 100 µm without detection of MDR signals. Additionally, first-time investigations of the droplet cooling and evaporation were successfully performed downstream the droplet chain in form of temperature measurements with the two-dye 2c-LIF imaging approach. A cooling of around 20 K could be measured for a distance of 10 mm. Images detected close to the nozzle show the Rayleigh breakup of the liquid core. In this region of primary breakup, the results show strong deviations, probably resulting from optical effects inside the non-spherical structures and droplets. At distances between 2 mm and 9 mm more spherical droplets are formed. There, a linear decay of the temperature is observed, which amounts to about 17.7 K. This is a realistic value for cooling by evaporation and heat transfer with the cold ambient air. An estimation of the cooling due to convective heat transfer is attained after the lumped capacitance model and accounts for a decrease by 7.3 K.
In conclusion, successful exemplary thermometry measurements in the droplet chain could be performed, but also showed the necessity of further fundamental investigations on this approach. Droplet size dependent studies on MDR with the present two-dye LIF concept should be part of future work since the MDR signals themselves were not the focus of the present work. Furthermore, simulations and experimental studies of possible lens effects, leading to distortions in the signal ratios in the droplets, could help to understand and minimize variations in the results. Additionally, extensive simulations of the droplet formation by the droplet generator and evaporation should be conducted for better understanding of the underlying heat and mass transfer mechanisms.
Data availability statement
The raw data supporting the conclusion of this article will be made available by the authors, without undue reservation.
Author contributions
HU, LZ, and EB developed the diagnostic concept. HU designed the experiment and performed it together with SS and MM. HU processed the data. HU and LZ interpreted the data and wrote the manuscript. EB corrected the paper. LZ is the project leader and responsible for funding acquisition and supervision. All authors contributed to the article and approved the submitted version.
Acknowledgments
The authors gratefully acknowledge funding of the Erlangen Graduate School in Advanced Optical Technologies (SAOT) by the Bavarian State Ministry for Science and Art. We acknowledge financial support by University of the Bundeswehr Munich and thank the WiWeb (Wehrwissenschaftliches Institut für Werk-und Betriebsstoffe) for providing the fluid property measurements.
Conflict of interest
The authors declare that the research was conducted in the absence of any commercial or financial relationships that could be construed as a potential conflict of interest.
Publisher’s note
All claims expressed in this article are solely those of the authors and do not necessarily represent those of their affiliated organizations, or those of the publisher, the editors and the reviewers. Any product that may be evaluated in this article, or claim that may be made by its manufacturer, is not guaranteed or endorsed by the publisher.
References
1. Ashgriz N. Handbook of atomization and sprays: Theory and applications. New York, NY: Springer (2011).
2. Lefebvre AH, McDonell VG. Atomization and sprays. Boca Raton, London, New York: CRC Press Taylor and Francis Group (2017).
3. Wang M, Stiti M, Chaynes H, Becker S, Berrocal E, Lemoine F, et al. Two-photon fluorescence lifetime imaging applied to the mixing of two non-isothermal sprays: Temperature and mixing fraction measurements. Experiments in Fluids (2022) 63:172. doi:10.1007/s00348-022-03515-5
4. Berrocal E, Paciaroni M, Chen Mazumdar Y, Andersson M, Falgout Z, Linne M. Optical spray imaging diagnostics. In: Optical diagnostics for reacting and non-reacting flows: Theory and practice publisher. Reston VA: American Institute of Aeronautics and Ast (2023).
5. Mishra YN, Abou Nada F, Polster S, Kristensson E, Berrocal E. Thermometry in aqueous solutions and sprays using two-color LIF and structured illumination. Opt express (2016) 24(5):4949–63. doi:10.1364/OE.24.004949
6. Wu Y, Heyne JS, Zhang Z. Simultaneous measurements of refractive index, surface tension, and evaporation rate of Jet A fuel. Appl Opt (2019) 58(16):4326–31. doi:10.1364/AO.58.004326
7. Lemoine F, Castanet G. Temperature and chemical composition of droplets by optical measurement techniques: A state-of-the-art review. Experiments in Fluids (2013) 54:1572. doi:10.1007/s00348-013-1572-9
8. Fansler TD, Parrish SE. Spray measurement technology: A review. Meas Sci Tech (2015) 26:012002. doi:10.1088/0957-0233/26/1/012002
9. Lemoine F, Wolff M, Lebouche M. Simultaneous concentration and velocity measurements using combined laser-induced fluorescence and laser Doppler velocimetry: Application to turbulent transport. Experiments in Fluids (1996) 20(5):319–27. doi:10.1007/BF00191013
10. Lemoine F, Antoine Y, Wolff M, Lebouche M. Simultaneous temperature and 2D velocity measurements in a turbulent heated jet using combined laser-induced fluorescence and LDA. Experiments in Fluids (1999) 26(4):315–23. doi:10.1007/s003480050294
11. Perrin L, Castanet G, Lemoine F. Characterization of the evaporation of interacting droplets using combined optical techniques. Experiments in Fluids (2015) 56(2):29–16. doi:10.1007/s00348-015-1900-3
12. Palmer J, Reddemann MA, Kirsch V, Kneer R. Temperature measurements of micro-droplets using pulsed 2-color laser-induced fluorescence with MDR-enhanced energy transfer. Experiments in Fluids (2016) 57:177. doi:10.1007/s00348-016-2253-2
13. Palmer J, Reddemann M, Kirsch V, Kneer R. Development steps of 2-color laser-induced fluorescence with MDR-enhanced energy transfer for instantaneous planar temperature measurement of micro-droplets and sprays. In: 28 thEuropean Conference on Liquid Atomization and Spray Systems; September. 6-8 2017; Valencia, Spain (2017).
14. Palmer J, Schumacher L, Reddemann MA, Kirsch V, Kneer R. Applicability of pulsed 2cLIF-EET for micro-droplet internal thermometry under evaporation conditions. Experiments in Fluids (2020) 61:99. doi:10.1007/s00348-020-2935-7
15. Natrajan VK, Christensen KT. Two-color laser-induced fluorescent thermometry for microfluidic systems. Meas Sci Tech (2009) 20(1):015401. doi:10.1088/0957-0233/20/1/015401
16. Prenting MM, Bin Dzulfida MI, Dreier T, Schulz C. Characterization of tracers for two-color laser-induced fluorescence liquid-phase temperature imaging in sprays. Experiments in Fluids (2020) 61:1–15. doi:10.1007/s00348-020-2909-9
17. Mishra YN, Yoganantham A, Koegl M, Zigan L. Investigation of five organic dyes in ethanol and butanol for two-color laser-induced fluorescence ratio thermometry. Optics (2020) 1:1–17. doi:10.3390/opt1010001
18. Prenting MM, Shilikhin M, Dreier T, Schulz C, Endres T. Characterization of tracers for two-color laser-induced fluorescence thermometry of liquid-phase temperature in ethanol, 2–ethylhexanoic-acid/ethanol mixtures, 1-butanol, and o-xylene. Appl Opt (2021) 60(15):C98–C113. doi:10.1364/AO.419684
19. Koegl M, Delwig M, Zigan L. Characterization of fluorescence tracers for thermometry and film thickness measurements in liquid coolants relevant for thermal management of electric and electronic components. Sensors (2022) 22:8892. doi:10.3390/s22228892
20. Koegl M, Dai H, Baderschneider K, Ulrich H, Zigan L. Polarization-dependent LIF/Mie ratio for sizing of micrometric ethanol droplets doped with Nile red. Appl Opt (2022) 61(14):4204–14. doi:10.1364/AO.457685
21. Koegl M, Dai H, Qomi MP, Bauer F, Eppinger B, Zigan L. Morphology-dependent resonances in laser-induced fluorescence images of micrometric gasoline/ethanol droplets utilizing the dye nile red. Appl Opt (2021) 60(17):5000–11. doi:10.1364/AO.423059
22. Koegl M, Hofbeck B, Baderschneider K, Mishra YN, Huber FJT, Berrocal E, et al. Analysis of LIF and Mie signals from single micrometric droplets for instantaneous droplet sizing in sprays. Opt express (2018) 26(24):31750–66. doi:10.1364/OE.26.031750
23. Chaze W, Caballina O, Castanet G, Lemoine F. Spatially and temporally resolved measurements of the temperature inside droplets impinging on a hot solid surface. Experiments in Fluids (2017) 58:1–16. doi:10.1007/s00348-017-2375-1
24. Lavieille P, Lemoine F, Lavergne G, Lebouché M. Evaporating and combusting droplet temperature measurements using two-color laser-induced fluorescence. Experiments in Fluids (2001) 31:45–55. doi:10.1007/s003480000257
25. Taniguchi M, Lindsey JS. Database of absorption and fluorescence spectra of 300 common compounds for use in PhotochemCAD. Photochem Photobiol (2018) 94(2):290–327. doi:10.1111/php.12860
26. Pastel R, Struthers A. Measuring evaporation rates of laser-trapped droplets by use of fluorescent morphology-dependent resonances. Appl Opt (2001) 40(15):2510–4. doi:10.1364/ao.40.002510
27. Zheng L, Zhi M, Chan Y, Khan SA. Multi-color lasing in chemically open droplet cavities. Scientific Rep (2018) 8(1):14088. doi:10.1038/s41598-018-32596-8
28. Chen G, Mohiuddin Mazumder M, Chang RK, Christian Swindal J, Acker WP. Laser diagnostics for droplet characterization: Application of morphology dependent resonances. Prog Energ Combustion Sci (1996) 22(2):163–88. doi:10.1016/0360-1285(96)00003-2
29. Tang SKY, Derda R, Quan Q, Lončar M, Whitesides GM. Continuously tunable microdroplet-laser in a microfluidic channel. Opt express (2011) 19(3):2204–15. doi:10.1364/OE.19.002204
30. Sakakibara J, Adrian RJ. Whole field measurement of temperature in water using two-color laser induced fluorescence. Experiments in Fluids (1999) 26:7–15. doi:10.1007/s003480050260
31. Chaze W, Caballina O, Castanet G, Lemoine F. The saturation of the fluorescence and its consequences for laser-induced fluorescence thermometry in liquid flows. Experiments in Fluids (2016) 57:1–18. doi:10.1007/s00348-016-2142-8
32. Maqua C, Depredurand V, Castanet G, Wolff M, Lemoine F. Composition measurement of bicomponent droplets using laser-induced fluorescence of acetone. Experiments in Fluids (2007) 43(6):979–92. doi:10.1007/s00348-007-0368-1
33. Dulin V, Cherdantsev A, Volkov R, Markovich D. Application of planar laser-induced fluorescence for interfacial transfer phenomena. Energies (2023) 16:1877. doi:10.3390/en16041877
34. Bergman TL, Incropera FP, DeWitt DP, Lavine AS. Principles of heat and mass transfer. Hoboken, NJ: Wiley (2013).
35. Lemmon EW, Huber ML, McLinden MO. REFPROP 9.1 "reference fluid thermodynamic and transport properties database (2013).
36. Dai M, Perot JB, Schmidt DP. Heat transfer within deforming droplets. In: ASME 2002 Internal Combustion Engine Division Fall Technical Conference; September 8–11, 2002. Louisiana, USA: New Orleans (2002).
37. Keller P, Bader A, Hasse C. The influence of intra-droplet heat and mass transfer limitations in evaporation of binary hydrocarbon mixtures. Int J Heat Mass Transfer (2013) 67:1191–207. doi:10.1016/j.ijheatmasstransfer.2013.08.104
38. Koegl M, Mishra YN, Baderschneider K, Conrad C, Lehnert B, Will S, et al. Planar droplet sizing for studying the influence of ethanol admixture on the spray structure of gasoline sprays. Experiments in Fluids (2020) 61:209. doi:10.1007/s00348-020-03040-3
39. Sazhin SS, Krutitskii PA, Gusev IG, Heikal MR. Transient heating of an evaporating droplet. Int J Heat Mass Transfer (2010) 53:2826–36. doi:10.1016/j.ijheatmasstransfer.2010.02.015
40. Ulrich H, Lehnert B, Guénot D, Svendsen K, Lundh O, Wensing M, et al. Effects of liquid properties on atomization and spray characteristics studied by planar two-photon fluorescence. Phys Fluids (2022) 34:083305. doi:10.1063/5.0098922
Glossary
Keywords: thermometry, fluorescence, droplets, dye, evaporation, droplet cooling, 2c-LIF
Citation: Ulrich H, Sigl S, Möhnle M, Berrocal E and Zigan L (2023) Droplet thermometry based on an optimized two dye two-color laser-induced fluorescence concept. Front. Phys. 11:1235847. doi: 10.3389/fphy.2023.1235847
Received: 06 June 2023; Accepted: 20 July 2023;
Published: 02 August 2023.
Edited by:
Kuo-Long Pan, National Taiwan University, TaiwanReviewed by:
Zhili Zhang, The University of Tennessee, United StatesDonato Fontanarosa, Faculty of Engineering Sciences, Belgium
Copyright © 2023 Ulrich, Sigl, Möhnle, Berrocal and Zigan. This is an open-access article distributed under the terms of the Creative Commons Attribution License (CC BY). The use, distribution or reproduction in other forums is permitted, provided the original author(s) and the copyright owner(s) are credited and that the original publication in this journal is cited, in accordance with accepted academic practice. No use, distribution or reproduction is permitted which does not comply with these terms.
*Correspondence: Hannah Ulrich, SGFubmFoLnVscmljaEB1bmlidy5kZQ==