
94% of researchers rate our articles as excellent or good
Learn more about the work of our research integrity team to safeguard the quality of each article we publish.
Find out more
ORIGINAL RESEARCH article
Front. Phys., 22 September 2023
Sec. Fusion Plasma Physics
Volume 11 - 2023 | https://doi.org/10.3389/fphy.2023.1225787
 S. Mazzi1,2*†
 M. Vallar1†
 U. Kumar1†
 O. Krutkin1†
 J. Poley-Sanjuan1L. Simons1J. Ball1
 S. Brunner1S. Coda1
 J. Garcia2A. Iantchenko1Ye. O. Kazakov3W. H. Lin4
 J. Ongena3B. Rofman1
 L. Villard1 the TCV teama
Following recent observations of unstable Toroidal Alfvén Eigenmodes (TAEs) in a counter-current Neutral Beam Injection (NBI) scenario developed in TCV, an in-depth analysis of the impact of such modes on the global confinement and performance is carried out. The study shows experimental evidence of non-degradation of ion thermal confinement despite the increasing of auxiliary power. During such an improved confinement period, Toroidal Alfvén Eigenmodes (TAEs) driven by fast ions generated through Neutral Beam Injection (NBI) are found unstable. Together with the TAEs, various instabilities associated with the injection of the fast neutrals are observed by multiple diagnostics, and a first characterization is given. Nonlinear wave-wave couplings are also detected through multi-mode analysis, revealing a complex picture of the stability dynamics of the TCV scenario at hand. The measurements provided by a short-pulse reflectometer corroborate the identification and radial localization of the instabilities. A preliminary, but not conclusive, analysis of the impact of TAEs on the amplitude of the electron density fluctuations is carried out. Local flux-tube gyrokinetic simulations show that the dominant underlying instabilities in the absence of fast ions are Trapped Electron Modes (TEM), and that these modes are effectively suppressed by zonal flows. Attempts to simulate the simultaneous presence of fast-ion driven TAEs and TEM turbulence show that elongated streamers develop up to the full radial extent of the flux-tube domain, thereby invalidating the local assumption and indicating that a global approach is mandatory in these TCV plasmas.
In present and future tokamaks, the presence of a fast-ion population can destabilize several kinds of instabilities [1], among which the fast-ion-driven Alfvén Eigenmodes (AEs) are one of the most studied [2]. These instabilities are a major issue for fusion reactors since they can cause anomalous radial transport of fast ions such as fusion born alpha particles, leading to losses of the main heating source and therefore to a degradation of the plasma performance. Additionally, AEs and especially Toroidal Alfvén Eigenmodes (TAEs) [3] are expected to be destabilized in the next-generation tokamak device ITER [4], and therefore it is crucial to determine their effects not only on the fast-ion confinement, but also directly on the bulk plasma characteristics.
Nevertheless, it has been pointed out that fast-ion-driven TAEs can have a beneficial impact on the ion-scale turbulent transport [5] by triggering a complex mechanism involving nonlinear coupling between TAE waves and the zonal component of both the electrostatic and magnetic potential [6, 7]. More recent studies validated such a complex mechanism against JET experimental results of improved ion thermal confinement in the three-ion heating scheme scenario [8, 9]. Basically, fast ions destabilize the TAEs by wave-particle resonant interaction, and subsequently the TAEs nonlinearly couple to the zonal components of the electrostatic potential whose effects on the saturation of the ion temperature gradient (ITG)-driven turbulence is well-established [10]. This evidence has been obtained through computationally expensive nonlinear gyrokinetic simulations which have been further validated against experimental outcomes [11, 12]. Recent overviews on this topic are provided by Refs. [13, 14].
Such a result may pave the way towards a full exploitation of the complex mechanism triggered by the fast ions destabilizing AEs also in other devices beyond JET, and also in other plasma regimes. This is a crucial question to be addressed, since the performance predictions of future tokamaks with substantial populations of energetic particles, such as JT-60SA [15–17] and ITER may be revised in the light of this mechanism. For these reasons, the Tokamak à Configuration Variable (TCV) [18] represents a suitable test-bed case for studying the impact of fast-ion-driven AEs on the turbulence properties and transport characteristics. Indeed, recent efforts through the efficient exploitation of the tangential neutral beam injectors (NBIs) [19] allowed the development of plasma scenarios with a rich variety of unstable AEs [20, 21]. In particular, TAEs have been routinely observed in such scenarios, offering the possibility to compare with the studies at JET [11].
In this paper, we report extensive and multi-diagnostic studies in parallel with numerical efforts to investigate the impact of fast-ion-driven modes at high frequency on the plasma characteristics, global confinement and turbulent transport. The paper is organized as follows: in Sections 2 and 3.1 the experimental setup, main observations and analyses are reported in great detail by comparing different diagnostic measurements and correlating various experimental signals to infer the impact of the fast-ion-driven modes on the plasma confinement. Further, in Section 3.2, preliminary numerical analyses address such an impact in a gyrokinetic framework, including the limitations of the numerical model employed first and then drawing the path towards more accurate approaches. In the end, the conclusions and perspectives resulting from this work are summarised in Section 4.
In this section, the TCV experimental scenario development, the diagnostic capabilities and the main outcomes from the experiment are reported and detailed. As mentioned previously, the developed scenario has been previously described in Ref. [21], but for the sake of clarity, the main characteristics of such a scenario are presented in the following.
The plasma current Ip is set to 120 kA and chosen to be in the opposite direction with respect to the NBI injection (counter-current injection). The toroidal magnetic field is in the same direction of Ip, that is counter-clock wise seen from the top. Thus, a net NBI-driven current is computed by the TRANSP integrated modelling [22] to be around 10% of the total current in the plasma core. The tangentially positioned NBI used in this scenario can reach up to 1.2 MW of input power, with a energy of the injected deuterons up to 28 keV. The NBI voltage, and thereby the energy of the injected neutrals, is varied when the NBI power varies in TCV [19]. However, in the pulses reported in this paper, the maximum NBI input power is 0.85 MW, corresponding to deuteron energy of 25.6 keV. The NBI source injects horizontally at the centre of the vessel (z = 0 cm), and therefore slightly off-axis since the plasma center is up-shifted by around 5 cm in the vertical direction. Different time-traces of the NBI input power have been investigated in this scenario, in order to better understand the impact of specific parameters − such as the fast ion energy − on the Alfvén mode activity and to better characterize the power threshold for the various observed instabilities. The toroidal magnetic field is kept constant to B0 = 1.3 T during the pulses, whereas the plasma has an elongation at the edge of around κedge = 1.35. As it is described in the next few paragraphs, the plasma elongation is slightly modified (less than 5%) during the shots of this scenario. The choice of the magnetic field value followed previous indications, reported in Ref. [20], of rich Alfvén activity with such reduced B0 due to a smaller Alfvén velocity with respect to the NB-injected deuterons velocity vFI. The beam velocity, calculated for the deuterium injected at 25.6 keV for the toroidal magnetic field value of this scenario and an ion density of 3 × 10¹⁹ m−3, is vFI = 0.32vA [21], with
This article focuses on specific pulses of the scenario developed for the study of energetic-particle-driven modes in TCV [21]. In Figure 1, the radial profiles of relevant plasma parameters for two pulses of this scenario, TCV pulses #74361 and #76361, are displayed for different time instants. A Thomson scattering diagnostic measures the electron density and temperature, whereas the charge exchange recombination spectrometer quantifies the ion temperature. The safety factor profile is determined through kinetic reconstruction with the code LIUQE [23].
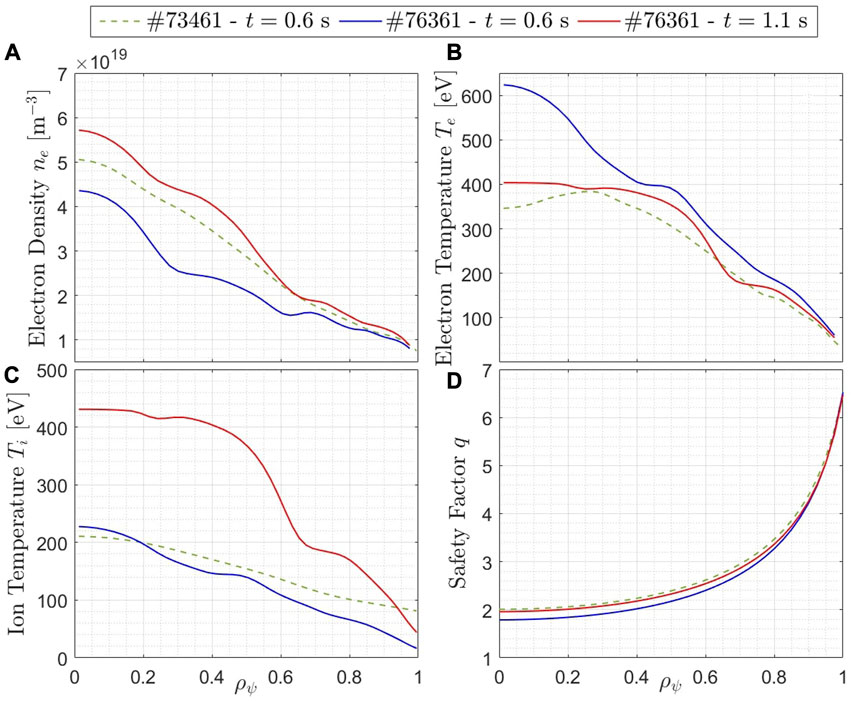
FIGURE 1. Experimentally measured radial profiles of TCV pulses #73461 (at t =0.6 s) and #76361 (at two time instants, t =0.6 s and t =1.1 s).
The reproducibility of the scenario has been confirmed by running multiple pulses in different sessions. In particular for this study, the waveforms of the NBI input power have been modified: in pulse #73461 the power has been injected constantly at ∼800 kW in two different time windows (see panel (a) of Figure 2), while in pulses #76179 and #76180 the waveforms are linear ramps of 1.2 s going from 0.3 MW to 1.1 MW and from 0.15 MW to 0.8 MW respectively. In all of the pulses of this scenario, the NB injection onset is set at t = 0.4 s. It is worth to note that for pulse #73461 the NB-injected fast ion energy is higher than the critical energy, and therefore this plasma is mainly electron-heated. This is confirmed by TRANSP modelling.
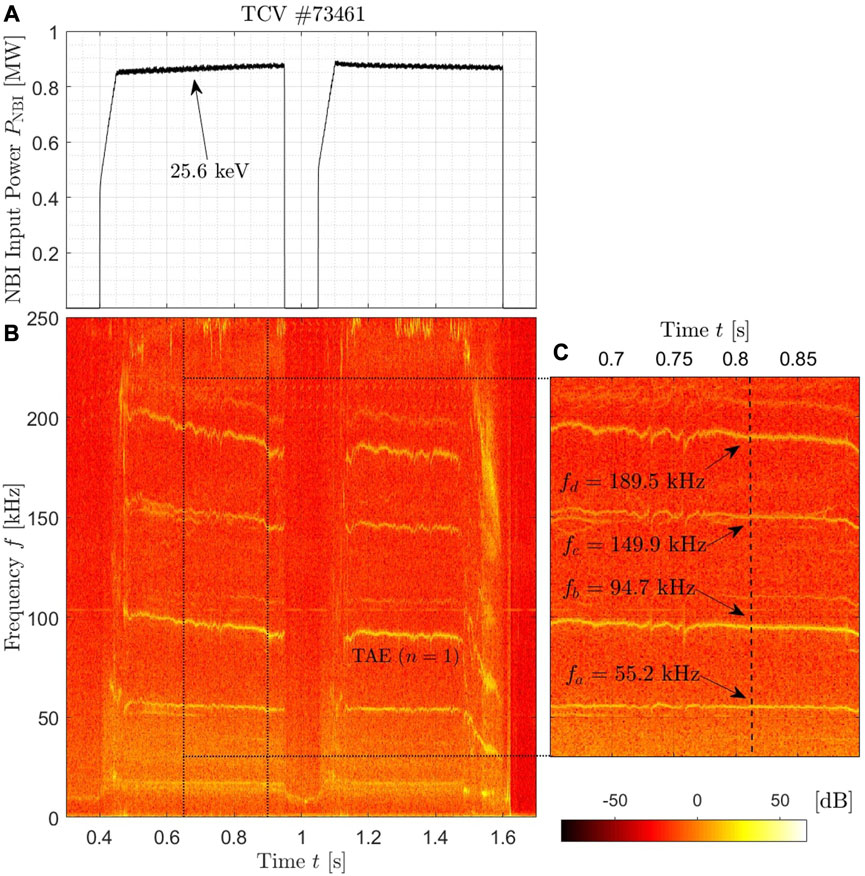
FIGURE 2. (A) Time trace of the NBI input power with indication of the beam injected particle energy and (B) spectrogram of the magnetic signal from the LTCC coils of TCV pulse #73461. (C) Zoom of the spectrogram of panel (B), where the relevant mode frequencies fa, fb, fc and fd are highlighted with arrows.
The NBI waveform of pulse #76180 is displayed in panel (a) of Figure 3. It must be noted that in order to ramp up the NBI input power, the NBI voltage is modified accordingly (more details in Ref. [19]), which is related to the fast ion energy. This influences the injected fast-ion population characteristics, and it may thereby impact on the plasma stability especially concerning the fast-ion-driven instabilities.
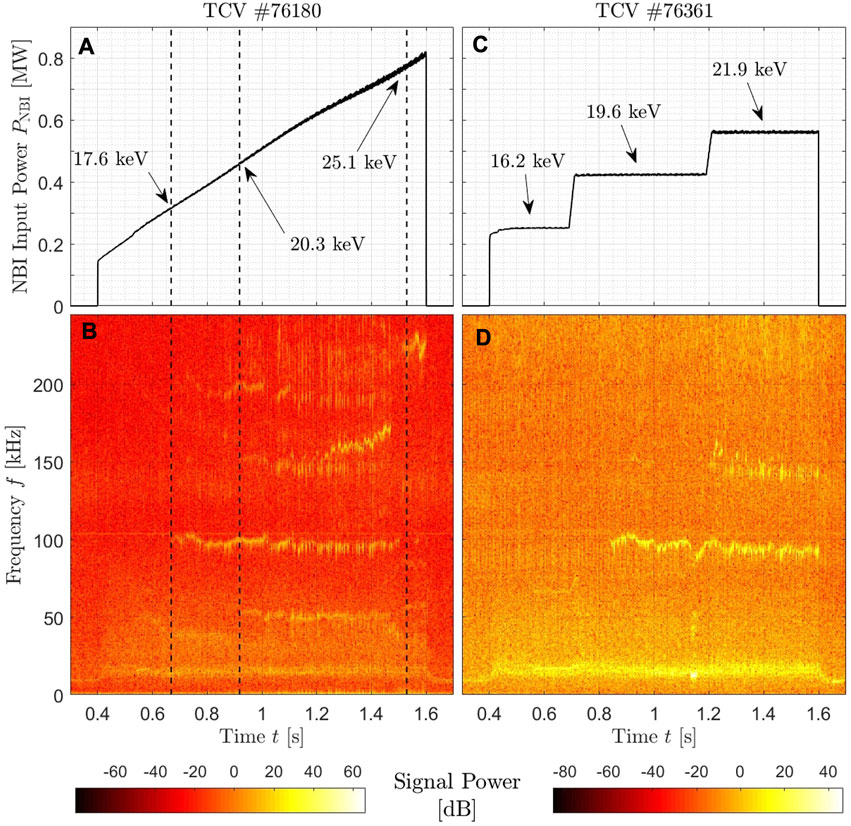
FIGURE 3. (A) and (C) Time traces of the NBI input power with beam injected particle energy indicated at relevant time instants/windows. (B) and (D) spectrogram of the magnetic signal from the LTCC coils of TCV pulse #76180 and #76361, respectively. The vertical dashed lines in panels (A) and (B) indicate the identified various thresholds for the various modes destabilization.
Hence, these latter two pulses have been carried out as part of a series to evaluate the possible power thresholds for the fast-ion-driven modes observed in such a scenario. However, it is possible, only empirically, to correlate the appearance of the instabilities to the power input from NBI. For the sake of clarity, we recall that the presence of a fast-ion driven AE instability depends on many factors, among which the following: (i) the fast ions must have a sufficiently high velocity compared to the Alfvén velocity (vFI > = vA/3); (ii) the fast ion pressure gradient |∇PFI| must be sufficiently large so that the drive exceeds the sum of dampings on all plasma species. Condition (ii) depends on several factors, in particular the relative radial positions of maximum |∇PFI| and AE, which itself depends among others on the q-profile. Hence, the observed instability thresholds could also be related to the fast-ion total pressure, and in particular to the fast-ion density, and not only to the energy of the injected neutrals.
After this specific study on the instability thresholds, the shape of the waveforms of the NBI has been further modified. Steps of increasing NBI input power have been designed in order to have quasi-steady plasma conditions in between relevant power thresholds. In transients following the power steps the fast ion distribution can deviate from its assumed slowing-down quasi-steady state and may present potentially destabilizing bump-on-tail features. This type of consideration is not central to the paper (except to be aware of a possible delay after the power steps) and is left to future studies. As an example of such a pulse series, the NBI waveforms of pulse #76361 are displayed in panel (c) of Figure 3. The quasi-steady plasma conditions for several confinement times allow us to determine a possible impact of the various instabilities developed at the corresponding power threshold on the global plasma characteristics.
To analyze the specific impact of the fast-ion-driven instabilities on the plasma properties, dedicated diagnostics have been exploited to study the turbulence characteristics. TCV is equipped with a short-pulse reflectometer (SPR) [24] and a correlation electron cyclotron emission (C-ECE) [25] diagnostic able to measure, respectively, the electron density and temperature fluctuations down to the microturbulent scales. The SPR measures the round trip times-of-flight by injecting broadband microwave pulses, with carrier frequencies in the range of 50–75 GHz, being thus capable of measuring the density profile with sub-centimeter spatial resolution and microsecond temporal resolution and resolving its fluctuations. The C-ECE, on the other hand, correlates the signals of different ECE radiometer channels to strongly decrease the noise and thereby measure the local electron temperature fluctuation amplitude. Since the two diagnostics can simultaneously analyze multiple frequencies, a radially extended profile of the detected instabilities can in some cases be provided. This may allow us to localize the various instabilities even radially. In addition, and specifically for the goal of this study, the electron density and temperature fluctuations can be used as a proxy of the turbulence properties of the background plasmas. Hence, the impact of the fast-ion-driven instabilities on the plasma turbulence can be studied in great detail in TCV.
Using such an experimental setup, a rich variety of Alfvén activity up to around 250 kHz is observed thanks to the set of magnetic LTCC-3D diagnostic with an acquisition frequency of 2 MHz [26, 27]. The spectrogram computed from the magnetic coil signals measured for the TCV pulse #73461 is shown in panel (b) of Figure 2 together with the NBI input power time-trace (in panel (a)). Several different modes can be observed, clearly associated with the presence of NB-injected fast ions from t ≈ 0.4 s, i.e., when the NBI is applied. As a matter of fact, when the NBI system is turned off in the time window 0.95 < t < 1.05 s, the signals of the unstable modes in the spectrogram disappear. In order to characterize the instabilities, a study on the toroidal mode numbers n has been carried out by inspecting the toroidal shape of the magnetic perturbation measured from the toroidal pick-up coils in the low field side of the vessel. Those are 16, and they are equally distributed along the toroidal direction, with an additional coil interposed at the half of the distance between a couple of coils. Positive toroidal mode numbers mean that the mode propagates in the same direction of the plasma current, while vice versa for negative toroidal mode numbers. Whereas the mode observed around f ≈ 90–100 kHz has been labelled with n = 1, and the instability at f ≈ 50 kHz with n = 0, identifying the toroidal mode numbers of the remaining signals is less straightforward, due to the weak amplitude of the corresponding magnetic signals. The TAE toroidal mode number n = 1 is also corroborated by the linear analysis performed with the LIGKA code [28] reported in a previous publication about this TCV scenario [21].
A more attentive inspection of the spectrogram reveals that some possible wave-wave coupling is occurring. This can be observed, for instance, in panel (c) of Figure 2, where a zoom of the LTCC spectrogram over a representative time window is reported. The arrows with the corresponding frequencies facilitate the identification of such coupling between different instabilities. Indeed, it is observed that a three-wave coupling is likely to occur, fa + fb = fc (fa = 55.2 kHz, fb = 94.7 kHz and fc = 149.9 kHz). In order to corroborate such a finding, bicoherence analyses on the data collected by the magnetic coils have been carried out. The bicoherence bx is calculated as:
where
It must be reported that additional couplings may also be ongoing. The bicoherence analysis revealed that, e.g., a mode at ∼35 kHz couples with the modes at 55 kHz and 150 kHz (with a bicoherence level of bx = 0.50 ± 0.01). This is consistent with the fact that other faintly detected modes are present in the LTCC spectrogram, and can lead to additional wave-wave couplings. However, these are not the main purpose of the current investigation and will be, thereby, left for future contributions.
Beyond the TAE, other relevant modes are identified and characterized. A quite strong signal is visible in the spectrogram of Figure 2 around f = 190 kHz, with a very similar temporal dynamic to the n = 1 TAE at 90 kHz. This high-frequency mode has not yet been identified with enough accuracy. However, the temporal dynamic of this mode, as well as for the n = 1 TAE, corroborates the Alfvénic nature; indeed, the slowly decreasing frequency of the modes in the spectrogram is attributed to the slowly increasing plasma density throughout the pulses (see Figure 6). This is due to the inverse proportionality between Alfvén velocity and plasma density. Moreover, the reflectometer and the C-ECE measurements localize such a high-frequency mode in the same radial location of the n = 1 TAE. Since the frequency of such a mode is essentially the double of the frequency of the n = 1 TAE (in Figure 2, fd = 2fb), this suggests that the high-frequency mode could be a product of a nonlinear three-wave coupling. Indeed, the coupling of the n = 1 TAE with itself would give rise to this mode. For this reason, this could be identified as a mode lying in the n = 2 Elliptic Alfvén Eigenmode (EAE) gap [33]. Moreover, it could be localized within the same radial range (ρψ ≈ 0.6, where ρψ is the square root of the normalized poloidal magnetic flux, as it will be shown later) as observed by the SPR measurements. Such a nonlinear coupling would then also suggest a coupling to the n = 0 zero-frequency modes, that is the zonal flows [10]. To confirm these ideas, modelling studies are required, and they will be carried out in the near future with the state-of-the-art global gyrokinetic code ORB5 [32]. Although it will be also treated in the following, an anticipation of the co-existence of the two modes at the same radial location can be seen in Figure 9, where the spectrogram reveals the detection of the f ≈ 185 kHz mode simultaneously with the f ≈ 95 kHz TAE.
Furthermore, the quasi-coherent mode appearing at ∼15 kHz has been systematically detected in this TCV scenario. The soft X-ray (SXR) diagnostic in TCV [34] localizes this mode in the inner plasma core (ρψ < 0.3), and hence at a different radial location of the n = 1 TAE mode. Studies on the magnetic signals determined that such a mode likely has poloidal mode number m = −2 and toroidal n = −1, localizing it at the rational surface q = 2, consistently with the SXR localization. The identification of such a mode is still challenging, although we speculate that it may be a precursor of q = 2 fishbone-like instability. Additional analyses, outside the scope of the present work, are required to better identify the nature of this instability, and any possible nonlinear coupling with higher-frequency modes.
When the NBI waveform is modified, it is possible to determine the power thresholds of the unstable modes. Hence, in Figure 3, one can see for the pulse #76180 a first phase with low NBI input power (PNBI < 300 kW) with no unstable high-frequency modes, and where only the low frequency quasi-coherent mode at f ∼15 kHz is detected by the magnetic probes. In the same time window, a more faint mode can be detected at f = 50 kHz, which is stabilized when the NBI input power is increased at t = 0.7 s. When PNBI ≈ 300 kW, the n = 1 TAE is destabilized around f = 95–100 kHz, with its higher harmonic also faintly appearing at double of the frequency. Then, when PNBI ≈ 450 kW a second phase occurs, with more modes appearing at the frequencies f ≈ 50 kHz and f ≈ 150 kHz. A third and final phase of the pulse is then observed beyond t ≈ 1.5 s, where the previous modes are not anymore visible in the spectrogram and only a high-frequency instability dominates at f ≈ 225 kHz.
Next we characterize the mode visible at f ≈ 50 kHz, which is systematically observed in such a TCV scenario. Toroidal mode number analysis determines that this instability is predominantly a n = 0 mode and analysis of the poloidal mode numbers characterize this instability as an m = 1 mode. Those magnetic fluctuations have been, thus, identified as a geodesic acoustic mode (GAM) [35], which have been already observed in multiple devices to present a magnetic fluctuation component [36–38]. Furthermore, comparing the measured frequency to the expected frequency of a GAM (see, e.g., relation (3) in [20]), a good match is found. Since this instability is observed in the spectrogram only concomitantly with the injection of NBI fast ions, it is further suggested that it could represent an energetic particle driven GAM, usually called EGAM [39–41]. Such an instability has already been detected in previous studies at TCV [20]. By means of the short-pulse reflectometer and also of the SXR detector, the radial localization of this f ≈ 50 kHz mode appears to be in the broad range ρψ ≲ 0.5. The SXR camera uses photodiodes placed behind a 47 μm Berylium filter, such that they are most sensitive to soft X-ray photons with energies between 1 keV and 10 keV. Nonetheless, due to the low plasma temperature achieved in this scenario the emissivity in the periphal regions of the plasma is inherently low and measurements are thereby poor. This limits the radial domain of the soft X-ray measurements in this specific scenario and thereby the accuracy of the mode radial localization. Moreover, it has been suggested that the EGAMs may couple with the n = 1 TAE, which would imply a spatial overlap of the modes. This would additionally suggests that the EGAM localization may be broader than the SXR measurements. This is, however, reasonable due to the low sensitivity of the SXR camera for large ρψ region with low temperature plasma.
The SPR measurements helped in assessing the radial correlation of the turbulent density fluctuations over a wide radial range covered by the SPR channels. In Figure 4, the cross-correlation function (CCF) of the density fluctuations between various radial positions is presented based on the SPR data. The relatively narrow structure of the spectrum referring to the TAE range of frequencies (f ∈ [90–110] kHz) determines that the TAE impact on the turbulent fluctuations is expected to be restricted to a narrow region. For the sake of clarity, the same kind of analysis performed on a borader range of frequency, i.e., not only restricted to the frequency range f ∈ [90–110], presents very similar structures, as the fluctuations are dominated by the TAE instability. The latter consideration on the locality of the TAE would also imply that, from a modelling point of view, flux-tube gyrokinetic simulations of the TAE dynamics are possible and even reliable. Nevertheless, as will be shown in the next Section 3.2, the local gyrokinetic approximation reveals important limitations in this specific case likely due to the inherently large ρ⋆ of the TCV device, where ρ⋆ is the ratio between the ion Larmor radius and the minor radius of the machine. Once the thresholds have been identified, other shapes of NBI time-trace have been exploited in TCV pulse #76361, where a ramp composed of three discrete steps has been designed. The NBI input power of each step has been chosen to be consistent with the observed thresholds already explained for pulse #76180, and found in similar pulses of the same experimental session. The same kind of correlation between the NBI input power and the appearance of the modes in the magnetic spectrogram is shown in Figures 3A,B. This configuration of NBI time-trace allows us to better characterize, with dedicated diagnostics and analyses, the impact of the TAE on the global confinement of the plasma. In fact, it is thus possible to compare different quasi-steady phases of the same pulse, differing only by the input NBI and the related increase of plasma density due to NBI fuelling. The outcomes of such analyses are reported in the following section.
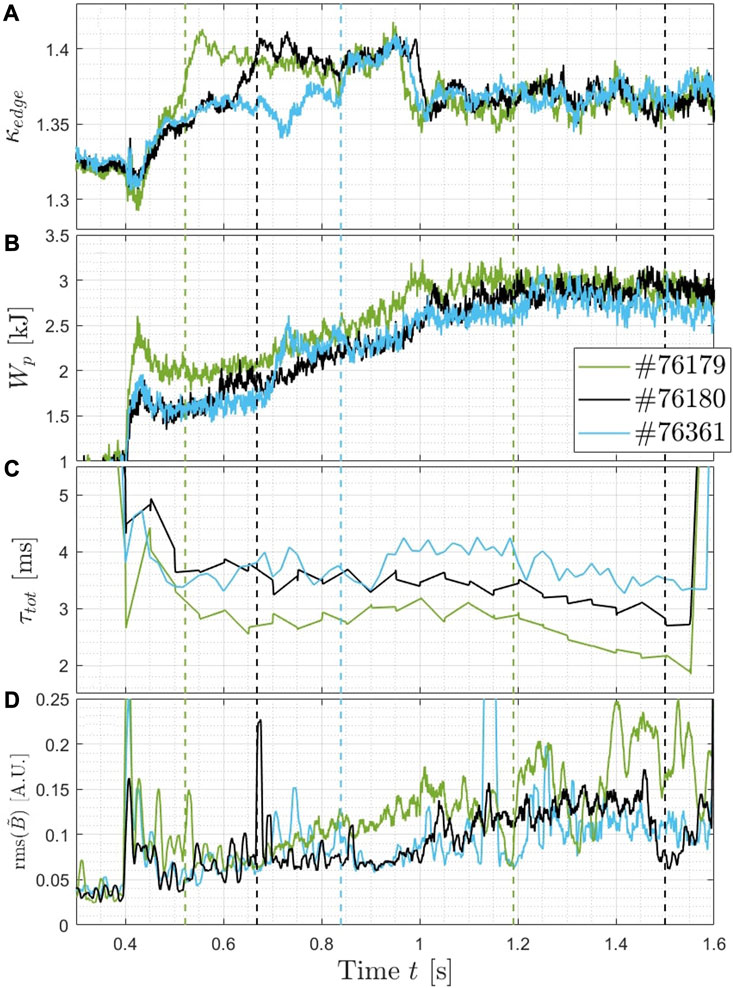
FIGURE 4. Cross-correlation function of the short-pulse reflectometer measurements of TCV pulse #76361, restricted to f =[90−110] kHz.
After having discussed about the dynamics of the fast-ion-driven instabilities and identified the nature of the relevant ones, we can now determine the impact of such modes on the confinement of the plasma. It is shown that, despite the presence of the unstable fast-ion-driven TAEs, the total energy confinement time is not degraded with increasing power, but it remains stable even in the time window with unstable TAE. As it will be presented below, this is achieved until a rich variety of MHD modes degrade the global plasma confinement, and the energy confinement time thus decreases.
A figure of merit for the evaluation of the global confinement of the plasma is indeed the energy confinement time τtot. In this TCV scenario, the energy confinement time is measured to be τtot < 5 ms, which is a smaller value with respect to the routinely pursued L-mode in TCV [18]. Such a poor confinement may have several different causes, in first place, the low plasma current Ip. Nevertheless, the goal of the here considered scenario is not the optimization of the plasma confinement, but the destabilization of fast-ion-driven Alfvén modes and the study of their impact on the plasma characteristics.
Thus, in the panels of Figure 5, the time-traces of the plasma elongation at the separatrix κedge, the plasma energy content Wp and the total energy confinement time τtot are shown. As a first observation, the plasma elongation at the edge changes abruptly when the current in the central solenoid changes direction, likely due to a failure of the plasma shape control system. It must be underlined, however, that the change is not dramatic (of the order of 2%–3%), and so we do not expect a substantial change in the transport and turbulence levels. Nevertheless, the total plasma energy content seems to be affected by this change in κedge, almost arresting its increase with the increase of the NBI input power. This saturation may be due to a different confinement of the NBI fast ions, although to our knowledge this is still to be assessed carefully in TCV. The evolution of the energy confinement time is not correlated with modifications of the edge plasma elongation. Indeed, the eventual impact on the trend in time of such plasma parameters occur after several confinement times with respect to t ≈ 1 s.
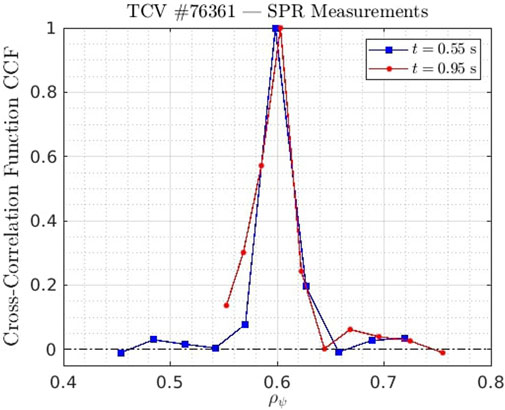
FIGURE 5. Experimental time-traces of (A) the plasma elongation at the separatrix κedge, (B) the plasma energy content Wp, (C) the total energy confinement time τtot and (D) the RMS of the magnetic field fluctuations
The vertical lines in the panels of Figure 5 delineate the time window in which the n = 1 TAEs are observed in the magnetic spectrogram, as can be inferred by comparing with, e.g., panels (b) and (c) of Figure 3. The rightmost vertical cyan line delimiting the end of the TAE activity for pulse #76361 is not visible since it coincides with the right limit of the figures (and with the turn-off of the NBI at t = 1.6 s). We remind that the pulses #76179 and #76180 are heated by progressive ramp-ups of the NBI input power, while pulse #76361 by step-wise increase. It can thus be observed that, remarkably, the energy confinement time (panel (c) of Figure 5) does not degrade in the time window when the n = 1 TAE is clearly detected in the magnetics, although the input power is increased, until the occurrence of a rich fast-ion-driven MHD activity (including the n = 1 TAE) as reported below. It is, indeed, well-established that the energy confinement time inversely scales with the auxiliary input power, as it is reported in various confinement scaling laws so far generated [42]. On the contrary, in this TCV scenario, the energy confinement time is not decreased, but rather it is stationary, when the NBI input power is increased. Different factors can contribute to this inverse-scaling other than the auxiliary input power, such as the unintended density increase or the mild equilibrium modification. For the sake of clarity, a degradation of τtot is observed when the NBI input power is high enough to drive a very rich fast-ion-driven MHD activity. This could be seen by inspecting the magnetic spectrograms of the pulses here reported.
The total energy confinement time τtot is not only dependent on the bulk plasma transport, but also on the fast-ion one. This latter component can significantly affect τtot [43]. In this TCV scenario, Fast-Ion Loss Detector (FILD) [44] measurements have not shown fast ion transport driven by the high-frequency modes, mainly due to the geometry of the detector and its relative position with respect to the plasma. Further improvement in this sense can be, hence, pursued in future experimental studies. However, this lack of measurements has been compensated by introducing a radially homogeneous anomalous diffusivity χFD in TRANSP/NUBEAM modelling. A maximum value of χFD = 2 m2/s is employed and observed to match the experimentally measured neutron rate in the phase of high NB input power (PNBI > 0.9 MW) of a representative pulse of this scenario (see Figure 11 of Ref. [21]). For what concerns the total bulk transport, predominantly driven by the microturbulence, power balance analysis with TRANSP computes it to be larger than the fast-ion counterpart. This is mostly due to the electrons, whose heat diffusivity is computed to be χe > 5 m2/s, while the thermal ion ones decreases in the phase with higher NBI input power as discussed in the following of this paper (see Figure 8B). Thus, the total energy confinement time in this TCV scenario is predominantly determined by the electron turbulent transport.
As already noticed, the stationary phases of the energy confinement time for the pulses #76180 and #76361 stops respectively around t = 1.2 s and 1.25 s. After those time instants, a decrease of τtot is observed. To those time instants we can associate a more significant MHD activity, as observed in the magnetic spectrograms of Figure 3. Multiple AEs are simultaneously destabilized, and their overlapping in the whole phase space of the energetic particles has been observed to lead to a strong increase of fast ion losses [45, 46]. This could be the major cause of the decrease of the confinement measured in the phase after those time instants. In particular, for what concerns pulse #76180, indeed, around t = 1.2 s a mode at f ∼ 160 kHz (and slowly chirping up) becomes clearly visible in the spectrogram, and it may negatively impact on the confinement. Moreover, the same occurs also for pulse #76361, where the same bursting mode develops around 160 kHz. Such a mode has also been observed in previous pulses of this scenario, also with inverse polarity of the toroidal magnetic field. This can be appreciated in Figure 2C, where two signals are detected at very similar frequencies, one determined by the wave-wave coupling described earlier in this article, and the other, more faintly appearing in the spectrogram, with a still unclear destabilizing mechanism. Panel (d) of Figure 5 displays the root mean square (rms) of the signals measured by the magnetic coils, showing that for the three pulses the signal amplitude increases with the increase of the input power from NBI. This could be related to the increment of the MHD activity.
It should also be stressed that, as already reported, the NBI fuelling leads to a slow but constant increase of the plasma density during the pulse. This can be observed in panel (a) of Figure 6, where the electron density measured at the magnetic axis is plotted as a function of the plasma duration for pulse #76179, #76180 and #76361.
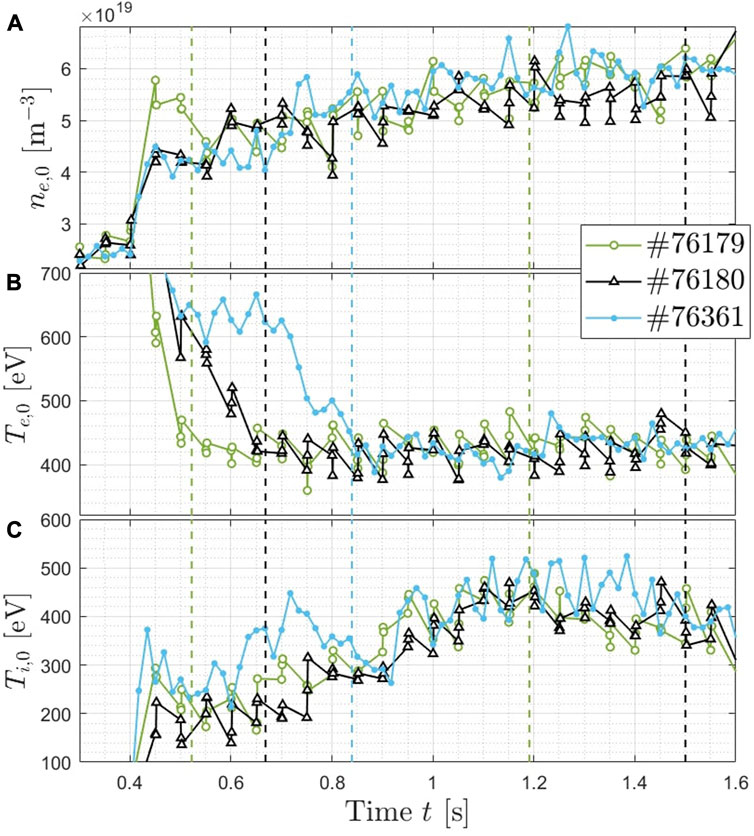
FIGURE 6. Time-traces of (A) the electron density ne,0, (B) the electron temperature Te,0 and (C) the ion temperature Ti,0 extrapolated to the magnetic axis (ρψ =0) are shown. The vertical lines represent the start and the end of the time windows with the n =1 TAE found unstable in the corresponding pulse.
In Figure 6, the evolution of the electron (panel (b)) and ion (panel (c)) temperature at the magnetic axis is displayed for the three pulses also analyzed in Figure 5. The increase of the central ion temperature Ti,0 is visible at the same time as the n = 1 TAE is found unstable. It should also be stressed that the increase of Ti,0 for pulse #76361 is almost linear until t ≈ 1.2 s, although the NBI input power is injected constantly in the various time windows (see panel (c) of Figure 3). Although the direct correlation between the onset of the TAE and the Ti,0 increase cannot be determined from this, it is quite relevant to observe that the unstable TAE does not impact negatively on the ion thermal confinement in the plasma core.
As a reminder, the vertical lines delineate the time windows for each pulse in which the n = 1 TAE is detected in the magnetics. The readers should pay attention to the fact that the NBI time-traces for the three pulses are different. Hence, a direct comparison of the parameters at specific time instants is not entirely relevant. One may however note that although the NBI input power is larger for pulses #76179 and #76180 with respect to #76361 going towards the end of the plasmas, Ti,0 is comparable if not higher for the latter pulse. This may indicate that a degradation of the confinement occurs when the MHD activity associated with large NBI input power is observed to be stronger, as already reported before for the time traces in Figure 5.
On the other hand, the central electron temperature reaches very similar values for the three analyzed pulses, that is Te,0 ≈ 425 eV, and remains roughly constant for the whole plasma duration. Moreover, when the NBI input power overcomes the threshold for the TAE destabilization, Te,0 stands at the same level for the three pulses in panel (b) of Figure 6, as can be observed by comparing the value of Te,0 at the time instants represented by the dashed vertical lines. It should be noticed that the drop of the electron temperature mainly concerns the inner core region (ρψ < 0.4), while the outer plasma is less affected (see Figure 1B).
Other relevant measurements on the impact of the various instabilities on the confinement properties have been provided by the short-pulse reflectometer (SPR) diagnostic [24]. The spectrogram of one specific channel of the SPR, associated thereby to one specific frequency, is shown in Figure 7. As an important reminder, since the density is increasing during the pulse due to the NBI fuelling, the cut-off position of the reflectometer is continuously altered. Therefore, from the spectrogram alone it is hard to determine the exact radial location of the detected modes. However, by inspecting the signals coming from various SPR channels, this allows us to restrict the TAE radial domain to the region ρψ ≈ 0.55–0.65. In Figure 7 the spanned radial range for this specific channel is going from ρψ = 0.5 to 0.6.
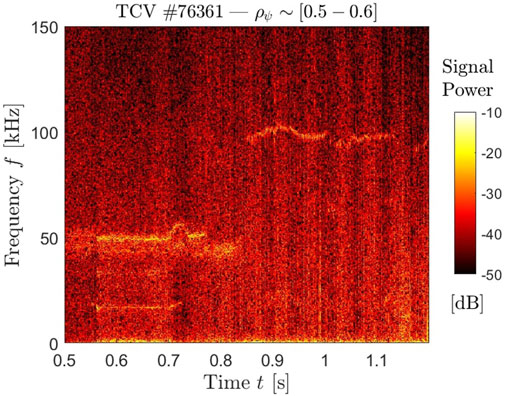
FIGURE 7. Short-pulse reflectometer spectrogram of the 64 GHz channel for the TCV pulse #76361.
The spectrogram computed from the SPR measurements shows strong similarities with the previously shown magnetic spectrogram of Figure 3D. To start with, a low-frequency mode at f ∼ 15 kHz is observed to overlap the broader quasi-coherent instability at similar frequencies in the magnetics, and in the SPR spectrogram it is indeed detected consistently as well. Moreover, at f = 50 kHz another signal is detected from t = 0.57 s, and when the NBI input power is increased the mode chirps up and then it recovers the f = 50 kHz frequency. This mode however disappears shortly after. Eventually, consistently with the LTCC magnetic signal, SPR detects the TAE around f = 100 kHz. This is important to identify the radial location of the TAE, together with C-ECE measurements for which a good agreement in radial range is observed. Previous analyses performed with the LIGKA code [28] for a selected pulse of this scenario and reported in Ref. [21] localized the peak of the n = 1 TAEs at ρψ ≈ 0.6, thereby consistently with these experimental results.
An additional figure of merit to analyze the impact of the TAE on the plasma thermal confinement is the normalized logarithmic ion temperature gradient
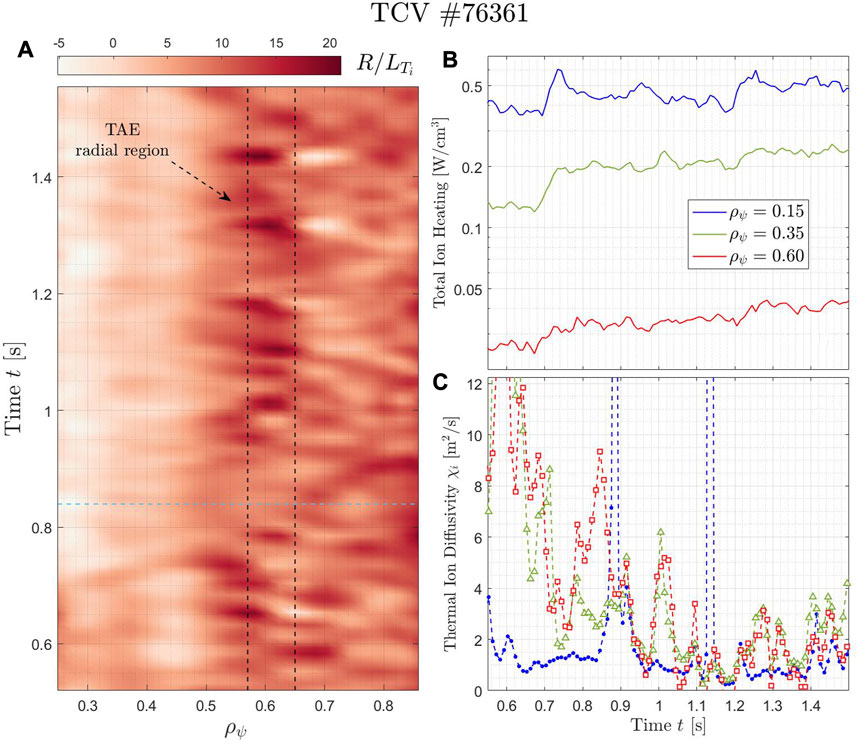
FIGURE 8. (A) Normalized logarithmic temperature gradient of the thermal ion
In the time window with the presence of AE activity, the TRANSP-computed power balances reveal that the thermal ion diffusivity decreases for a wide range of radial locations, in particular in the plasma mid-radius region, i.e., roughly 0.3 < ρψ < 0.75. In the inner core, where generally the neoclassical transport dominates over the turbulent one, the thermal ion diffusivity is computed to be low and steady throughout the pulse. In Figure 8B, the ion heat diffusivity for three radial positions are plotted as a function of time. Such a result indicates that there is an improved thermal confinement for the bulk ions in a wide region of the plasma, despite the increase of the NBI input power and subsequently the increase of the total ion heating. Nevertheless, diverse mechanisms can lead to such an increase of
Moreover, it could be noted that TCV pulse #76361 is mainly electron-heated, being the highly NB-injected fast-ion energy above the critical energy. Despite this, Ti,0 ≈ Te,0 at around t = 1.1 s (see Figure 6). This is, thereby, consistent with the decreased ion heat diffusivity picture that is displayed in Figure 8C.
As mentioned previously, SPR measurements allow us to measure the amplitude of electron density fluctuations in different phases of the TCV pulse #76361, reflecting the impact of the TAE on transport. The turbulence spectrum obtained with SPR is displayed in Figure 9, where the power spectral density is plotted against the frequency for the pre-TAE phase and for the phase with TAE. It should be noted that, due to NBI fuelling throughout the shot, the electron density profile and consequently the position of SPR cut-offs change in time. For Figure 9, different probing frequencies were selected so that both measurements are localized around the same radial range (ρψ = 0.58–0.62).
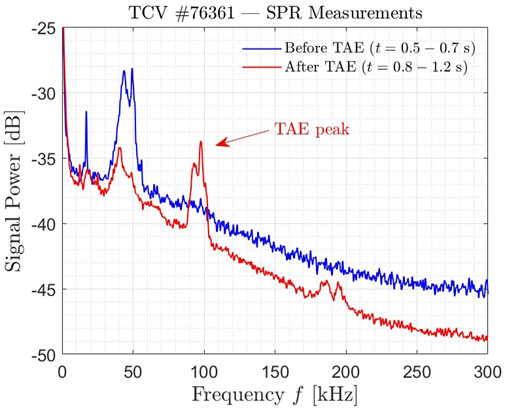
FIGURE 9. Signal from the short-pulse reflectometer channels integrated over specific time window for the TCV pulse #76361. Since the density varies along the pulse and thereby also the cut-off position of the SPR channels, multiple channels have been selected and then averaged to be within a very similar radial domain (ρψ =0.58−0.62).
To analyze the amplitude of the density perturbations, following the method introduced in [51], we would need to compute them accounting for different values of density gradient scale length Ln at the cut-off. Unfortunately, due to the variation of the density profile in time, the large error in determining Ln at the cut-off position as well as other experimental parameters rendered results of the analysis inconclusive, preventing us from confirming the effect of the TAE on the turbulence amplitude.
Nevertheless, Figure 9 clearly shows the destabilization of TAE in the spectrum, and the spectral power, which indirectly corresponds to the turbulence amplitude, does not increase with the appearance of TAE. It is, however, difficult to conclude about the effect of TAEs on the plasma confinement previously discussed by only analyzing such a spectral power.
In this section, the results of the gyrokinetic modelling with the Gene code, in the local (or flux-tube) limit [52], are reported. The TCV pulse #73461 (see Figure 2 has been analyzed at the flux surface ρψ = 0.65 for t = 0.6 s. This radial location has been chosen since the destabilized high-frequency modes, identified as TAEs [21], are peaking in the proximity of such a flux surface. This is also confirmed by the SPR measurements shown in the previous sections. The input parameters of the gyrokinetic simulations are provided by the integrated modelling TRANSP. The local values of the physical parameters that are employed in the gyrokinetic flux-tube simulations are reported in Table 1.
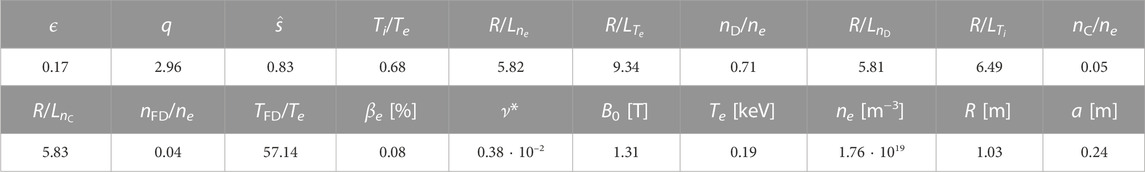
TABLE 1. Plasma parameters considered in Gene simulations modelling TCV pulse #73461 at ρψ =0.65 and t ≈0.6 s. Here, ϵ represents the inverse aspect ratio, n the species density normalized to the electron density, R/Ln,T the logarithmic density and temperature gradient normalized to the major radius R, βe the electron-beta, and ν*≡(ane/4|e|2ni)νei the normalized collision frequency, where a is the minor radius, e the electron charge and νei the Hinton-Hazeltine electron-ion collision rate [60]. Eventually, the normalization factors in standard units are also reported, i.e., the on-axis magnetic field strength B0, the local electron temperature Te and density ne, and the major radius R.
In its local version, the GENE code simulates only a flux-tube centered around the selected radial localization and with extent larger than the turbulent correlation length in the radial x and binormal y directions, and follows the magnetic field lines along the parallel coordinate z. Exploiting the periodic boundary conditions, the perpendicular domain can be treated with a spectral approach, and we will therefore make use of the wavenumbers kx and ky for respectively the radial and binormal coordinates. Thus, the perturbed distribution function is time-evolved in five dimensions, i.e., the aforementioned three spatial dimensions and the velocity component parallel to the magnetic field, v‖, and the magnetic moment, μ. The code can handle an arbitrary number of fully gyrokinetic species, and in this work we have used up to four species, which are electrons, thermal deuterium, carbon impurity and fast deuterium. Numerical convergence studies, both linearly and nonlinearly, have been performed, and the numerical grid has been chosen as
Therefore, in this section we will report firstly on the system linear stability from the ion-scale down to the electron-scale wavelengths without retaining the effects of the fast ions, and subsequently on the effect of the NBI fast ions on the linear microinstabilities and on the destabilization of fast-ion-driven modes. These will be, respectively, shown in subsections 3.2.1 and 3.2.2. Then, the nonlinear dynamics and the possible interactions between the various stable and unstable modes, as well as the impact of the zonal flows on the turbulence, is analyzed in subsection 3.2.3. The effects of the fast ions and of the fast-ion-driven instabilities on the nonlinear dynamics of the ion-scale turbulence is eventually discussed in subsection 3.2.4.
In Figure 10, the linear growth rate and the mode frequency computed by Gene are displayed as a function of the binormal wavenumber kyρs, respectively in panel (a) and (b). Different simulation setups are analyzed, in particular to check the effect of the carbon impurities on the system stability. The scope of such an investigation is to determine whether the inclusion of the carbon species would lead to substantial differences in the evaluation of the transport levels and properties. The linear growth rate spectra in Figure 10A do not show large differences, especially for what concerns the kyρs ≲ 0.5, that is where the nonlinear heat flux spectrum is expected to peak. Hence, the turbulent transport level is not expected to be strongly affected by the presence of the carbon species. Nevertheless, as it has already been shown for gyrokinetic analyses of TCV plasmas [61], the turbulence characteristics, such as the amplitude of the density fluctuations induced by the turbulence, may largely vary from the experimental measurements. A first signature is already visible in the linear mode frequency spectra in panel (b), where the cases without and with carbon present the same trend but different values of ω.
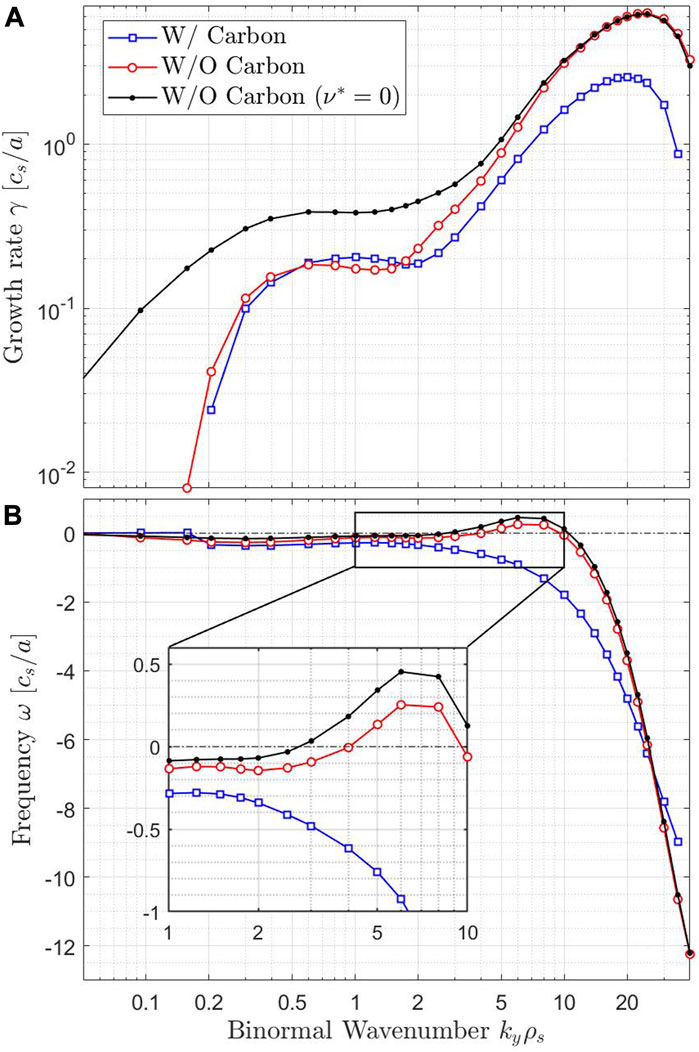
FIGURE 10. Linear growth rate γ (A) and mode frequency ω (B) computed by the Gene code are plotted as a function of the binormal wavenumbers kyρs up to the electron scales. Note that both x- and y-axis are in logarithmic scales. The inset in panel (B) represents a zoom over the region of transition between TEM/ubiquitous modes and ETG instabilities. These simulations do not include fast ions.
The low-ky region of the spectra (kyρs < 0.1) presents stable − or marginally stable − modes rotating in the ion diamagnetic direction (positive in the convention employed here). Hence, these are identified as stable ion temperature gradient driven (ITG) modes [62], and are not visible in the spectra of Figure 10. On the other hand, the ion-scale region, that is roughly the region for 0.1 < kyρs < 2, is dominated by trapped electron modes (TEMs) [63]. The TEMs extend up to kyρs ≈ 10 for the case without impurities, while in the case with impurities the transition to electron temperature gradient (ETG) occurs before with a smooth shift, as can be seen also in the zoom of panel (b) of Figure 10. Such a transition is consistent with previous analyses of unstable TEMs with ηe > 1 [64], where
Recent analyses showed that depending on the temperature ratio between ions and electrons, the electron-scale microturbulence could strongly influence also the transport at ion scales [66, 67]. However, in the nonlinear analyses, the dynamics of the ETGs are not taken into account in order to limit the computational cost. Future works should therefore address the complete multi-scale dynamics, ideally with possible experimental validation [68, 69]. It is to be noted, however, that retaining carbon impurities strongly decrease the ETG linear growth rate, and thereby further justifies the choice of not including ETG scales in the system.
In this subsection, we report the linear analyses of the TCV pulse #73461 at ρψ = 0.65 retaining the fast deuterium introduced by NBI. The distribution of the suprathermal ions has been computed numerically with the Monte-Carlo module NUBEAM [47] of the TRANSP integrated modelling. Thus, the distribution function at the radial location ρψ = 0.65 has been extracted and approximated with an equivalent Maxwellian by calculating an effective temperature. It should be underlined that this procedure could pose issues in accurately capturing the resonance in the fast-ion parameter space destabilizing the various instabilities, and also possibly affecting the growth rate of the ion-scale modes [70]. In order to evaluate the radial gradients for both density and temperature the same procedure has been performed for the grid-points of the whole radial domain. The resulting normalized gradients are
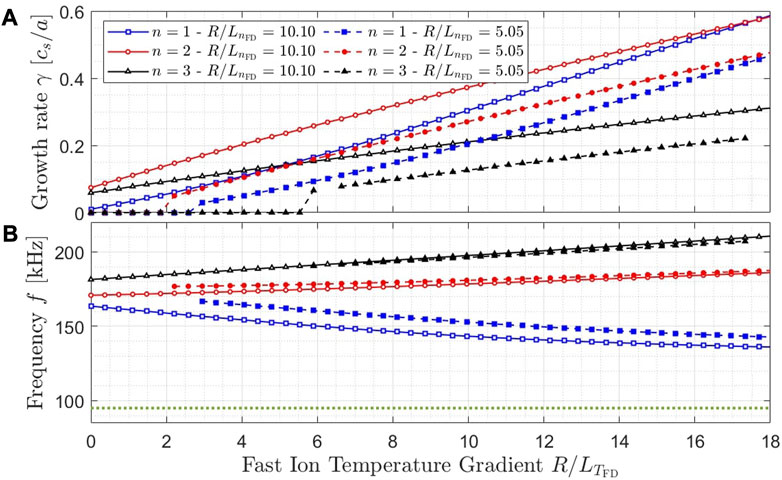
FIGURE 11. Linear growth rate γ (A) and mode frequency ω (B) computed by the Gene code are plotted as a function of the normalized fast ion temperature gradient
The growth rate increases dramatically with increasing
The mode frequency displayed in panel (b) does not strongly depend on the value of the fast ion pressure gradient, but more on the toroidal wavenumber. The n = 1 mode frequency slowly decrease with increasing
The results of the nonlinear simulations with the gyrokinetic Gene code in its local version are reported. As a first assessment, the effect of the carbon impurities on the turbulent transport in the system without retaining the supra-thermal ions is displayed in Figure 12. The TEM instability is the main drive for the turbulent transport, and this is reflected by a much higher electron heat flux with respect to the ion heat flux. The introduction of the carbon impurity in the system leads to a relatively important decrease of the turbulent transport level. For the electrons, the heat flux is decreased by a factor of 30% when the carbon is retained. Such an impact on the heat flux and turbulent density/temperature perturbations due to a more realistic modelling assumption with impurities and full electromagnetic fluctuations has also been observed in earlier TCV plasma simulations [61, 71]. It must be noted, however, that the nonlinear heat flux spectrum in both configurations peaks around kyρs ≈ 0.25–0.3 (not shown here for the sake of simplicity). In this specific region, the difference between the linear growth rates is less evident than at smaller-scales. As a matter of fact, the linear phase of the nonlinear evolution shows a very similar behaviour (see the time traces in Figure 12 for t ≲ 50 a/cs). Moreover, the main difference in the nonlinear spectra of the electrostatic potential averaged over the radial and parallel directions
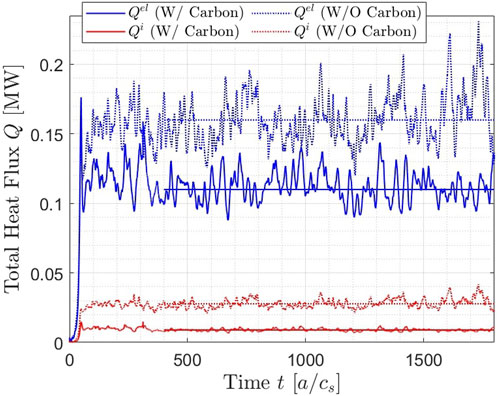
FIGURE 12. Total heat flux time traces for electrons (blue curves) and main ions (red curves) in the simulations without fast ions are shown in MW units. The solid lines and the dotted lines represent respectively the simulations with and without including the carbon impurities. The horizontal curves shows the averaged value of the heat fluxes over a representative time window of each simulation.
Next, equilibrium sheared flows, in both parallel and perpendicular components, have been applied in the Gene simulations in order to evaluate its effect on the plasma stability and turbulent transport. The value of the parallel γpfs and perpendicular γE×B flow shear is γpfs = γE×B = 0.018 cs/a, ensuring thus purely toroidal flow. It has been calculated from the TRANSP-computed toroidal angular velocity, which in turn is consistent with charge exchange experimental measurements. The resulting effect on the transport level and turbulence dynamics is very weak. The electron heat diffusivity is enhanced by only a factor of 1.0% and 2.7% in the case without and with impurities, respectively. Therefore, the impact of the E × B and of the parallel flow shears is negligible on the nonlinear TEM-driven fluxes. This is explained by the small flow shear rate value if compared to the linear growth rate peak at the ion scale (γTEM,peak ∼ 0.2 cs/a vs γE×B = 0.018 cs/a).
We have also analyzed the effects of the zonal fluctuations of the electrostatic potential, that are the zonal flows, on the saturated level of the turbulent transport induced by TEMs. Whereas the impact of the zonal flows on the Ion Temperature Gradient (ITG)-driven turbulence is well-established [10], the saturation of the TEM-driven turbulence is still debated [64, 72–75]. For this reason, we have performed additional simplified simulations with only electrons and main ion species and in the electrostatic regime, in which the evolution of the zonal (ky = 0) potential fluctuations has been turned off. While the non-inclusion of the carbon impurities in the system has already been demonstrated to modify the transport fluxes, the here employed electrostatic approximation is not expected to lead to a strong modification of the results. This is because the electron beta is very low (βe = 0.08%) and the electromagnetic fluxes are measured to be very low as well. As can be seen in Figure 13, when the zonal fluctuation evolution is zeroed out in the system the heat fluxes present a much larger saturated level. This suggests that the zonal flows play an essential role in the saturation of the TEM-induced fluxes in this TCV plasma. Such a result is in agreement with previous analyses of collisionless-TEM turbulence saturation [73, 74]. Indeed, the impact of the zonal flows on the TEM transport is reported to be dependent on the ratio Te/Ti [73]. In this TCV scenario, the electron temperature is around 1.5 times larger than the ion temperature at ρψ = 0.65. Such a temperature ratio has been shown to fall within a positive parameter-space region for the impact of zonal flows on TEM-driven turbulent transport [73]. Therefore, if the same kind of complex mechanism found in JET three-ion scheme scenario [11] is also active in this TCV scenario, the strong impact of the zonal flows on the TEM-saturation may be crucial for the reduction of the ion-scale turbulent transport.
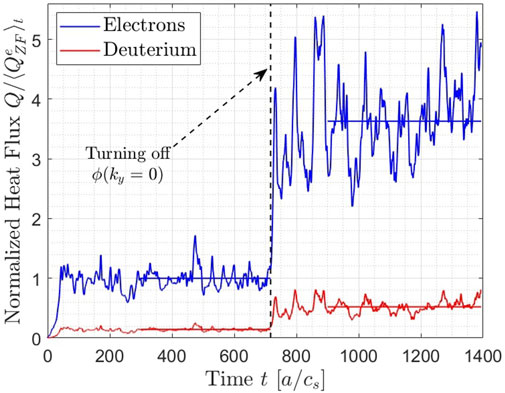
FIGURE 13. Time traces of the electron (blue) and main ion (red) heat fluxes. The vertical dashed line indicates the time at which the zonal fluctuations of the electrostatic potential ϕ are set to zero. To better visualize the discrepancies between the two phases, the fluxes are normalized to the average value of the electron heat flux for the simulation phase accounting for zonal fluctuations of ϕ. Note that the system considered here is in the electrostatic limit and does not include the carbon impurities.
Nevertheless, it should be highlighted that, for properly computing the radially extended structure of the zonal flows and for correctly evaluating their dynamics, a global approach is mandatory. This will be pursued in a future contribution.
Nonlinear flux-tube simulations including fast ions are then performed to determine the impact of the fast-ion-driven modes, found unstable in the linear simulations, on the local plasma properties. However, due to the large ρ⋆ inherent in the small-device TCV, the turbulent structures related to the low-ky wavenumbers included in the simulations undermined the reliability of the flux-tube − as well as the gyrokinetic − approximation. Indeed, the radial length of the turbulent structures induced by the fast-ion-driven modes was observed to be comparable with the radial box domain. Passing-through, radially elongated eddies were even observed when the radial domain was extended up to − and even beyond − the size of the machine. It should be stressed that the increase of the radial width of the box must be related to a corresponding increase of the considered radial kx modes in order to maintain the same radial resolution; hence, this is followed by a dramatic increase of the numerical cost of the simulation. An example of the radially elongated structures is displayed in Figure 14, where the perpendicular extension of the numerical box is reported in standard units allowing a direct comparison with TCV size (a major radius R0 = 0.88 m). This snapshot in time is plotted at the outboard mid-plane (z = 0) for the simulations with
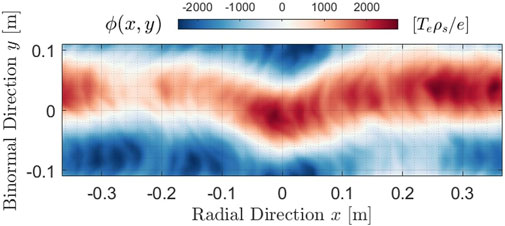
FIGURE 14. Contour plot of the electrostatic potential fluctuations ϕ as a function of the radial x and binormal y coordinate, taken at the outboard mid-plane at a specific timestep of the quasi-linear phase of the gyrokinetic simulation. This snapshot is taken from the simulation with fast ions with
To conclude this section on the modelling, it has been observed that the local gyrokinetic approximation employed in these analyses with the Gene code is not sufficient to grasp the accurate dynamics of the unstable fast-ion-driven modes. Global simulations are therefore required, since firstly the turbulence structures is way much larger than the few lowest mode rational surfaces and, moreover, the non-local effects may play an important role when evaluating the global level of turbulent transport in TCV [76–78]. For these reasons, future efforts will be dedicated to global modelling of the here discussed TCV scenario including bulk and fast-ion transport in flux-driven gyrokinetic simulations.
The impact of TAEs destabilized by the NB-injected fast ions on the plasma global confinement has been analyzed for a recently developed TCV scenario [21]. Appropriate modulations of the counter-current NBI input power allowed us to identify various phases of the pulse in which the effects of the TAEs on the plasma characteristics can be studied in detail. A first characterization of the various high-frequency modes systematically detected in the magnetic spectrogram has been carried out, including toroidal mode numbers identification and mode radial localization through multi-diagnostic analyses. The complex interaction between the identified modes can be studied through bicoherence analyses, revealing possible underlying three-wave couplings. This opens up the route towards more exhaustive − and yet more expensive − numerical simulations with global gyrokinetic models, which may be a crucial tool to explore the complex stability dynamics of this TCV scenario rich of fast-ion-driven instabilities.
Parameters such as the energy confinement time and the ion temperature are employed to determine the impact of the fast-ion-driven TAEs on the plasma confinement and performance, unveiling uncommon features. It is observed that the indicators all point towards an improved confinement in presence of unstable TAEs, with an increase of Ti and with no degradation of the total energy confinement time in spite of the increase of the NBI input power. Moreover detailed analysis reveals that a steep region of the ion temperature gradient overlaps with the radial range where the n = 1 TAE is experimentally detected. In order to determine whether this correspondence is due to the beneficial impact of the TAE or to other underlying mechanisms, more detailed analyses with advanced numerical codes are strongly required. At this stage, a clear conclusion on the beneficial impact of the TAE on the ion thermal confinement cannot be drawn.
Although the analysis on the SPR power spectrum may indicate that the electron density fluctuations are not increased in the presence of the TAE instability − i.e., the turbulent fluctuations are not increased − as shown in Figure 9, the impact of such instability on the turbulence cannot be easily inferred from this diagnostic alone. Indeed, uncertainties on the density profile reconstruction do not allow a good estimation of the density fluctuation amplitude. Therefore, since the NBI fuelling continuously increases the plasma density throughout the pulse, also the density gradients are expected to change. This affects the calculation of the electron density fluctuations measured by the SPR [79], and thereby the direct impact of fast ions and TAEs on the electron density fluctuations is not reported in this article.
Exploratory gyrokinetic simulations have been performed in the flux-tube approximation with the Gene code for one particular pulse of this TCV scenario at ρψ = 0.65, that is within the radial region at which the TAEs are experimentally detected. TEMs are identified as the dominant microinstability of the bulk plasma. Long-tails at small scales of hybrid TEM-ETG instability are also observed. The linear effect of the fast ions on the growth rate spectra is restricted to the low-ky region, while it is negligible for the rest of the spectrum. The saturation of the TEM-driven turbulent fluxes is shown to be strongly influenced by the zonal flows. Therefore, since the TAEs are expected to trigger a strong zonal flow activity [7], the turbulence suppression by TAE-generated zonal flows can be considered as a plausible explanation of this TCV scenario improved confinement, as was previously observed in other tokamaks [5, 11, 12, 80]. The linear frequencies of the fast-ion-driven modes, which are destabilized for the toroidal mode numbers n = 1, 2 and 3, are larger than the experimentally observed frequency of the n = 1 TAE. Nevertheless, large uncertainties especially on the fast-ion related parameters employed in the gyrokinetic simulations may strongly affect the results. Eventually, when retaining the fast ion species in the nonlinear simulations, the unstable fast-ion modes form streamer-like turbulent structures. These radially elongated eddies are systematically observed in the nonlinear simulations with fast ions, even when the radial box is enlarged up to almost the TCV device size. This issue is mainly due to the relatively large ρ⋆ in TCV tokamak. This observation undermines the inherent assumptions of the gyrokinetic and in particular of the local approximation, thereby invalidating the results of such nonlinear simulations with fast ions. More accurate global analyses are required to model the dynamics of the fast-ion-driven modes and their impact on the bulk turbulence in this TCV scenario with sufficient accuracy. Due to the high complexity and large computational cost of such analyses, this work is left for future contributions.
The raw data supporting the conclusions of this article will be made available by the authors, without undue reservation.
The reported TCV experiments were designed by MV and coordinated by MV, SM, SC and UK. SM performed gyrokinetic modelling and subsequent analysis, with fundamental help from JB, SB, AY, OK, JG, WL, BR and LV. Reflectometer analysis were conducted by UK and OK, and soft X-ray camera analysis were performed by LS. The original manuscript were written by SM, with major revisions from MV, UK and OK. JP provided crucial analysis on fast-ion-driven modes. YK and JO contributed to the experimental analysis. All authors contributed to the article and approved the submitted version.
M. Agostini, E. Alessi, S. Alberti, Y. Andrebe, H. Arnichand, J. Balbin, F. Bagnato, M. Baquero-Ruiz, M. Bernert, W. Bin, P. Blanchard, T.C. Blanken, J.A. Boedo, D. Brida, SB, C. Bogar, O. Bogar, T. Bolzonella, F. Bombarda, F. Bouquey, C. Bowman, D. Brunetti, J. Buermans, H. Bufferand, L. Calacci, Y. Camenen, S. Carli, D. Carnevale, F. Carpanese, F. Causa, J. Cavalier, M. Cavedon, J.A. Cazabonne, J. Cerovsky, R. Chandra, A. Chandrarajan Jayalekshmi, O. Chellaï, P. Chmielewski, D. Choi, G. Ciraolo, I.G.J. Classen, SC, C. Colandrea, A. Dal Molin, P. David, M.R. de Baar, J. Decker, W. Dekeyser, H. de Oliveira, D. Douai, M. Dreval, M.G. Dunne, B.P. Duval, S. Elmore, O. Embreus, F. Eriksson, M. Faitsch, G. Falchetto, M. Farnik, A. Fasoli, N. Fedorczak, F. Felici, O. Février, O. Ficker, A. Fil, M. Fontana, E. Fransson, L. Frassinetti, I. Furno, D.S. Gahle, D. Galassi, K. Galazka, C. Galperti, S. Garavaglia, M. Garcia-Munoz, B. Geiger, M. Giacomin, G. Giruzzi, M. Gobbin, T. Golfinopoulos, T. Goodman, S. Gorno, G. Granucci, J.P. Graves, M. Griener, M. Gruca, T. Gyergyek, R. Haelterman, A. Hakola, W. Han, T. Happel, G. Harrer, J.R. Harrison, S. Henderson, G.M.D. Hogeweij, J.-P. Hogge, M. Hoppe, J. Horacek, Z. Huang, AI, P. Innocente, K. Insulander Björk, C. Ionita-Schrittweiser, H. Isliker, A. Jardin, R.J.E. Jaspers, R. Karimov, A.N. Karpushov, YK, M. Komm, M. Kong, J. Kovacic, OK, O. Kudlacek, UK, R. Kwiatkowski, B. Labit, L. Laguardia, J.T. Lammers, E. Laribi, E. Laszynska, A. Lazaros, O. Linder, B. Linehan, B. Lipschultz, X. Llobet, J. Loizu, T. Lunt, E. Macusova, Y. Marandet, M. Maraschek, G. Marceca, C. Marchetto, S. Marchioni, E.S. Marmar, Y. Martin, L. Martinelli, F. Matos, R. Maurizio, M.-L. Mayoral, D. Mazon, V. Menkovski, A. Merle, G. Merlo, H. Meyer, K. Mikszuta-Michalik, P.A. Molina Cabrera, J. Morales, J.-M. Moret, A. Moro, D. Moulton, H. Muhammed, O. Myatra, D. Mykytchuk, F. Napoli, R.D. Nem, A.H. Nielsen, M. Nocente, S. Nowak, N. Offeddu, J. Olsen, F.P. Orsitto, O. Pan, G. Papp, A. Pau, A. Perek, F. Pesamosca, Y. Peysson, L. Pigatto, C. Piron, M. Poradzinski, L. Porte, T. Pütterich, M. Rabinski, H. Raj, J.J. Rasmussen, G.A. Rattá, T. Ravensbergen, H. Reimerdes, D. Ricci, P. Ricci, N. Rispoli, F. Riva, J.F. Rivero-Rodriguez, M. Salewski, O. Sauter, B.S. Schmidt, R. Schrittweiser, S. Sharapov, U.A. Sheikh, B. Sieglin, M. Silva, A. Smolders, A. Snicker, C. Sozzi, M. Spolaore, A. Stagni, L. Stipani, G. Sun, T. Tala, P. Tamain, K. Tanaka, A. Tema Biwole, D. Terranova, J.L. Terry, D. Testa, C. Theiler, A. Thornton, A. Thrysøe, H. Torreblanca, C.K. Tsui, D. Vaccaro, MV, M. van Berkel, D. Van Eester, R.J.R. van Kampen, S. Van Mulders, K. Verhaegh, T. Verhaeghe, N. Vianello, F. Villone, E. Viezzer, B. Vincent, I. Voitsekhovitch, N.M.T. Vu, N. Walkden, T. Wauters, H. Weisen, N. Wendler, M. Wensing, F. Widmer, S. Wiesen, M. Wischmeier, T.A. Wijkamp, D. Wünderlich, C. Wüthrich, V. Yanovskiy, J. Zebrowski
This work has been carried out within the framework of the EUROfusion Consortium, partially funded by the European Union via the Euratom Research and Training Programme (Grant Agreement No 101052200 — EUROfusion). The Swiss contribution to this work has been funded by the Swiss State Secretariat for Education, Research and Innovation (SERI). Views and opinions expressed are however those of the author(s) only and do not necessarily reflect those of the European Union, the European Commission or SERI. Neither the European Union nor the European Commission nor SERI can be held responsible for them. This work was supported in part by the Swiss National Science Foundation.
SM acknowledges A. Di Siena, T. Görler and F. Jenko for very useful discussion on the validity of the local flux-tube approximation in the Gene simulations. The simulations were performed on CSCS Piz Daint HPC system, in the framework of the projects s1097, s1100 and s1180.
The authors declare that the research was conducted in the absence of any commercial or financial relationships that could be construed as a potential conflict of interest.
All claims expressed in this article are solely those of the authors and do not necessarily represent those of their affiliated organizations, or those of the publisher, the editors and the reviewers. Any product that may be evaluated in this article, or claim that may be made by its manufacturer, is not guaranteed or endorsed by the publisher.
1. Lauber P. Super-thermal particles in hot plasmas—Kinetic models, numerical solution strategies, and comparison to tokamak experiments. Phys Rep (2013) 533(2):33–68. doi:10.1016/j.physrep.2013.07.001
2. Chen L, Zonca F. Physics of Alfvén waves and energetic particles in burning plasmas. Rev Mod Phys (2016) 88(1):015008. doi:10.1103/revmodphys.88.015008
3. Fu GY, Van Dam JW. Excitation of the toroidicity-induced shear Alfvén eigenmode by fusion alpha particles in an ignited tokamak. Phys Fluids B: Plasma Phys (1989) 1(10):1949–52. doi:10.1063/1.859057
4. Pinches SD, Chapman IT, Lauber PW, Oliver HJC, Sharapov SE, Shinohara K, et al. Energetic ions in ITER plasmas. Phys Plasmas (2015) 22(2):021807. doi:10.1063/1.4908551
5. Di Siena A, Görler T, Poli E, Bañon-Navarro A, Biancalani A, Jenko F. Electromagnetic turbulence suppression by energetic particle driven modes. Nucl Fusion (2019) 59(12):124001. doi:10.1088/1741-4326/ab4088
6. Chen L, Zonca F. Nonlinear excitations of zonal structures by toroidal alfvén eigenmodes. Phys Rev Lett (2012) 109(14):145002. doi:10.1103/physrevlett.109.145002
7. Qiu Z, Chen L, Zonca F. Effects of energetic particles on zonal flow generation by toroidal Alfvén eigenmode. Phys Plasmas (2016) 23(9):090702. doi:10.1063/1.4962997
8. Nocente M, Kazakov YO, Garcia J, Kiptily VG, Ongena J, Dreval M, et al. Generation and observation of fast deuterium ions and fusion-born alpha particles in JET D-3He plasmas with the 3-ion radio-frequency heating scenario. Nucl Fusion (2020) 60(12):124006. doi:10.1088/1741-4326/abb95d
9. Kazakov YO, Ongena J, Wright JC, Wukitch SJ, Bobkov V, Garcia J, et al. Physics and applications of three-ion ICRF scenarios for fusion research. Phys Plasmas (2021) 28(2):020501. doi:10.1063/5.0021818
10. Diamond PH, Itoh SI, Itoh K, Hahm TS. Zonal flows in plasma—A review. Plasma Phys Controlled Fusion (2005) 47:R35–R161. doi:10.1088/0741-3335/47/5/r01
11. Mazzi S, Garcia J, Zarzoso D, Kazakov YO, Ongena J, Dreval M, et al. Enhanced performance in fusion plasmas through turbulence suppression by megaelectronvolt ions. Nat Phys (2022) 18(7):776–82. doi:10.1038/s41567-022-01626-8
12. Mazzi S, Garcia J, Zarzoso D, Kazakov YO, Ongena J, Dreval M, et al. Gyrokinetic study of transport suppression in JET plasmas with MeV-ions and toroidal Alfvén eigenmodes. Plasma Phys Controlled Fusion (2022) 64(11):114001. doi:10.1088/1361-6587/ac91f3
13. Garcia J, Contributors JET. Electromagnetic and fast ions effects as a key mechanism for turbulent transport suppression at JET. Plasma Phys Controlled Fusion (2022) 64(10):104002. doi:10.1088/1361-6587/ac8613
14. Citrin J, Mantica P. Overview of tokamak turbulence stabilization by fast ions. Plasma Phys Controlled Fusion (2022) 65:033001. doi:10.1088/1361-6587/acab2b
15. Yoshida M, Giruzzi G, Aiba N, Artaud JF, Ayllon-Guerola J, Balbinot L, et al. Plasma physics and control studies planned in JT-60SA for ITER and DEMO operations and risk mitigation. Plasma Phys Controlled Fusion (2022) 64(5):054004. doi:10.1088/1361-6587/ac57a0
16. Iantchenko A. An experimental and computational study of tokamak plasma turbulence. PhD thesis. Ecole Polytechnique Fédérale de Lausanne (2023).
17. Iantchenko A, Brunner S, Coda S, Pueschel M. Gyrokinetic turbulence modeling of high performance scenario for JT-60SA. Submitted to Nuclear Fusion (2023).
18. Reimerdes H, Agostini M, Alessi E, Alberti S, Andrebe Y, Arnichand H, et al. Overview of the TCV tokamak experimental programme. Nucl Fusion (2022) 62(4):042018. doi:10.1088/1741-4326/ac369b
19. Vallar M, Karpushov AN, Agostini M, Bolzonella T, Coda S, Duval BP, et al. Status, scientific results and technical improvements of the NBH on TCV tokamak. Fusion Eng Des (2019) 146:773–7. doi:10.1016/j.fusengdes.2019.01.077
20. Geiger B, Karpushov AN, Lauber P, Sharapov S, Dreval M, Bagnato F, et al. Observation of Alfvén Eigenmodes driven by off-axis neutral beam injection in the TCV tokamak. Plasma Phys Controlled Fusion (2020) 62(9):095017. doi:10.1088/1361-6587/aba19e
21. Vallar M, Dreval M, Garcia-Munoz M, Sharapov SE, Poley J, Karpushov AN, et al. Excitation of toroidal Alfvén eigenmodes with counter-current NBI in the TCV tokamak. Nucl Fusion (2023) 63:046003. doi:10.1088/1741-4326/acb644
22. Hawryluk RJ. An empirical approach to tokamak transport. In: Physics of plasmas close to thermonuclear conditions. Elsevier (1981). p. 19–46.
23. Moret J-M, Duval BP, Le HB, Coda S, Felici F, Reimerdes H. Tokamak equilibrium reconstruction code LIUQE and its real time implementation. Fusion Eng Des (2015) 91:1–15. doi:10.1016/j.fusengdes.2014.09.019
24. Molina Cabrera P, Coda S, Porte L, Smolders ATCV Team. V-band nanosecond-scale pulse reflectometer diagnostic in the TCV tokamak. Rev Scientific Instr (2019) 90(12):123501. doi:10.1063/1.5094850
25. Fontana M, Porte L, Molina Cabrera P. Correlation electron cyclotron emission diagnostic in TCV. Rev Scientific Instr (2017) 88(8):083506. doi:10.1063/1.4997075
26. Testa D, Corne A, Farine G, Jacq C, Maeder T, Toussaint M. 3D, LTCC-type, high-frequency magnetic sensors for the TCV tokamak. Fusion Eng Des (2015) 96:989–92. doi:10.1016/j.fusengdes.2015.05.065
27. Testa D, Corne A, Jacq C, Maeder T, Toussaint M, Antonioni S, et al. LTCC magnetic sensors at EPFL and TCV: lessons learnt for ITER. Fusion Eng Des (2019) 146:1553–8. doi:10.1016/j.fusengdes.2019.02.127
28. Lauber P, Günter S, Könies A, Pinches SD. Ligka: A linear gyrokinetic code for the description of background kinetic and fast particle effects on the MHD stability in tokamaks. J Comput Phys (2007) 226(1):447–65. doi:10.1016/j.jcp.2007.04.019
29. Moret J-M, Buhlmann F, Fasel D, Hofmann F, Tonetti G. Magnetic measurements on the TCV tokamak. Rev Scientific Instr (1998) 69(6):2333–48. doi:10.1063/1.1148940
30. Crocker NA, Peebles WA, Kubota S, Fredrickson ED, Kaye SM, LeBlanc BP, et al. Three-wave interactions between fast-ion modes in the national spherical torus experiment. Phys Rev Lett (2006) 97(4):045002. doi:10.1103/physrevlett.97.045002
31. Garcia J, Kazakov YO, Coelho R, Dreval M, de la Luna E, Solano E, et al. Stable Deuterium-Tritium burning plasmas with improved confinement in the presence of energetic ions instabilities, to be submitted (2023).
32. Lanti E, Ohana N, Tronko N, Hayward-Schneider T, Bottino A, McMillan BF, et al. ORB5: A global electromagnetic gyrokinetic code using the PIC approach in toroidal geometry. Comp Phys Commun (2020) 251:107072. doi:10.1016/j.cpc.2019.107072
33. Betti R, Freidberg JP. Ellipticity induced Alfvén eigenmodes. Phys Fluids B: Plasma Phys (1991) 3(8):1865–70. doi:10.1063/1.859655
34. Sheikh UA, Simons L, Duval BP, Février O, Moret D, Allegrucci A, et al. RADCAM—a radiation camera system combining foil bolometers, AXUV diodes, and filtered soft x-ray diodes. Rev Scientific Instr (2022) 93(11):113513. doi:10.1063/5.0095907
35. Winsor N, Johnson JL, Dawson JM. Geodesic acoustic waves in hydromagnetic systems. Phys Fluids (1968) 11(11):2448–50. doi:10.1063/1.1691835
36. Melnikov AV, Vershkov VA, Eliseev LG, Grashin SA, Gudozhnik AV, Krupnik LI, et al. Investigation of geodesic acoustic mode oscillations in the T-10 tokamak. Plasma Phys Controlled Fusion (2006) 48(4):S87–S110. doi:10.1088/0741-3335/48/4/s07
37. Wang G, Peebles WA, Rhodes TL, Austin ME, Yan Z, McKee GR, et al. Multi-field characteristics and eigenmode spatial structure of geodesic acoustic modes in DIII-D L-mode plasmas. Phys Plasmas (2013) 20(9):092501. doi:10.1063/1.4819501
38. De Meijere CA, Coda S, Huang Z, Vermare L, Vernay T, Vuille V, et al. Complete multi-field characterization of the geodesic acoustic mode in the TCV tokamak. Plasma Phys Controlled Fusion (2014) 56(7):072001. doi:10.1088/0741-3335/56/7/072001
39. Fu GY. Energetic-particle-induced geodesic acoustic mode. Phys Rev Lett (2008) 101(18):185002. doi:10.1103/physrevlett.101.185002
40. Zarzoso D, Garbet X, Sarazin Y, Dumont R, Grandgirard V. Fully kinetic description of the linear excitation and nonlinear saturation of fast-ion-driven geodesic acoustic mode instability. Phys Plasmas (2012) 19(2):022102. doi:10.1063/1.3680633
41. Zarzoso D, Sarazin Y, Garbet X, Dumont R, Strugarek A, Abiteboul J, et al. Impact of energetic-particle-driven geodesic acoustic modes on turbulence. Phys Rev Lett (2013) 110(12):125002. doi:10.1103/physrevlett.110.125002
42. ITER. ITER Physics Expert Group on Confinement and Transport et al. Nucl Fusion (1999) 39:2175–249. doi:10.1088/0029-5515/39/12/302
43. Holcomb CT, Heidbrink WW, Ferron JR, Van Zeeland MA, Garofalo AM, Solomon WM, et al. Fast-ion transport in qmin > 2, high-β steady-state scenarios on DIII-D. Phys Plasmas (2015) 22(5):055904. doi:10.1063/1.4921152
44. Garcia-Munoz M, Fahrbach HU, Zohm HASDEX Upgrade Team. Scintillator based detector for fast-ion losses induced by magnetohydrodynamic instabilities in the ASDEX upgrade tokamak. Rev Scientific Instr (2009) 80(5):053503. doi:10.1063/1.3121543
45. Todo Y, Van Zeeland MA, Heidbrink WW. Fast ion profile stiffness due to the resonance overlap of multiple alfvén eigenmodes. Nucl Fusion (2016) 56(11):112008. doi:10.1088/0029-5515/56/11/112008
46. Todo Y. Introduction to the interaction between energetic particles and Alfvén eigenmodes in toroidal plasmas. Rev Mod Plasma Phys (2019) 3(1):1. doi:10.1007/s41614-018-0022-9
47. Pankin A, McCune D, Andre R, Bateman G, Kritz A. The tokamak Monte Carlo fast ion module NUBEAM in the National Transport Code Collaboration library. Comp Phys Commun (2004) 159(3):157–84. doi:10.1016/j.cpc.2003.11.002
48. Tardini G, Hobirk J, Igochine VG, Maggi CF, Martin P, McCune D, et al. Thermal ions dilution and ITG suppression in ASDEX Upgrade ion ITBs. Nucl fusion (2007) 47(4):280–7. doi:10.1088/0029-5515/47/4/006
49. Romanelli M, Zocco A, Crisanti F. Fast ion stabilization of the ion temperature gradient driven modes in the joint European torus hybrid-scenario plasmas: A trigger mechanism for internal transport barrier formation. Plasma Phys Controlled Fusion (2010) 52(4):045007. doi:10.1088/0741-3335/52/4/045007
50. Han H, Park SJ, Sung C, Kang J, Lee YH, Chung J, et al. A sustained high-temperature fusion plasma regime facilitated by fast ions. Nature (2022) 609(7926):269–75. doi:10.1038/s41586-022-05008-1
51. Krutkin O, Brunner S, Coda S. A method for density fluctuation measurements using pulse reflectometry. Nucl Fusion (2023) 63:076012. Accepted in. doi:10.1088/1741-4326/acd5e0
52. Jenko F, Dorland W, Kotschenreuther M, Rogers BN. Electron temperature gradient driven turbulence. Phys Plasmas (2000) 7(5):1904–10. doi:10.1063/1.874014
53. Crandall P, Jarema D, Doerk H, Pan Q, Merlo G, Görler T, et al. Multi-species collisions for delta-f gyrokinetic simulations: implementation and verification with GENE. Comp Phys Commun (2020) 255:107360. doi:10.1016/j.cpc.2020.107360
54. Miller RL, Chu M-S, Greene JM, Lin-Liu YR, Noncircular REW. Noncircular, finite aspect ratio, local equilibrium model. Phys Plasmas (1998) 5(4):973–8. doi:10.1063/1.872666
55. Terry PW. Suppression of turbulence and transport by sheared flow. Rev Mod Phys (2000) 72(1):109–65. doi:10.1103/revmodphys.72.109
56. Doyle EJ, Modelling W, Edge Y, Physics V, Edge T, Modelling A, et al. Chapter 2: plasma confinement and transport. Nucl Fusion (2007) 47(6):S18–S127. doi:10.1088/0029-5515/47/6/s02
57. Mazzi S, Camenen Y, Garcia J, Zarzoso D, Frigione D, Garzotti L, et al. Effects of the parallel flow shear on the ITG-driven turbulent transport in tokamak plasmas. Nucl Fusion (2022) 62(9):096024. doi:10.1088/1741-4326/ac7ac2
58. Di Siena A, Görler T, Doerk H, Bilato R, Citrin J, Johnson T, et al. Non-maxwellian fast particle effects in gyrokinetic GENE simulations. Phys Plasmas (2018) 25(4):042304. doi:10.1063/1.5020122
59. Bonanomi N, Mantica P, Di Siena A, Delabie E, Giroud C, Johnson T, et al. Turbulent transport stabilization by ICRH minority fast ions in low rotating JET ILW L-mode plasmas. Nucl Fusion (2018) 58(5):056025. doi:10.1088/1741-4326/aab733
60. Hinton FL, Hazeltine RD. Theory of plasma transport in toroidal confinement systems. Rev Mod Phys (1976) 48(2):239–308. doi:10.1103/revmodphys.48.239
61. Merlo G, Brunner S, Sauter O, Camenen Y, Görler T, Jenko F, et al. Investigating profile stiffness and critical gradients in shaped TCV discharges using local gyrokinetic simulations of turbulent transport. Plasma Phys Controlled Fusion (2015) 57(5):054010. doi:10.1088/0741-3335/57/5/054010
62. Romanelli F. Ion temperature-gradient-driven modes and anomalous ion transport in tokamaks. Phys Fluids B: Plasma Phys (1989) 1(5):1018–25. doi:10.1063/1.859023
63. Horton W. Drift waves and transport. Rev Mod Phys (1999) 71(3):735–78. doi:10.1103/revmodphys.71.735
64. Ernst DR, Lang J, Nevins WM, Hoffman M, Chen Y, Dorland W, et al. Role of zonal flows in trapped electron mode turbulence through nonlinear gyrokinetic particle and continuum simulation. Phys Plasmas (2009) 16(5):055906. doi:10.1063/1.3116282
65. Coppi B, Migliuolo S, Pu Y-K. Candidate mode for electron thermal energy transport in multi-keV plasmas. Phys Fluids B: Plasma Phys (1990) 2(10):2322–33. doi:10.1063/1.859497
66. Görler T, Jenko F. Scale separation between electron and ion thermal transport. Phys Rev Lett (2008) 100(18):185002. doi:10.1103/physrevlett.100.185002
67. Maeyama S, Watanabe T-H, Nakata M, Nunami M, Asahi Y, Ishizawa A. Multi-scale turbulence simulation suggesting improvement of electron heated plasma confinement. Nat Commun (2022) 13(1):3166–8. doi:10.1038/s41467-022-30852-0
68. Ruiz Ruiz J, Guttenfelder W, White AE, Howard NT, Candy J, Ren Y, et al. Validation of gyrokinetic simulations of a National Spherical Torus eXperiment H-mode plasma and comparisons with a high-k scattering synthetic diagnostic. Plasma Phys Controlled Fusion (2019) 61(11):115015. doi:10.1088/1361-6587/ab4742
69. Ruiz Ruiz J, Guttenfelder W, White AE, Howard NT, Candy J, Ren Y, et al. Quantitative comparisons of electron-scale turbulence measurements in NSTX via synthetic diagnostics for high-k scattering. Plasma Phys Controlled Fusion (2020) 62(7):075001. doi:10.1088/1361-6587/ab82de
70. Di Siena A, Görier T, Doerk H, Citrin J, Johnson T, Schneider M, et al. Non-maxwellian background effects in gyrokinetic simulations with GENE. J Phys Conf Ser (2016) 775:012003. IOP Publishing. doi:10.1088/1742-6596/775/1/012003
71. Merlo G. Flux-tube and global grid-based gyrokinetic simulations of plasma microturbulence and comparisons with experimental TCV measurements. PhD thesis. Ecole Polytechnique Fédérale de Lausanne (2016).
72. Merz F, Jenko F. Nonlinear saturation of trapped electron modes via perpendicular particle diffusion. Phys Rev Lett (2008) 100(3):035005. doi:10.1103/physrevlett.100.035005
73. Lang J, E Parker S, Chen Y. Nonlinear saturation of collisionless trapped electron mode turbulence: zonal flows and zonal density. Phys Plasmas (2008) 15(5):055907. doi:10.1063/1.2884036
74. Ernst DR, Burrell KH, Guttenfelder W, Rhodes TL, Dimits AM, Bravenec R, et al. Role of density gradient driven trapped electron mode turbulence in the H-mode inner core with electron heating. Phys Plasmas (2016) 23(5):056112. doi:10.1063/1.4948723
75. Mazzi S, Zarzoso D, Garcia J, Görler T, Di Siena A, Camenen Y, et al. Impact of fast ions on a trapped-electron-mode dominated plasma in a JT-60U hybrid scenario. Nucl Fusion (2020) 60(4):046026. doi:10.1088/1741-4326/ab74a1
76. McMillan BF, Lapillonne X, Brunner S, Villard L, Jolliet S, Bottino A, et al. System size effects on gyrokinetic turbulence. Phys Rev Lett (2010) 105(15):155001. doi:10.1103/physrevlett.105.155001
77. Merlo G, Huang Z, Marini C, Brunner S, Coda S, Hatch D, et al. Nonlocal effects in negative triangularity TCV plasmas. Plasma Phys Controlled Fusion (2021) 63(4):044001. doi:10.1088/1361-6587/abe39d
78. Mariani A, Brunner S, Merlo G, Sauter O. Global ‘zero particle flux-driven’ gyrokinetic analysis of the density profile for a TCV plasma. Plasma Phys Controlled Fusion (2023) 65:054005. doi:10.1088/1361-6587/acc96d
79. Krutkin O, Brunner S, Coda S, Aleynikov P. Linear scattering theory of short-pulse reflectometry. Plasma Phys Controlled Fusion (2022) 65(1):015013. doi:10.1088/1361-6587/aca826
Keywords: toroidal Alfven eigenmode, tokamak à configuration variable (TCV), fast ions, confinement, gyrokinetic simulations
Citation: Mazzi S, Vallar M, Kumar U, Krutkin O, Poley-Sanjuan J, Simons L, Ball J, Brunner S, Coda S, Garcia J, Iantchenko A, Kazakov YO, Lin WH, Ongena J, Rofman B, Villard L and the TCV team (2023) Study of fast-ion-driven toroidal Alfvén eigenmodes impacting on the global confinement in TCV L-mode plasmas. Front. Phys. 11:1225787. doi: 10.3389/fphy.2023.1225787
Received: 19 May 2023; Accepted: 30 August 2023;
Published: 22 September 2023.
Edited by:
Elena Belova, Princeton Plasma Physics Laboratory (DOE), United StatesReviewed by:
Jacobo Varela Rodríguez, Universidad Carlos III de Madrid de Madrid, SpainCopyright © 2023 Mazzi, Vallar, Kumar, Krutkin, Poley-Sanjuan, Simons, Ball, Brunner, Coda, Garcia, Iantchenko, Kazakov, Lin, Ongena, Rofman, Villard and the TCV team. This is an open-access article distributed under the terms of the Creative Commons Attribution License (CC BY). The use, distribution or reproduction in other forums is permitted, provided the original author(s) and the copyright owner(s) are credited and that the original publication in this journal is cited, in accordance with accepted academic practice. No use, distribution or reproduction is permitted which does not comply with these terms.
*Correspondence: S. Mazzi, c2FtdWVsZS5tYXp6aUBjZWEuZnI=
aThe TCV team authors are listed at the end of the article
†These authors have contributed equally to this work
Disclaimer: All claims expressed in this article are solely those of the authors and do not necessarily represent those of their affiliated organizations, or those of the publisher, the editors and the reviewers. Any product that may be evaluated in this article or claim that may be made by its manufacturer is not guaranteed or endorsed by the publisher.
Research integrity at Frontiers
Learn more about the work of our research integrity team to safeguard the quality of each article we publish.