
95% of researchers rate our articles as excellent or good
Learn more about the work of our research integrity team to safeguard the quality of each article we publish.
Find out more
ORIGINAL RESEARCH article
Front. Phys. , 06 July 2023
Sec. Optics and Photonics
Volume 11 - 2023 | https://doi.org/10.3389/fphy.2023.1224726
 Qiang Fu1,2
 Yue Zhang2Yingchao Li1,2Yi Liu3Yining Yang4Xuemin Zhang3Longxiao Wang5Yang Tai5Jiazhuo Liu5Zhuang Liu1,6*Chao Wang1,2
In order to meet the requirements of target detection at different distances in infrared polarization detection, a transmission-type long-wave infrared polarization zoom optical system is designed, can zoom in 18–90 mm and the wavelength range is 8–14 μm. The spatial resolution is 0.18–0.9 mrad, and the machining and assembly errors are analyzed. Based on BRDF and Stokes vector model, aluminum is spontaneous emission, and reflected emission characteristics under specific conditions are simulated and analyzed. Infrared polarization imaging and island imaging experiments verify the unique advantages of infrared polarization technology in distinguishing natural and manufactured objects, metal and non-metal, and high-temperature object recognition. The changing trend of contrast between infrared intensity image and polarization image with solar altitude angle is explored, providing theoretical support for developing an infrared photoelectric detection field.
Any target will produce specific polarization characteristics when it reflects and radiates electromagnetic waves. The polarization characteristics are determined by the physical and chemical characteristics, roughness, water content, and other factors of the material composed of the target. Generally, manufactured objects have unnatural smooth surfaces, and their reflective or radiative polarization performance is vital. The natural background surface is rough, and the reflective and radiative polarization is weak. Therefore, the infrared polarization detection system can extract useful information from the complex natural background, detect manufactured targets, and improve targets’ detection and recognition ability. Compared with non-polarization imaging, the medium wave infrared polarization imaging technology extends the traditional two-dimensional space and intensity of three-dimensional radiation detection to the five-dimensional detection space with increased polarization degree and polarization angle, which can effectively overcome the obstacles posed by some exceptional natural environment and climate conditions to reconnaissance and enhance the detection capability of the infrared imaging system [1]. In particular, when the target is in a complex scene such as underwater and on foggy days, practical information is absorbed or scattered, resulting in low contrast between the target and the background. It is difficult to identify the target through intensity and wavelength detection. Polarization detection can improve image quality and target imaging clarity [2, 3]. The infrared spectral polarization imaging system researchers at home and abroad began to explore in many ways in the 1980s [4–9].
Research on transmission characteristics of infrared polarized light in a complex environment can provide reference value in infrared polarization imaging, target recognition and detection, security monitoring and many other fields. It has the advantages that traditional infrared imaging and polarization imaging do not have and has excellent research significance. This paper uses a transmission zoom optical system to meet the detection requirements of different range scenes in target detection. The imaging quality and processing error meet the current processing application level. Secondly, based on the bidirectional reflection distribution function and Stokes vector model, the spontaneous emission and reflected emission characteristics of metal aluminum under specific conditions are simulated and analyzed, which provides a theoretical basis for the research of infrared radiation. Finally, the infrared polarization imaging characteristics of different indoor and outdoor targets are studied, the contrast change rules of infrared images under different sun azimuth angles are summarized, and the image fusion processing is based on the combination of multi-band and multi-dimension information of LWIR. The unique advantages of infrared polarization detection in distinguishing natural and manufactured objects, identifying high-temperature objects, and inhibiting stray light from penetrating haze are revealed.
Infrared polarization imaging is based on infrared thermal imaging, which uses the polarization characteristics of light to obtain infrared polarization images of objects (targets and backgrounds). The methods to describe the polarization state of light waves include Jones vector representation and Stokes vector representation. The former is not suitable for describing any polarization state of light. In contrast, the latter can describe fully polarized light, partially polarized light and completely unpolarized light, which are expressed as follows by Stokes parameter:
Stokes vector symbols represent wherein S0, S1, S2, and S3, IRCP is right-handed circular polarization, ILCP is left-handed circular polarization; S0 is the total incident light intensity; S1 is the intensity difference between the 0°linear polarization component and the 90°linear polarization component; S2 is the intensity difference between the 45°linear polarization component and the 135°linear polarization component; S3 is related to the circular polarization of left and proper rotation. Since the Stokes parameter representation has four independent parameters, it requires at least four equations to solve the Stokes parameter of the target point. However, in nature, the circular polarization component of the target scene is tiny, So it is generally assumed that S3 = 0. Therefore, in actual measurement, it is only necessary to measure the light intensity of the linear polarization component at three different angles to obtain the Stokes parameter and polarization state [10–12]. The Muller matrix can represent the change in light polarization caused by optical elements. The transmission axis of an ideal linear polarizer is aligned with the X-axis θ azimuth. The stokes vector S′ of the outgoing light can be obtained by multiplying the Muller matrix of the polarizer by the Stokes vector S of the incoming light, that is
The output light intensity is expressed as:
The degree and angle of polarization can be expressed by the Stokes parameter.
After the polarization state decomposition, scanning and angle coding of the target scene light wave, the polarization information of the scene light wave can be calculated from the light intensity response of each pixel of the detector to form Stokes parameter images, that is, S0 images, S1 images, S2 images, and then DOP images and AOP Image.
When a beam of light is incident at different angles, the reflection characteristics of the light wave on the object’s surface can be represented by the bidirectional reflection distribution function (BRDF) [13]. The change rule of the reflected light is mainly determined by the wavelength, phase, object surface roughness, incidence angle, reflection angle and other parameters of the light wave. The azimuth relationship of light waves is shown in Figure 1.
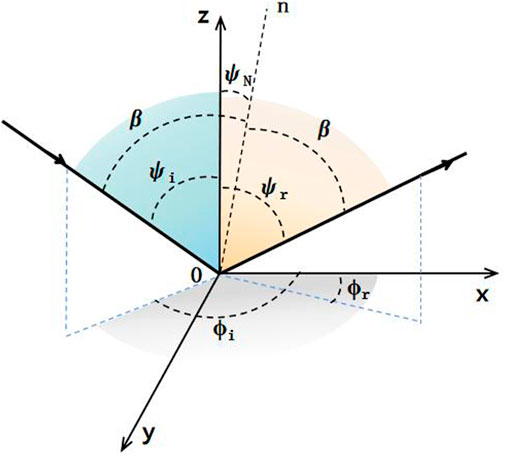
FIGURE 1. Geometric relationship of bidirectional reflection distribution function model.
Among ψi is the zenith angle of the incident light wave, ψr is the zenith angle of the outgoing light wave, ψN is the angle between the object surface and the microelement surface, ϕi and ϕr is the azimuth angle formed by the incident light and the outgoing light in the system. The probability distribution functions of different micro facets can be obtained by adjusting the incident zenith angle, β. It represents the angle between the incident direction of the light wave and the micro panel average n.
The concept of BRDF(Bidirectional Reflectance Distribution Function) was proposed by American physicist Nicodemus [14], which can represent the reflection characteristics of light waves on the surface of objects when light is incident at different angles. Priest and Germer are improved to P-G (Priest Germer) model based on the T-S (Terrace Sparrow) model [15], which regards the microfacet light wave reflection as specular reflection. The mathematical expression of the P-G model is:
Where: Lr (ψi, ϕi, ψr, ϕr,λ) Represents the radiance of reflected light after the light wave passes through the object surface; Ei (ψi, ϕi,λ) Represents the incident light irradiance; σ Indicates the surface roughness; λ Represents the wavelength of the incident light.
When the included angle and roughness between the object surface and the microelement surface are fixed values, changing the incident zenith angle and the reflected zenith angle of the light wave can obtain the change rule of the BRDF of the plane point. In order to obtain the polarization state of light waves, the micro panel theory is usually extended to the field of infrared polarization through the Fresnel-Mueller matrix.
Where: F (ψi, ϕi,ψr, ϕr,λ) is a matrix function; M(ψi, ϕi, ψr, ϕr,λ) is 4 × 4 in size. After the incident light vector Sin passes through the Fresnel Muller matrix system, the outgoing light vector Sout is
The elements (m00, m01, m02, m03) in the first row of the Fresnel Muller matrix affect the size of Sout0. Similarly, the elements in rows 2, 3 and 4 of the matrix affect the size of Sout1, Sout2 and Sout3,respectively. When the incident light is natural, the active Fresnel Muller matrix element is [m00 m10 m20 m30]T. At this time, the Fresnel Muller matrix can be obtained according to the Jones matrix, then
Where: T*ss, T*ps, T*sp, T*pp respectively represent the conjugate complex of Tss, Tps, Tsp, Tpp; Tss, Tps, Tsp, Tpp can be obtained by the transformation of Jones matrix, and the calculation formula is
Where: RS and RP represent the reflectivity of the Fresnel vertical component and parallel component, respectively, and their expressions are
Where: ψj represents the refraction angle formed by light passing through the object surface; n1 is the refractive index of air; nt(λ) Represents the refractive index of the target material.
It can be seen from the above analysis that the BRDF of the polarization state obtained by the conversion of the incident light can be transformed into the pBRDF (polarization bidirectional reflection distribution function). Therefore, the state transition process of the light wave passing through the polarization system can be expressed as:
Where: Fij represents the polarization conversion function, where i, j = 1, 2, 3, 4. Since the circular polarization component of the incident light is tiny, pBRDF can degenerate into a third-order matrix. The degenerated matrix function can be expressed as:
According to the linear polarization degree formula and the state transition formula of incident light and outgoing light, the reflective polarization characteristics of environmental thermal radiation can be analyzed.
When the temperature exceeds absolute zero, the object will continuously emit heat radiation to the outside through the surface. The intensity of self-heating radiation is mainly affected by material type, surface roughness, physical and chemical structure and coating thickness. In self-healing and radiation, objects will also produce a polarization effect. The infrared polarization imaging system can analyze objects’ infrared polarization characteristics at the macro level. When the energy lost by thermal radiation penetrating the object is not considered, it can be obtained according to the energy conservation law and Kirchhoff’s law [16].
Where: ε(λ,ψi) Indicates the self heating radiation of the object. By introducing the above formula into the field of polarization
Where: εS and εP represent the vertical and parallel components of the object’s self-heating radiation, respectively. The degree of polarization of the object’s self-heating radiation can be expressed as:
Combining Eqs 16, 17, the linear degree of polarization model can be changed to
It can be seen from Formula (18) that the degree of polarization of the object’s self-heating radiation line is a function related to the reflectivity of the parallel component and the reflectivity of the vertical component of the light wave. When the object radiation is all vertical component reflectivity or parallel component reflectivity, the degree of polarization of the thermal radiation line is constant. When the reflectivity of the vertical component of the object radiation is equal to that of the parallel component, the self heating radiation of the object is in an unbiased state.
The simulation conditions are set as follows: the incidence angle of environmental thermal radiation is 45°, the target material is aluminum, the complex refractive index is n2 = 1.24 + 6.60i, and the surface roughness is 2.16 μm. The refractive index of air is n1 = 1.0. Figure 2A shows the change rule of RS and RP with observation angle and the change rule of DOLP (Degree of linear polarization) with observation angle. In the process of reflection after the environmental thermal radiation hits the target surface, the reflectivity of each component of the target increases with the observation angle. The vertical component of the reflected radiation is always more significant than the parallel component. The degree of infrared polarization first increases and then decreases with the increase of the observation angle. The degree of linear polarization reaches the maximum near the observation angle of 70°.
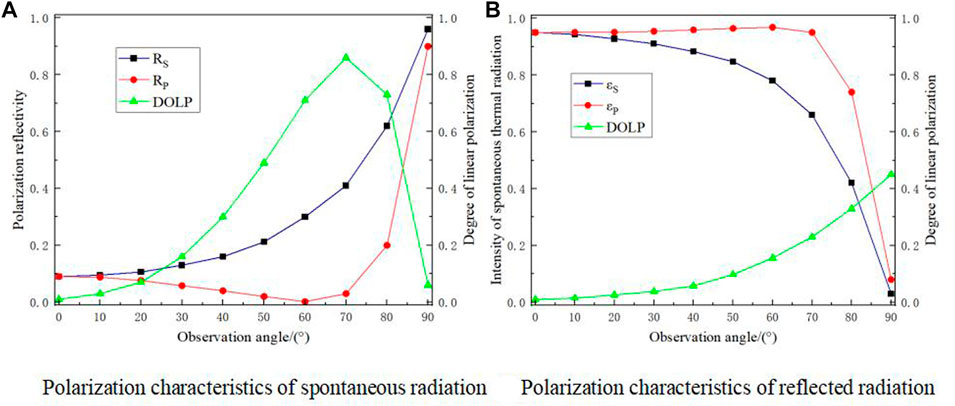
FIGURE 2. Polarization characteristic simulation diagram (A) Polarization characteristics of spontaneous radiation (B) Polarization characteristics of reflected radiation.
Figure 2B shows the change rule of reflectivity and linear polarization degree of each component of self-heating radiation with the observation angle. In the process of target self-heating and radiation, the parallel component is always more significant than the vertical component. The linear polarization degree of target self-heating radiation is positively correlated with the observation angle. The larger the observation angle is, the greater the linear polarization degree is.
The infrared system adopts a long-wave 640 × 512 unrefrigerated focal plane array detector with a pixel size of 17 μm × 17 μm, Operating band is 8–14 μm. Because the system aperture is relatively small, combined with the advantages of transmission structure, such as easy correction of difference, easy processing and assembly, the transmission structure is adopted. The design results of the optical system are shown in Table 1, and the two-dimensional structure of the optical system is shown in Figure 3.
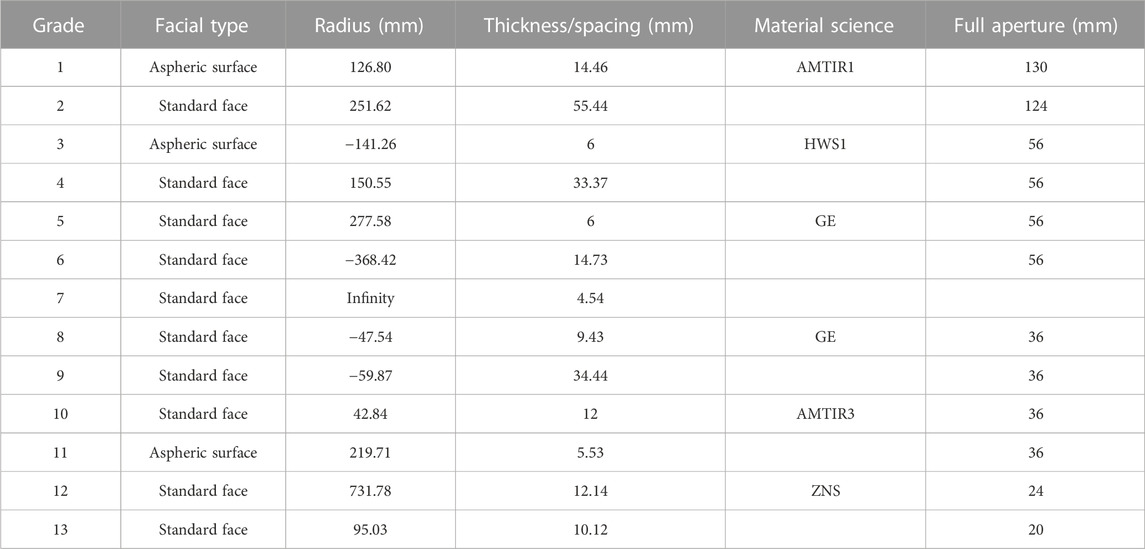
TABLE 1. System optical design results.
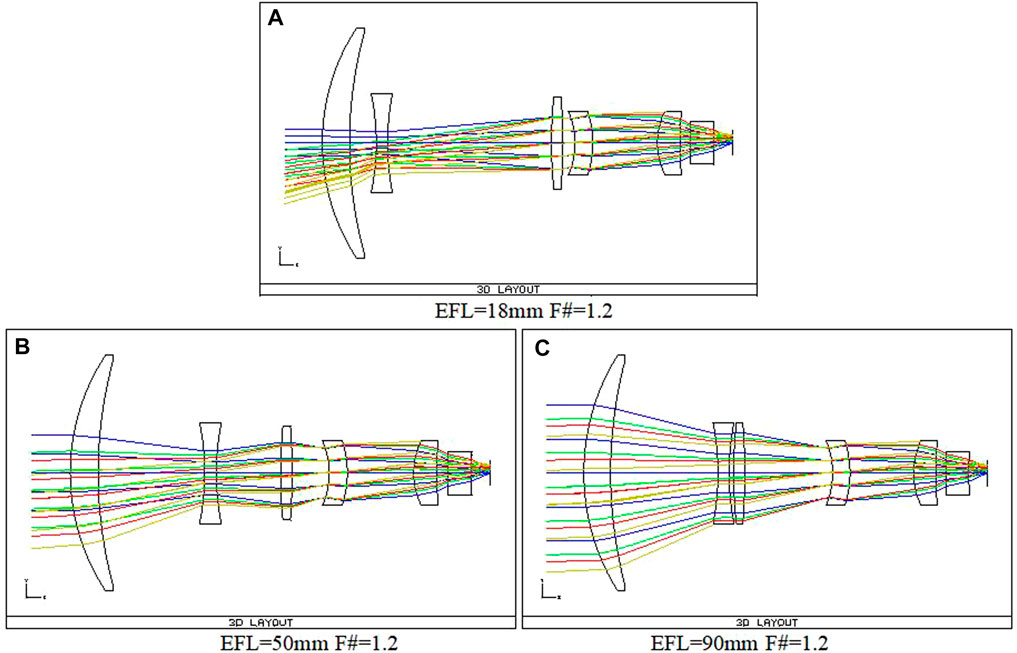
FIGURE 3. Two dimensional structure diagram of optical system (A) EFL (Effective Focal Length) = 18 mm F# = 1.2 (B) EFL = 50 mm F# = 1.2 (C) EFL = 90 mm F# = 1.2.
The imaging quality of the optical system is shown in Figure 4. The figure shows the system’s MTF (Modulus Transfer Function) curve. It can be seen that even at 30 line pairs (corresponding to the pixel size of 17 µ m), the image quality of each zoom position is close, the MTF value of each position is more significant than 0.1, and the central field of view is about 0.5–0.6, which proves that the system has the excellent image quality and can be imaged with high resolution.

FIGURE 4. MTF curve of optical system (A) MTF curve with focal length of 18 mm (B) MTF curve with focal length of 50 mm (C) MTF curve with focal length of 90 mm.
The tolerance analysis of the system’s processing error and assembly and adjustment error is carried out, respectively. The transmission element’s processing error aperture of spherical and aspherical lenses is ±2. The curvature radius error is given according to the manual requirements of the Class A standard for different radii. The local aperture error TIRR is ±0.02, the surface eccentricity error TSDX(Y) is ±0.02 mm, the wedge angle error TSTX Y) is 30″, and the surface thickness error TTHI is ±0.02 mm. The processing error of components with processing capability is given in Table 2, which reaches the limit of the existing processing capability.
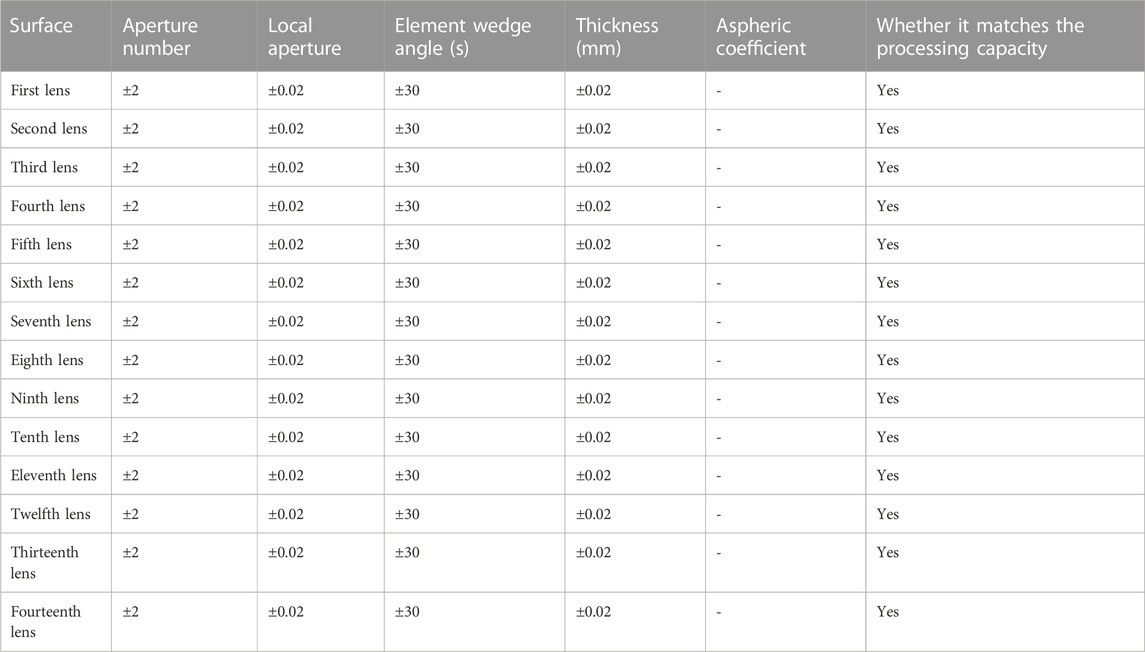
TABLE 2. Processing error table.
The eccentricity error of the transmission element is ±0.02 mm, the position error is ±0.02 mm, and the tilt error is ±1'. The eccentricity error of the reflecting element is ±0.02 mm, the position error is ±0.02 mm, and the tilt error is ±10". The assembly and adjustment errors of components are shown in Table 3. The assembly accuracy of primary and secondary mirrors reaches the limit of the existing assembly and adjustment capacity.
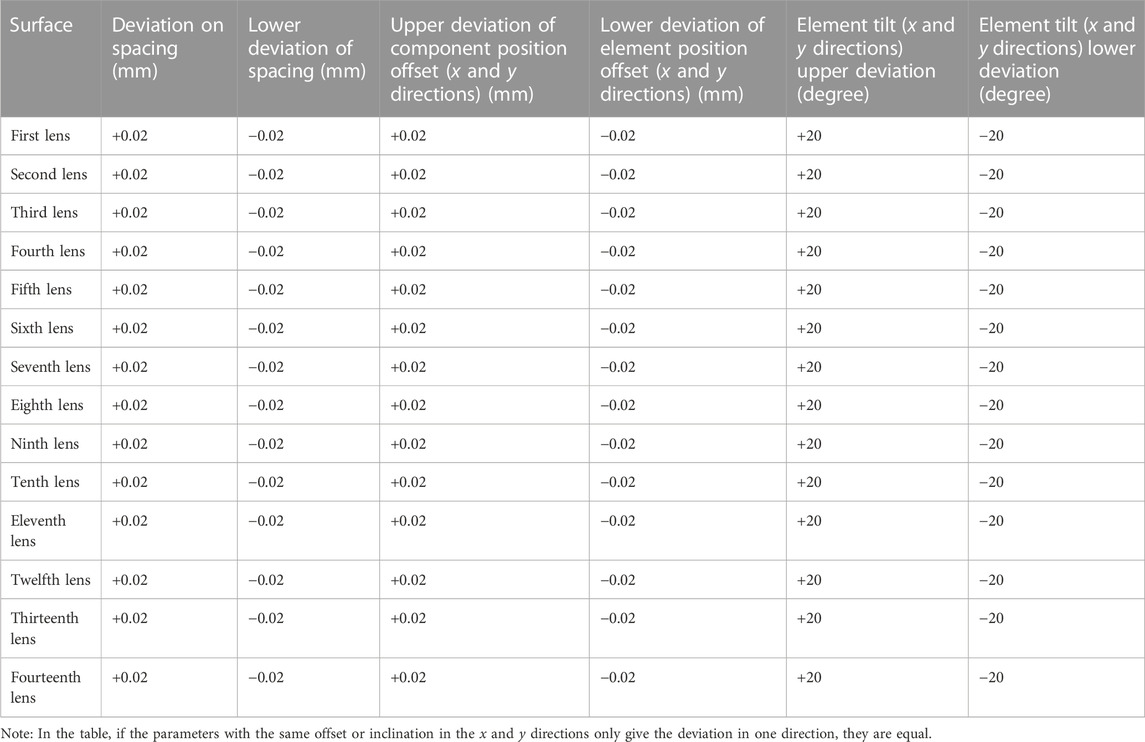
TABLE 3. Assembly tolerance of optical System.
The system adopts a focal plane real-time imaging method, and the imaging principle is shown in Figure 5. Micro polarizer array uses thin metal film or plasma etching to produce polarizers with small structures on the surface of thin metal films or substrates. Commonly used materials include germanium, cadmium sulfide, silicon, zinc selenide, etc. It has the advantages of improving detector sensitivity, enhancing anti-interference ability, and lightweight miniaturization.
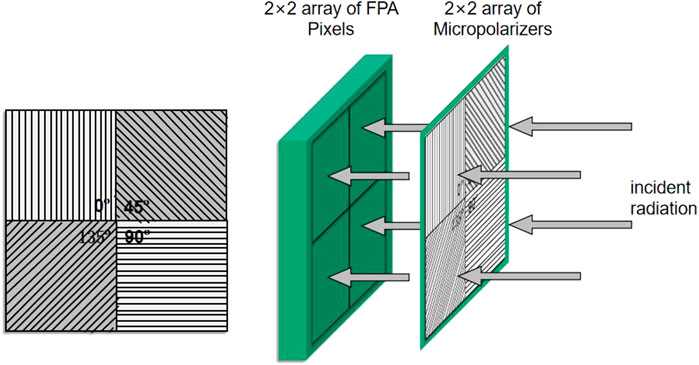
FIGURE 5. Principle of focal plane imaging
Integrate the micro polarizer array directly onto the photosensitive chip of the detector, ensuring that each unit has the same size and is aligned with the pixel units of the photosensitive chip one by one. Design polarizers in the 0°, 45°, 90°, and 135° directions on the micro polarizer array. The only light that conforms to a specific polarization direction can reach the detector when light passes through the micro polarizer array, corresponding to the light intensity images (
In this experiment, the infrared polarization camera is used to take pictures of different targets, and four polarization angle images of different targets are obtained simultaneously. The polarization degree and polarization angle images of targets are obtained through real-time fusion processing. The principle of infrared polarization imaging is shown in Figure 6.
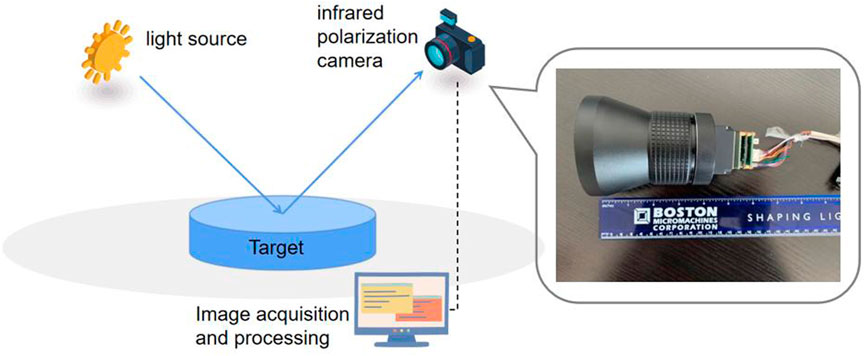
FIGURE 6. Schematic of long-wave infrared polarization imaging.
According to the simulation analysis results, the observation angle of about 70° is selected for the imaging test. Figure 7 shows the traditional visible light image and the scene’s long wave infrared polarization image 500 m away. It can be seen from the polarization degree image in Figure 7C) that the contrast between the people in the activity and the background is very high due to their radiation. The sidelines of the sports ground can also be seen, the metal plates on the fence are very obvious, and the polarization effect of car windows and car bodies parked outside the fence is noticeable. From the polarization angle image in Figure 7D), it can be observed that the detailed contour information of the target is highlighted. With the reduction of the imaging distance, the detailed information of the target is more abundant, especially the eaves carving lines near are clear. The experimental results show that long-wave infrared polarization imaging can detect and identify targets at the same time and improve the contrast of targets. The infrared polarization imaging technology combining polarization information and infrared radiation information can improve the operating range of the imaging system.
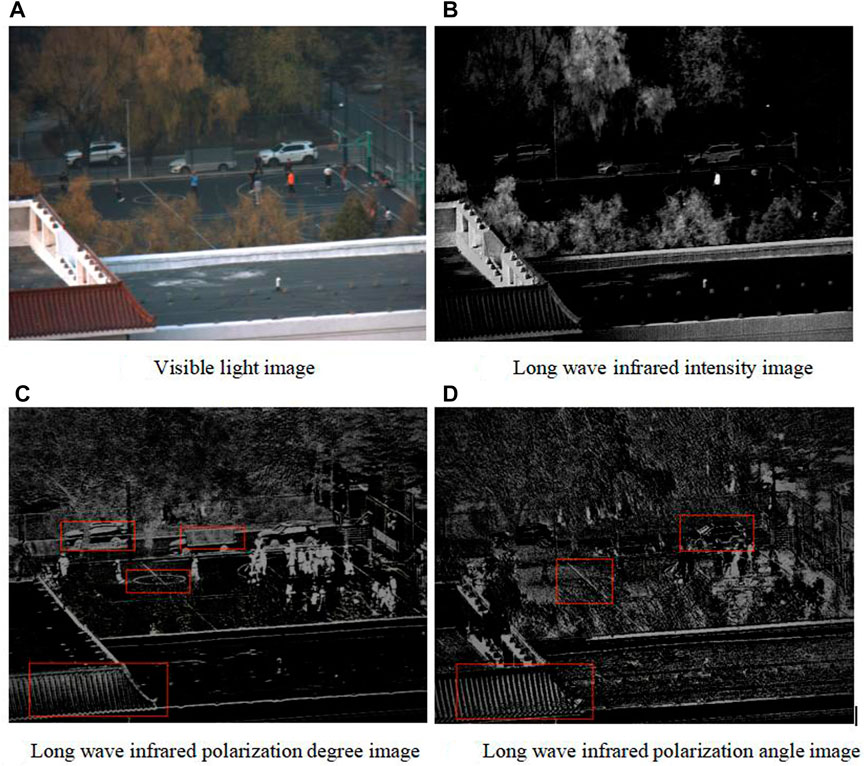
FIGURE 7. Distant Scenery Image (A) Visible light image (B) Long wave infrared intensity image (C) Long wave infrared polarization degree image (D) Long wave infrared polarization angle image. Reproduced from Design and Experimental Analysis of Micropolarization Array Based on a Long-Wave Infrared Optical System by Fu et al., licensed under CC BY 4.0, [17].
Undersea fog weather conditions, buildings at 0.848 km, buildings at 2.02 km, and islands at 6.5 km were imaged at different times (ten o’clock: Solar zenith angle is 50°14’, eleven o’clock: Solar zenith angle is 52°54’, twelve o’clock: Solar zenith angle is 54°50’, thirteen o’clock: Solar zenith angle is 50°52’) at the harbor dock. Simultaneously obtain four polarization angle images of different types of targets, and use (formulas 1formulas –formulas 4) for real-time fusion processing to obtain the target’s longwave infrared polarization degree image. Figure 8 shows three experimental test targets obtained using an industrial camera.
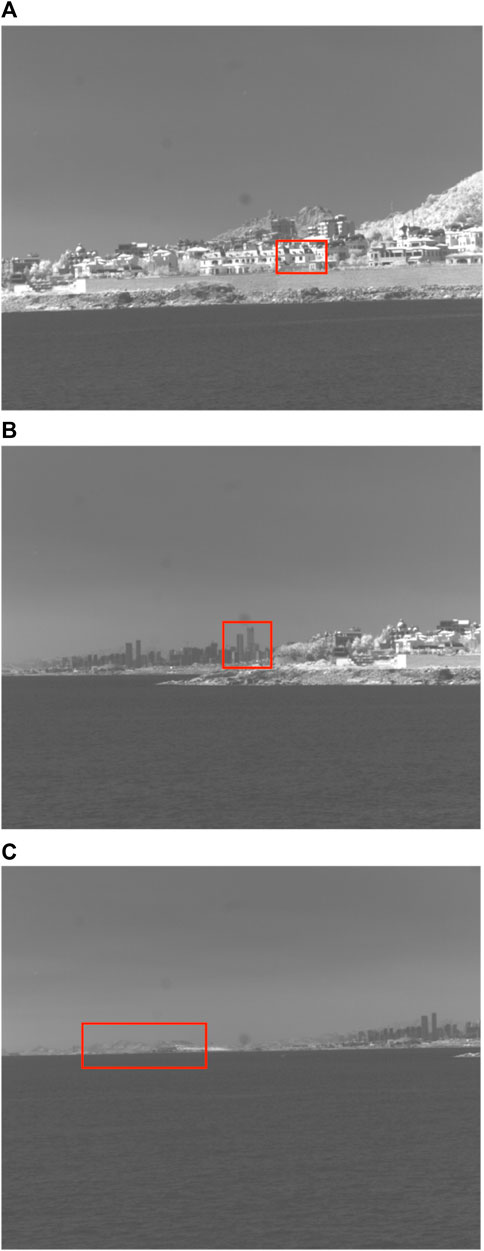
FIGURE 8. Experimental Test Objectives (A) Near building at 0.848 km (B) Far building at 2.02 km (C) Island at 6.5 km.
Target/background contrast C is:
Where, I0 represents target radiation intensity and Ib represents background radiation intensity.
The contrast curve between the long wave infrared intensity image and the polarization image is shown in Figure 9.
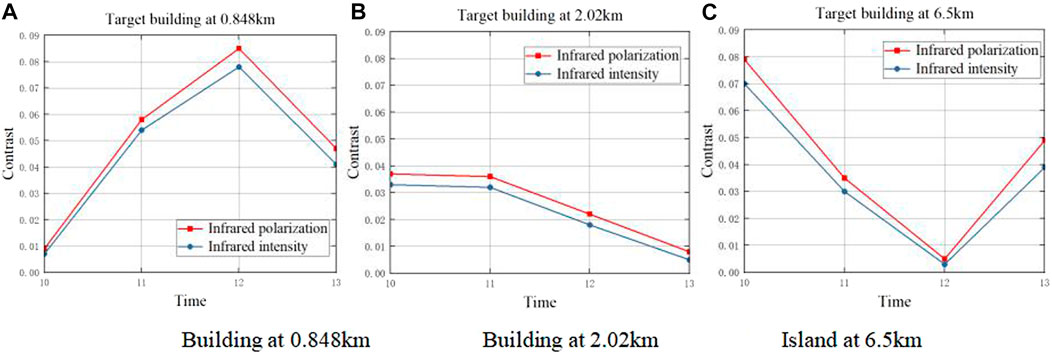
FIGURE 9. Time varying curve of LWIR intensity polarization image contrast of different near and far targets. (A) Building at 0.848 km (B) Building at 2.02 km (C) Island at 6.5 km.
It can be seen from Figure 9A) that the contrast of 0.848 km building’s long wave infrared polarization imaging is maintained at 0.009–0.085, and the contrast of polarization changes by time is 89%; The contrast of the long wave intensity imaging is maintained at 0.007–0.078, and the contrast changes 91% with time. The polarization ratio intensity is less affected by the change of solar altitude angle with time; The contrast of long wave infrared polarization imaging is higher than that of long wave intensity imaging, which is 1.07–1.29 times higher. Because buildings, buildings and islands all choose the sky as the background, polarization imaging can effectively suppress the stray light caused by the scattering of atmospheric particles; It can be seen from Figure 9B) that the contrast of the long wave infrared polarization imaging of a 2.02 km building is maintained at 0.007–0.037, the time variation amplitude is 81%, the contrast of the visible light intensity imaging is maintained at 0.005–0.033, and the time variation amplitude is 85%. The contrast of visible light polarization imaging is 1.12–1.4 times higher than that of intensity imaging. Polarization imaging still shows a good suppression effect on stray light caused by atmospheric particle scattering; It can be seen from Figure 9C) that the polarization imaging effect of the 6.5 km island test is not apparent because the imaging target is vegetation. The vegetation has weak polarization characteristics compared with manufactured targets such as buildings due to water vapor transpiration.
Figure 9A: Due to the close proximity of the target scene, the light received by the detector mainly comes from the target object. At noon, the solar intensity is the highest, and the image’s infrared intensity, polarization, and target contrast are the highest. Figure 9C: Due to the long distance of the target scene, the light entering the detector also comes from the reflection of the sea surface, which is greatly affected by sea surface flares and specular reflections. At noon, the sunlight is the strongest. Due to the strong reflection from the sea and sky background, the contrast between the target object and the background decreases, and the infrared intensity and polarization contrast show a trend of first decreasing and then increasing.
In order to meet the requirements of target detection at different distances in infrared polarization detection, a transmission-type long-wave infrared polarization zoom optical system is designed, which can automatically modulate the polarization angles of 0°, 45°, 90°, and 135° in four directions, and the wavelength range is 8–14 μm. The spatial resolution is 0.18–0.9 mrad, and the machining and assembly errors are analyzed to determine that the design meets the current processing level. The system structure determined in the optical design provides theoretical guidance for the preparation of long wave infrared lens, reduces the number of process validation and structure optimization, improves the efficiency of process validation, and reduces the research and development cost [18].
Based on bidirectional reflection distribution function and Stokes vector model, the characteristics of spontaneous emission and reflected radiation of metal aluminum under specific conditions are simulated and analyzed. In the reflected radiation, the degree of polarization of infrared ray first increases and then decreases with the increase of observation angle, and the linear degree of polarization reaches the maximum near the observation angle of 70°; The degree of linear polarization of spontaneous emission is positively correlated with the observation angle. The larger the observation angle, the greater the degree of linear polarization.
The infrared polarization imaging experiment verifies the unique advantages of infrared polarization technology in distinguishing natural and man-made objects, metal and non-metal, and high-temperature object recognition. Through the island imaging test, it is found that the contrast change trend of infrared intensity image and polarization image is basically consistent, and the contrast between target and background at different distances has different rules with the change of solar altitude angle. The infrared polarization imaging detection technology combining infrared intensity and polarization can effectively improve the contrast of the target, suppress the stray light caused by the scattering of atmospheric particles, and provide theoretical support for the development of the photoelectric detection field.
The original contributions presented in the study are included in the article/supplementary material, further inquiries can be directed to the corresponding author.
Data curation, QF and YZ; formal analysis, YCL and YL; investigation, XZ and LW; methodology, QF; project administration, YZ and YT; resources, JL; software, YT and JL; supervision, XZ and YT; validation, YL; visualization, LW and YL; writing—original draft, QF; writing—review and editing, YZ. All authors contributed to the article and approved the submitted version.
Supported by the specific research fund of The Innovation Platform for Academicians of Hainan Province (YSPTZX202127), Research on Polarization Imaging Detection and Recognition Technology Based on Multispectral Segment Fusion (JCKY2023230C009), and National Natural Science Foundation of China (61890963). Open Fund of State Key Laboratory of Applied Optics (No.SKLAO2021001A08).
Thanks to the Natural Science Foundation of China for helping identify collaborators for this work.
The authors declare that the research was conducted in the absence of any commercial or financial relationships that could be construed as a potential conflict of interest.
All claims expressed in this article are solely those of the authors and do not necessarily represent those of their affiliated organizations, or those of the publisher, the editors and the reviewers. Any product that may be evaluated in this article, or claim that may be made by its manufacturer, is not guaranteed or endorsed by the publisher.
1. Zhao Y, Ma W, Li L. Progress in infrared polarization imaging [J]. Flight Control Detect (2019) 2(3):8.
2. Li X, Hu H, Zhao L, Wang H, Yu Y, Wu L, et al. Polarimetric image recovery methodcombining histogram stretching for underwater imaging [J]. Scientific Rep (2018) 8(1):110–9. doi:10.1038/s41598-018-30566-8
3. Hu H, Li X, Liu T. Recent advances in underwater image restoration technique based on polarimetric imaging. Infrared Laser Eng (2019) 48(6):603006. doi:10.3788/irla201948.0603006
5. Farlow CA, Chenault DB, Pezzaniti JL, Spradley KD, Gulley MG Imaging polarimeter development and applications[J]. In: Proceedings of Spie the International Society for Optical Engineering; February 26-28, 2002; San Diego, CA (2002).
6. Andreou AG, Kalayjian ZK. Polarization imaging: Principles and integrated polarimeters. IEEE Sensors J (2002) 2(6):566–76. doi:10.1109/jsen.2003.807946
7. Chen W, Wang X, Jin W, Li F, Cao Y. Target detection experiment using medium wave infrared polarization imaging [J]. Infrared Laser Eng (2011) 40(1):7–10.
8. Wang Q. Research on optical system design of real-time polarization infrared imager with aperture separation [J]. In: Changchun institute of Optics, precision mechanics and Physics. Beijing, China: Chinese Academy of Sciences (2016). 6
9. Liu X, Zhai S, Jing L Design of cooling medium wave infrared polarization imaging optical system [J]. Infrared Laser Eng (2021). doi:10.3788/IRLA20200208
10. Tyo JS, Goldstein DL, Chenault DB, Shaw JA. Review.of passiveimaging polarimetry for remote sensing applications. ApplOpt (2006) 45(22):5453–69. doi:10.1364/ao.45.005453
11. Goldstein D. Mueller matrix dual-rotating retarder polari-meter. Appl Opt (1992) 31(31):6676–83. doi:10.1364/ao.31.006676
12. Pezzaniti JL, Chenault DB. A division of aperture MWIR imaging polarimeter. Proc Opt PhotonicsPolarization Sci Remote Sensing (2005) 5888:58880V. doi:10.1117/12.623543
13. Mou Y, Sheng XQ, Gao YQ, Wu J, Wu Z, Wu T. Bidirectional reflection distribution function modeling (BRDF) for terahertz diffuse scattering analysis of dielectric rough targets. Infrared Phys Tech (2019) 101:171–9. doi:10.1016/j.infrared.2019.06.012
14. Nicodemus FE. Comment on “Current definitions of reflectance”. Josa (1976) 66(3):283–5. doi:10.1364/josa.66.000283
15. Priest RG, Gerner TA. Polarimetric BRDF in the microfacet model: Theory and measurements[J]. In: Proceedings of the Meeting of the Military Sensing Symposia Specialty Group on Passive Sensors; August 2000; Ann Arbor, MI, USA (2000).
16. Dong J, Zhang W, Liu L. Electromagnetic scattering, absorption and thermal emission by clusters of randomly distributed magneto-optical nanoparticles. J Quantitative Spectrosc Radiative Transfer (2020) 255:107279. doi:10.1016/j.jqsrt.2020.107279
17. Fu Q, Zhang Y, Liu Y, Shi H, Zhang S, Zhan J, et al. Design and experimental analysis of micropolarization array based on a long-wave infrared optical system. Appl Sci (2006) 12(19), 9802.
Keywords: infrared polarization, detection and identification, optical system design, tolerance analysis, image contrast
Citation: Fu Q, Zhang Y, Li Y, Liu Y, Yang Y, Zhang X, Wang L, Tai Y, Liu J, Liu Z and Wang C (2023) Analysis of infrared polarization imaging characteristics based on long wave infrared zoom system. Front. Phys. 11:1224726. doi: 10.3389/fphy.2023.1224726
Received: 18 May 2023; Accepted: 12 June 2023;
Published: 06 July 2023.
Edited by:
Peng Gao, Xidian University, ChinaReviewed by:
Jian Liang, Shaanxi Normal University, ChinaCopyright © 2023 Fu, Zhang, Li, Liu, Yang, Zhang, Wang, Tai, Liu, Liu and Wang. This is an open-access article distributed under the terms of the Creative Commons Attribution License (CC BY). The use, distribution or reproduction in other forums is permitted, provided the original author(s) and the copyright owner(s) are credited and that the original publication in this journal is cited, in accordance with accepted academic practice. No use, distribution or reproduction is permitted which does not comply with these terms.
*Correspondence: Zhuang Liu, Wmh1YW5nemhpbGluZ3l1bjIwMDdAYWxpeXVuLmNvbQ==
Disclaimer: All claims expressed in this article are solely those of the authors and do not necessarily represent those of their affiliated organizations, or those of the publisher, the editors and the reviewers. Any product that may be evaluated in this article or claim that may be made by its manufacturer is not guaranteed or endorsed by the publisher.
Research integrity at Frontiers
Learn more about the work of our research integrity team to safeguard the quality of each article we publish.