 Jianxin Hao
 Xuan Xia
 Li Wang3
94% of researchers rate our articles as excellent or good
Learn more about the work of our research integrity team to safeguard the quality of each article we publish.
Find out more
ORIGINAL RESEARCH article
Front. Phys. , 13 July 2023
Sec. Interdisciplinary Physics
Volume 11 - 2023 | https://doi.org/10.3389/fphy.2023.1223548
This article is part of the Research Topic Advances in Near Infrared Optoelectronics: Material Selection, Structure Design and Performance Analysis View all 5 articles
An effective infrared image segmentation algorithm is essential for non-contact fault diagnosis of circuit boards. However, the uneven grayscale of the infrared images, multiple target regions, and large radiation noise pose challenges to achieving accurate segmentation and efficient data extraction for the interested regions. In this paper, we propose a segmentation algorithm based on the Deeplabv3+ network, using the lightweight MobileNetV2 as a replacement for the original Xception backbone network to improve computational efficiency and reduce overfitting. We also employ a composite loss function and cosine annealing learning rate to balance foreground-background segmentation and avoid local optima. Furthermore, we integrate the Convolutional Block Attention Module (CBAM) to extract and combine important spatial and channel features, allowing the algorithm to focus on identifying elements of the circuit board instead of background pixels, thereby improving segmentation accuracy. Experimental results demonstrate that our proposed algorithm achieves state-of-the-art performance in terms of both segmentation accuracy and computational efficiency on our self-built infrared circuit board dataset, with a MIoU of 90.34%, MPA of 95.26%, and processing speed of 25.19 fps. Overall, our proposed segmentation algorithm can effectively identify the key regions of interest in infrared images of circuit boards, providing technical support for non-contact diagnosis.
The proper functioning of the airborne electronic system is crucial for the safe operation of civil aircraft. However, traditional fault diagnosis techniques face challenges with the current airborne circuit systems, which have high component density and large circuit scale [1]. These challenges result in difficulties in diagnosis, low generalization, long time consumption, and low accuracy of traditional contact diagnosis methods [2]. To overcome these issues, non-contact fault diagnosis technology based on Infrared Thermography has emerged as a promising alternative [3]. Infrared Thermography uses an infrared camera to obtain temperature information from key components of the circuit, facilitating the fault diagnosis of circuit components. However, the success of infrared-based fault diagnosis depends on accurately acquiring temperature information from the heating element regions, which requires the development of an effective and accurate segmentation algorithm for the infrared image region of interest.
There are two main categories of existing semantic segmentation methods: traditional methods and deep learning-based methods. Traditional image segmentation methods frequently utilize machine learning algorithms, such as thresholding [4], edge detection [5], and clustering [6], and often depend on handcrafted features, such as histograms of oriented gradient [7] and scale-invariant feature transform [8]. With the rapid development of deep learning technology, researchers have increasingly applied it to image segmentation tasks, including semantic segmentation [9–11] and instance segmentation. Considering the focus of this paper is on the segmentation of electronic components on circuit boards, we will primarily discuss the development of deep learning-based semantic segmentation methods.
In the field of semantic segmentation, U-Net [12] and SegNet [13] are two commonly used models. U-Net adopts a symmetrical structure and is known for its ability to fuse features from different levels during the upsampling and downsampling processes to recover missing local information. On the other hand, SegNet employs a unique pooling method that records the position of the maximum value during the downsampling process. This allows for the restoration of positional information during upsampling, mitigating the loss of spatial information caused by pooling. The research in the Deeplab series primarily focuses on the receptive field characteristics of convolutional networks, considering the spatial features of the current, surrounding, and entire image. Various improvement methods have been introduced, such as the atrous pyramid pooling module [14], the encoder with fully connected CRF [15, 16], the integration of contextual information [17], and the dense convolutional layers [18]. These methods enable the algorithm to extract contextual semantic information more effectively by incorporating features obtained from multi-scale image receptive fields, thus enhancing the capability of semantic segmentation. Similarly, PSPNet [19] adopts the spatial pyramid pooling module to perform pooling on the feature maps, enhancing the semantic information of the image context through scaled feature pooling, effectively expanding the global receptive field and improving segmentation performance.
In recent years, attention mechanisms have gained significant attention in semantic segmentation algorithms. They assign weights to information in both spatial and channel dimensions to emphasize their relevance to key information and improve network prediction accuracy. DANet [20] utilizes both spatial attention and channel attention mechanisms to evaluate the spatial and channel relationships between features. EncNet [21] leverages the strong correlation between scene context and the probability of category existence to selectively enhance category-related feature weights through weighted fusion. OCNet [22] employs clustering to obtain contextual information based on object regions for each pixel and proposes a context aggregation strategy. PSANet [23] can adaptively learn attention weights and establish connections between pixels in different positions using the PSA (Point-wise Spatial Attention) module, overcoming the limitations of local region-based methods. CCNet [24] emphasizes the significance of long-distance dependencies in providing useful contextual information and utilizes the cross-attention mechanism to extract pixel features, enabling each pixel to capture long-distance dependencies from all other pixels.
Building upon attention mechanism algorithms, researchers have begun exploring new directions while improving accuracy. HANet [25] focuses on training attention modules specifically for street scenes to enhance segmentation performance in such contexts. CRNet [26] introduces a mask optimization module that effectively handles limited training samples and improves the accuracy of k-shot learning through fine-tuning. Furthermore, as fully supervised learning has reached its limitations, many semantic segmentation algorithms based on weakly supervised information, such as images, object frames, and point labels, are emerging. To accelerate the algorithms and make them suitable for mobile and embedded devices, researchers have proposed relatively lightweight network architectures. LAANet [27], achieved a balanced trade-off between segmentation accuracy, inference speed, and model size for real-time semantic segmentation; ELU-Net [28], a lightweight U-Net variant with deep skip connections, demonstrates improved brain tumor segmentation using different loss functions, and achieves effective results. However, none of the aforementioned research findings specifically focus on image semantic segmentation of electrical components on circuit boards. Clearly, this is incomplete in terms of semantic segmentation for circuit boards.
In this paper, we propose an improved Deeplabv3+ network to address the challenges of accurate infrared image segmentation. By replacing the original Xception [29] backbone with a lightweight MobileNetV2, we improve the computational efficiency of Deeplabv3+. We also incorporate the CBAM into our algorithm to strengthen the extraction and fusion of features from both spatial and channel dimensions, thereby enhancing segmentation accuracy without substantially increasing computational cost. Furthermore, we introduce a composite loss function to overcome the difficulty of segmenting large background regions in infrared circuit board images. We conduct extensive experiments on our self-built infrared circuit board image dataset. The results demonstrate that our proposed method achieves state-of-the-art performance in terms of segmentation accuracy and efficiency.
The remainder of this paper is organized as follows. In Section 2, we briefly review the relative basic theory. In Section 3, we elaborate the proposed method in detail, including the network architecture, loss function, and implementation specifics. In Section 4, we introduce the dataset, experimental setup, and results. Finally, Section 5 concludes the paper.
Deeplabv3+ is an advanced semantic segmentation algorithm that utilizes a prominent encoder module and a streamlined decoder module, as depicted in Figure 1.
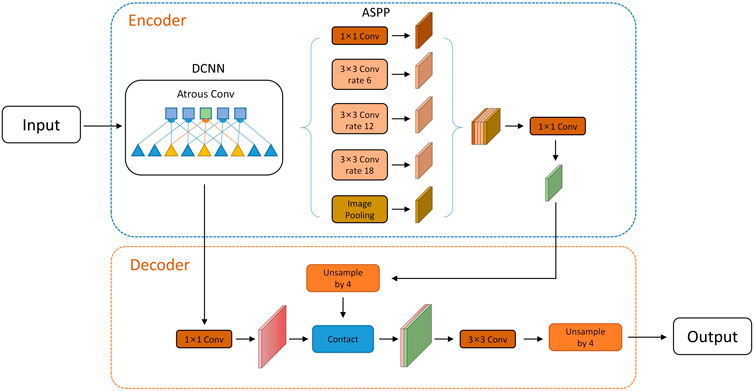
FIGURE 1. Deeplabv3+ network structure.
The encoder module is primarily comprised of the backbone network and the atrous spatial pyramid pooling (ASPP) module, which work together to extract features from the input image. In contrast, the decoder module upsamples the output feature map generated by the encoder module, and concatenates it with the low-dimensional feature map. The final segmentation result is obtained by restoring the size of the input image via bilinear interpolation.
During the coding phase, Deeplabv3+ employs the optimized and enhanced Xception as its backbone network to extract features. Figure 2 displays the network structure of this optimized version, which boasts several improvements over the original Xception network.
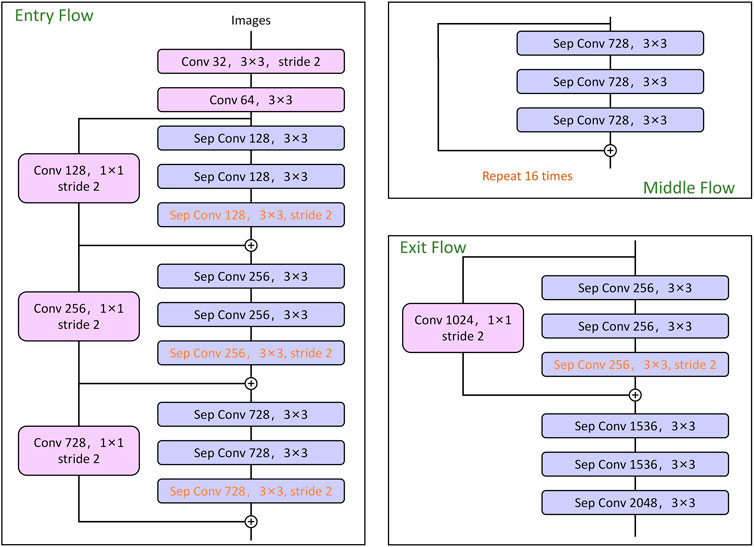
FIGURE 2. Improved Xception network structure.
Firstly, the middle flow is repeated multiple times, resulting in a deeper network. Secondly, all instances of maximal pooling in the original network are substituted with depth-wise separable convolutions that have a step size of 2 and a convolution kernel size of 3 × 3. This modification enables the network to take advantage of the separable characteristics of convolutional extraction at any resolution mapping.
Atrous Spatial Pyramid Pooling (ASPP) is a crucial module within the Deeplabv3+ architecture that facilitates multi-scale feature extraction. It achieves this by applying atrous convolutions at multiple dilation rates to a single input feature map, generating several parallel branches with different receptive field sizes. The ASPP module in Deeplabv3+ employs dilation rates of 6, 12, 18, and 24, as depicted in the network structure. Furthermore, there is a batch normalization layer for data normalization after each operation. The feature maps generated by each branch are concatenated, and a 1 × 1 convolution is used to compress and integrate the features.
Deeplabv3+ employs Depth-wise Separable Convolution (DSC) as the primary convolutional operation in the Xception encoder module to extract feature maps. The basic idea behind DSC is to decompose a complete convolution into two separate operations: depth-wise convolution and pointwise convolution, as shown in Figure 3.
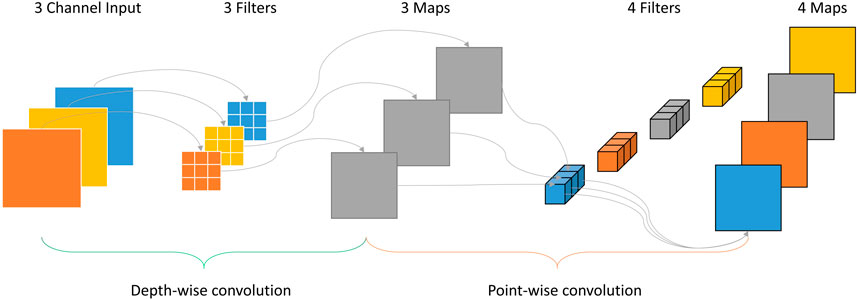
FIGURE 3. Depth-wise Separable Convolution structure.
During the Depth-wise convolution operation, each channel of the input tensor is convolved with its corresponding channel of the filter tensor. The resulting output channels are then combined in the point-wise convolution operation, which applies a 1 × 1 convolution to the Depth-wise output. This approach significantly reduces the number of parameters in the algorithm and enhances computational efficiency.
This paper proposes a novel algorithm for applying the improved Deeplabv3+ to segment specific circuit board infrared images. The proposed algorithm combines a Convolutional Block Attention Module [30] (CBAM) with an improved trunk network and composite loss function, as shown in Figure 4. To improve the algorithm’s running speed and reduce complexity, the lightweight MobileNetV2 [31] is used to replace Xception in the original network. The compound loss function, M loss, is utilized during network training to reduce the dominant degree of background regions. Additionally, the CBAM module is used for feature weighting after extraction to further reduce interference in the background area and improve the algorithm’s attention to the components in the infrared image of the circuit board.
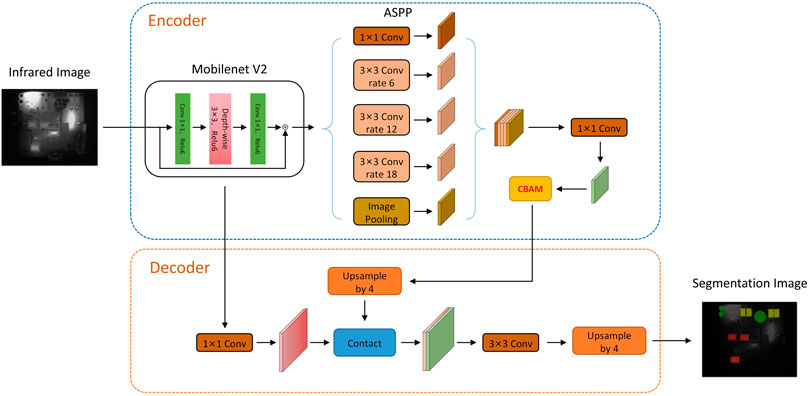
FIGURE 4. Improved Dense-Deeplabv3+ network structure.
Compared to a high-resolution visible image with three channels, an infrared image has a lower resolution and a single channel. Additionally, due to the real-time detection requirements in circuit board fault detection systems, the segmentation algorithm needs to provide faster response times. To address this challenge, we adopted a lightweight network, MobileNetV2, as a replacement for the Xception backbone network. MobileNetV2 is based on deep convolutional neural networks but can prevent overfitting and improve the running speed of the algorithm. Compared to the traditional network, the new backbone network has greatly reduced training parameters, with only 1/32 of the original parameters, without sacrificing accuracy.
MobileNetV2 adopts a inverted residual architecture, as shown in the Figure 4. The input data is first processed through a
The Convolutional Block Attention Module (CBAM) combines the channel attention module and spatial attention module, as illustrated in Figure 5. CBAM can identify important features and suppress unnecessary ones by inferring attention mapping along the channel and spatial dimensions of a given intermediate feature map.
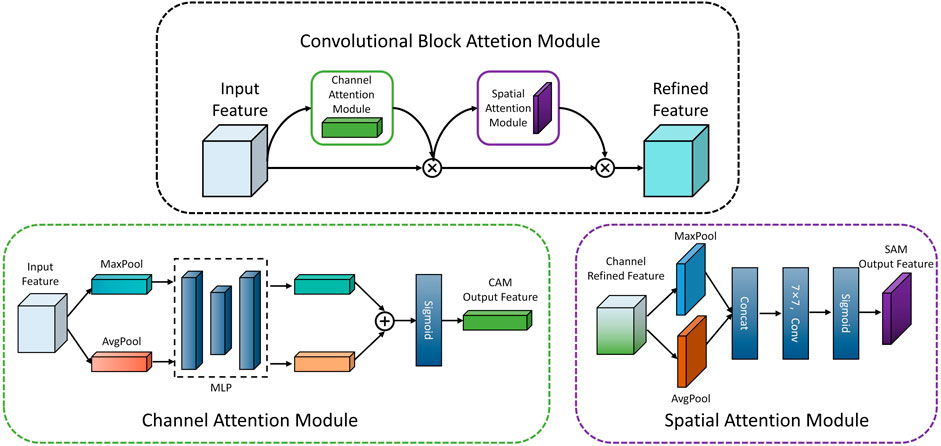
FIGURE 5. Convolutional block attention module.
The channel attention module treats each channel of the input feature map as a feature detector for image classification. First, spatial pooling of the feature map is performed using maximum pooling and global average pooling, resulting in two channel attention vectors. These vectors are then separately inputted into a shared MLP network to generate two
Here,
The channel attention mechanism module compresses the spatial dimension of each feature map through average pooling and maximum pooling, allowing the module to gather significant clues for distinguishing features. In this stage, each channel of the feature map is considered a feature detector, and the focus is on identifying “what” component is present in the input infrared image. On the other hand, spatial attention is different from the channel attention mechanism as it aims to identify the location of features, thus complementing channel attention. Initially, maximum pooling and average pooling are applied to the features processed by the channel attention module to obtain two feature maps of the same dimension. The two feature maps are then concatenated and convolved, and the Sigmoid function is used to activate the feature map after convolution, resulting in the generation of a spatial attention vector, as shown in Eq. 2.
Here,
Therefore, the convolutional attention module, which consists of the aforementioned two modules, addresses the issues of feature recognition and localization, respectively. Given the practical application scenario of this paper, namely, the segmentation of various electronic components in infrared images of circuit boards, the background information is deemed irrelevant and can be disregarded. The implementation of CBAM significantly enhances the accuracy of the algorithm.
In the DeepLab V3+ network, the loss function used in multi-classification problems is cross-entropy, which is expressed as Eq. 3.
Here,
Among them,
Here,
The German InfraTec-R5300 infrared camera was used to capture infrared images of a power module in a certain avionics system. The size of the infrared image was 320 × 256, with a measurement accuracy of ±1% and a temperature resolution of 0.015K or less.
To facilitate subsequent data processing, the temperature information was converted to grayscale using Eq. 6. Here,

FIGURE 6. The grayscale image corresponding to the infrared image of the circuit board.
To augment the sample dataset, a GAN network generated 1,400 simulated images using 600 grayscale images of circuit boards as training data. The simulated images were merged with the original images to yield a total of 2,000 grayscale images of the circuit board. The regions of interest of all images were labeled using Labelme labeling software. To enhance the sample data, techniques such as translation, rotation, mirror flipping, noise addition, contrast adjustment, and Gaussian blur were randomly applied to generate a total of 6,000 circuit board image data sets. These were then divided into training, validation, and testing sets in a 3:1:1 ratio. To ensure the reliability of the data, the test set did not include simulated images.
Evaluation metrics are commonly used to assess the detection performance of a semantic segmentation algorithm. Some widely used metrics include pixel accuracy (PA), mean pixel accuracy (MPA), and mean intersection over union (MIoU).
PA calculates the ratio of the number of correctly classified pixels to the total number of pixels.
MPA calculates the proportion of correctly classified pixels for each class and then averages across all classes.
MIoU is a standard metric for segmentation problems that calculates the ratio of the intersection and union of two sets.
ere,
The segmentation algorithm in this paper was trained using Google Collab under the Python framework, with a Tesla T4 GPU, 16 GB of graphics memory, and 12 GB of RAM. The algorithm was initialized with a learning rate of 0.01, and the SGD optimizer in the PyTorch framework was used to adaptively optimize and update the algorithm parameters. The momentum and weight attenuation terms were set to 0.9 and 0.0005, respectively. Furthermore, the algorithm employed the cosine annealing learning rate change strategy during training.
The experimental data used in this paper was established in Section 4.1 of the paper, comprising of 3,600 images for the training set, 1,200 images for the validation set, and 1,200 images for the test set. To expedite the network training process, the training phase loaded pre-trained MobileNetV2 weights and kept the backbone network parameters frozen during the first 50 epochs. Subsequently, during the last 50 epochs, the backbone network parameters were unfrozen to fine-tune the algorithm.
Figure 7 shows the loss value curve for both the training and validation sets. The x-axis represents the number of training iterations, while the y-axis represents the corresponding algorithm loss value. The improved algorithm presented in this paper achieves lower training and validation loss values in fewer iterations, and the loss value continues to decrease throughout the training process until convergence. After approximately 80 iterations, the training loss reaches a relatively small value, indicating that the algorithm has not overfitted and has achieved an optimal training performance.
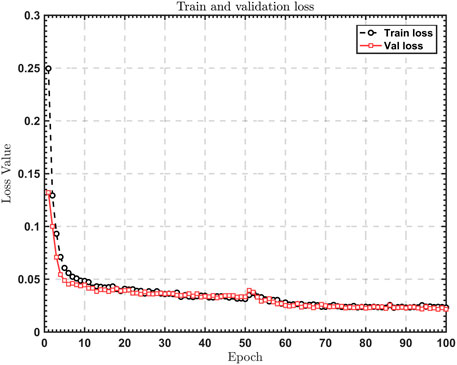
FIGURE 7. Train and validation loss.
The paper utilizes infrared image data of a circuit board to train and evaluate the performance of several algorithms, including PSPNet, HRNet [32], DeepLab V3+, MDeepLab V3+, GAN-SUNet, and the algorithm proposed in the paper. The segmentation performance of each algorithm on the circuit board’s infrared image dataset is verified, and the results are presented in Figure 8.
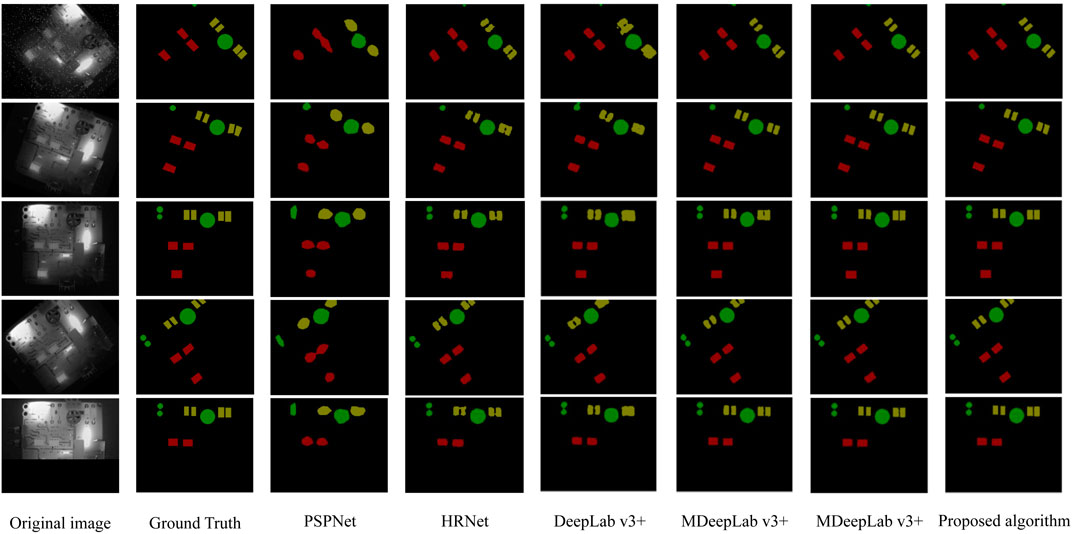
FIGURE 8. Results of the proposed segmentation over existing algorithm.
In the segmentation image, the red, green, and olive sections correspond to chips, capacitors, and diodes, respectively. It is observed that for capacitors and integrated chips that are widely spaced, all algorithms except PSPNet can effectively determine the spatial position and partial contour of components amidst the complex circuit board background and generate reasonable segmentation results. However, when the distance between components is small and the thermal radiation of diodes is weak, HRNet, DeepLab V3+, and MDeepLab V3+ produce segmentation results with varying degrees of region merging, and the edge segmentation of components is not well-defined.
In contrast, GAN-SUNet and the algorithm proposed in this paper demonstrate accurate segmentation of the diode region with minimal false segmentation in the edge pixels of the components. This shows a superior segmentation performance, with reduced instances of both false and missing segmentation, resulting in segmentation results that closely resemble the original labeled image.
The running time and detection accuracy of each algorithm are described in Table 1, in addition to the visual perception. It is important to note that the detection accuracy mentioned refers to the accuracy of detecting interested components only after removing the influence of the background. The evaluation results of each algorithm align with the visual perception observations. PSPNet’s segmentation performance is significantly lower than the other algorithms. While HRNet’s segmentation index is comparable to other algorithms, its running speed is noticeably slower. The running speed of DeepLab v3+ and GAN-SUNet, which both use VGG16 as their main backbone network, is slower than that of MDeepLab v3+ which uses MobileNetV2 as its main backbone network, as well as the proposed algorithm algorithm. Under the same lightweight MobileNetV2 backbone network, the proposed algorithm algorithm with CBAM module and optimization loss function improves segmentation accuracy by 1.88% compared to MDeepLab v3+ while maintaining a similar running speed. The proposed algorithm’s running time for processing the same image is 40 ms, which is only 54% of GAN-SUNet’s running time. Therefore, the proposed algorithm’s running speed is significantly faster while maintaining a similar segmentation accuracy.

TABLE 1. Segmentation performance of different algorithms on infrared images.
Referring to the evaluation index in Table 1 and the intuitive visual perception of the segmentation results in Figure 8, the proposed algorithm based on the characteristics of infrared images exhibits faster running speed and better segmentation performance than the original network. Although there may still be erroneous segmentation of edge pixels in the edge part of some components, there will be no adhesion of components in the division area, which is a significant improvement. Therefore, this paper concludes that the use of the MobileNetV2 network, which is more suitable for infrared images, the introduction of the CBAM, and the optimization of the training loss function and learning rate of the network all contribute positively to improving the segmentation performance of the network. These improvements can effectively enhance the accuracy and speed of image segmentation of interested components in the infrared images of the circuit board.
To provide a scientific explanation for the performance advantage of the proposed algorithm, an ablation experiment was conducted in comparison to the original DeepLab V3+. Table 2 presents the segmentation performance data for the algorithm in the ablation experiment. The “with_Mbn” column indicates that the backbone network is replaced by MobileNetV2; “OLF&LR” represents the optimized loss function and learning rate added to the algorithm, and “CBAM” indicates the addition of the CBAM module to the algorithm.
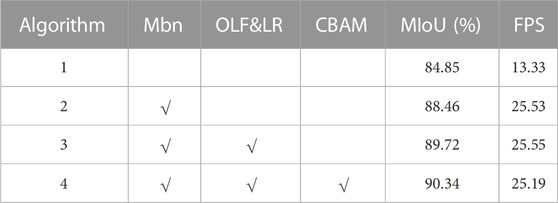
TABLE 2. Comparison table of ablation experiment results.
Comparing algorithm 1 and 2, it can be seen that using MobileNetV2 as the backbone network instead of Xception increases the running speed and segmentation accuracy of the algorithm by 190% and 3.61%, respectively, indicating that the new backbone network is better suited for feature extraction from infrared images. Comparing algorithm 2 and 3, it can be seen that further optimization of the loss function and learning rate increases the segmentation accuracy of the algorithm by 1.26%, without decreasing the running speed due to the optimization of the loss function. Finally, comparing algorithm 3 and 4, it can be seen that the addition of the CBAM module can simultaneously extract and combine important features in space and channel, promoting the training intensity of the algorithm’s positive weight while suppressing unnecessary features.
Although the addition of the CBAM module leads to a slight decrease in computing speed, the segmentation accuracy of the algorithm is improved again. Therefore, this paper believes that the limited loss of speed decrease is worthwhile. Figure 9 also supports this point visually. Specifically, when CBAM is turned off, the segmentation results show noticeable changes, including smaller edge distance between the two green areas representing capacitance, increased edge missegmentation of the yellow segment representing the diode, and uneven edges.
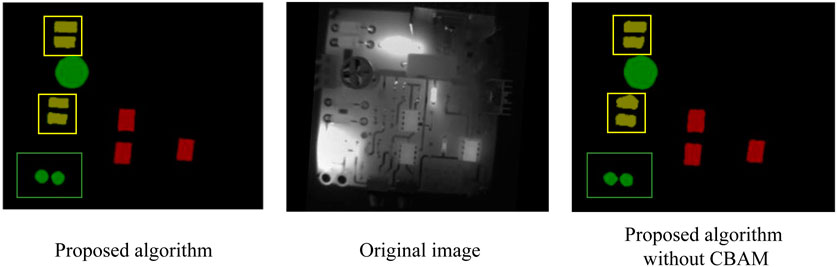
FIGURE 9. Impact of CBAM on proposed segmentation results.
To evaluate the generalization ability of the proposed algorithm and demonstrate its applicability, we utilize an unseen dataset to assess its performance. It is important to note that this dataset is entirely new and acquired independently after the completion of model training. Furthermore, this dataset was obtained while the circuit board was operating under new parameters. Subsequently, the proposed algorithm is employed to segment the infrared images, and the results are presented in Figure 10.
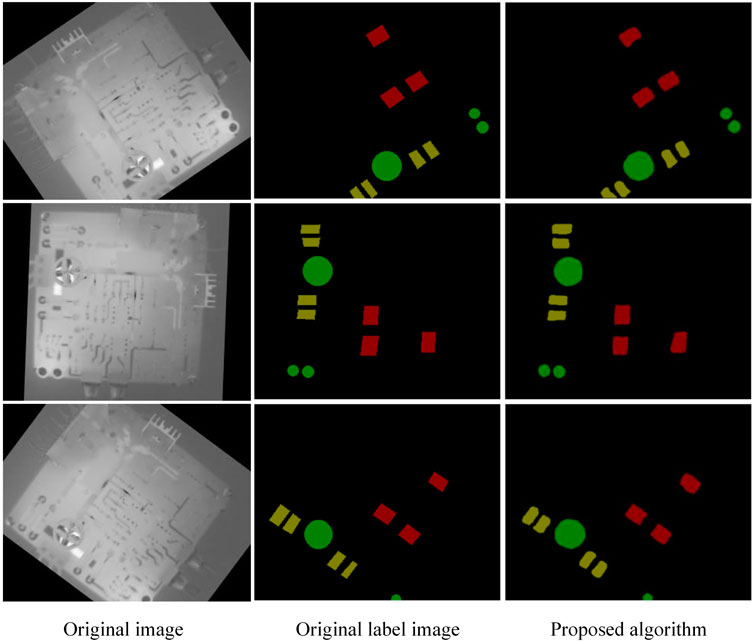
FIGURE 10. The segmentation of proposed algorithm on unseen data.
On the new dataset, the proposed algorithm maintains its strengths by precisely segmenting each region of interest for individual components. The segmented regions exhibit clear boundaries, with no erroneous adhesion between components of comparable spatial proximities. Upon evaluation, the MIoU remains at a high of 90.12%, despite a marginal decrease relative to the original training set. The algorithm is still capable of maximizing the discriminative features of infrared images under the constraint of small sample sizes, achieving a high segmentation accuracy and effectively partitioning the infrared image of the circuit board to determine the spatial positions of its constituents. These results suggest the algorithm possesses a degree of generalization capability.
In this paper, we present an improved region of interest component segmentation algorithm based on Deeplabv3+, aiming to address the challenges posed by the limited data set size, large background pixel area, and small area of interested components in infrared images of circuit boards. The proposed algorithm leverages the infrared image data to support fault diagnosis of the circuit board by constructing a training and verification data set.
Firstly, to expand the dataset and minimize overfitting, a GAN network and image enhancement technology are utilized. Secondly, to better adapt to infrared images, MobileNetV2 is adopted as the backbone network of the algorithm, which accelerates training and diagnosis and enables future real-time deployment. Furthermore, the composite loss function and cosine annealing learning rate are employed to avoid local optimal solutions and minimize the impact of background pixels on segmentation accuracy. Finally, the CBAM is integrated into the algorithm to focus on component regions of interest, reduce the effect of background, and improve segmentation performance.
The experimental results demonstrate that the proposed algorithm can accurately and efficiently segment the component regions of interest in the infrared images of circuit boards. Specifically, the segmentation time for a single circuit board on the test set is only 40 ms, with MIoU and MPA reaching 90.34% and 95.26%, respectively. These results show that the algorithm achieves a high level of segmentation accuracy while significantly improving the running speed.
By incorporating the proposed algorithm into the circuit board fault diagnosis system, the segmentation of the regions of interest can be quickly completed, thereby providing crucial technical support for subsequent fault diagnosis research. Overall, the algorithm can be easily adapted to accommodate the expansion of infrared image datasets of self-built circuit boards and can be effectively utilized for practical applications, primarily owing to the improved network architecture and optimization approach.
The original contributions presented in the study are included in the article/Supplementary material, further inquiries can be directed to the corresponding author.
JH was involved in conceptualization, methodology and writing the initial draft. XX and LW were responsible for formal analysis and investigation. ZL was responsible for data curation, visualization and software. MZ was involved in validation and reviewing and editing. All authors contributed to the article and approved the submitted version.
The authors would like to thank the National Natural Science Foundation of China (No. U1733119) and the Central Universities’ Fundamental Research Funds for the Central Universities Special Funds of Civil Aviation University of China (No. 3122019113) for their financial support.
The authors declare that the research was conducted in the absence of any commercial or financial relationships that could be construed as a potential conflict of interest.
All claims expressed in this article are solely those of the authors and do not necessarily represent those of their affiliated organizations, or those of the publisher, the editors and the reviewers. Any product that may be evaluated in this article, or claim that may be made by its manufacturer, is not guaranteed or endorsed by the publisher.
1. Guo K, Li Q, Wang C, Mao Q, Liu Y, Zhu J, et al. Development of a single-wavelength airborne bathymetric LiDAR: System design and data processing. ISPRS J Photogrammetry Remote Sensing (2022) 185:62–84. doi:10.1016/j.isprsjprs.2022.01.011
2. Attallah O, Ibrahim RA, Zakzouk NE. Fault diagnosis for induction generator-based wind turbine using ensemble deep learning techniques. Energ Rep (2022) 8:12787–98. doi:10.1016/j.egyr.2022.09.139
3. Fu L, Sun L, Du YN, Meng F. Fault diagnosis of radio frequency circuit using heterogeneous image fusion. Opt Eng (2023) 62(3):034107. doi:10.1117/1.OE.62.3.034107
4. Duarte A, Carrão L, Espanha M, Viana T, Freitas D, Bártolo P, et al. Segmentation algorithms for thermal images. Proced Tech (2014) 16:1560–9. doi:10.1016/j.protcy.2014.10.178
5. Wang W, Yang LJ, Xie YT, An YW. Edge detection of infrared image with CNN_DGA algorithm. Optik (2014) 125(1):464–7. doi:10.1016/j.ijleo.2013.07.049
6. Ramirez-Rozo TJ, Garcia-Alvarez JC, Castellanos-Dominguez CG. Infrared thermal image segmentation using expectation-maximization-based clustering. In: 2012 XVII Symposium of Image, Signal Processing, and Artificial Vision (STSIVA); September 12-14, 2012; Medellin, Colombia. IEEE (2012). p. 223–6.
7. Olsen A, Han S, Calvert B, Ridd P, Kenny O. In situ leaf classification using histograms of oriented gradients. In: 2015 International Conference on Digital Image Computing: Techniques and Applications (DICTA); November 23-25, 2015; Adelaide, SA, Australia. IEEE (2015). p. 1–8.
8. Shiji TP, Remya S, Thomas V. Computer aided segmentation of breast ultrasound images using scale invariant feature transform (SIFT) and bag of features. Proced Comput Sci (2017) 115:518–25. doi:10.1016/j.procs.2017.09.108
9. Tian J, Yuan J, Liu H. Road marking detection based on mask R-CNN instance segmentation model. In: 2020 international conference on computer vision, image and deep learning (CVIDL); July 10-12, 2020; Chongqing, China. IEEE (2020). p. 246–9.
10. Tao S, Li Y, Huang Y, Lan X. Face detection algorithm based on deep residual network. J Phys Conf Ser (2021) 1802(3):032142. doi:10.1088/1742-6596/1802/3/032142
11. Liu S, Qi L, Qin H, Shi J, Jia J. Path aggregation network for instance segmentation. In: Proceedings of the IEEE conference on computer vision and pattern recognition; June 18-23, 2018; Salt Lake City, UT (2018). p. 8759–68.
12. Ronneberger O, Fischer P, Brox T. U-net: Convolutional networks for biomedical image segmentation. In: Medical Image Computing and Computer-Assisted Intervention–MICCAI 2015: 18th International Conference; October 5-9, 2015; Munich, Germany. Springer International Publishing (2015). p. 234–41.
13. Badrinarayanan V, Kendall A, Cipolla R. SegNet: A deep convolutional encoder-decoder architecture for image segmentation. IEEE Trans pattern Anal machine intelligence (2017) 39(12):2481–95. doi:10.1109/tpami.2016.2644615
14. Chen LC, Papandreou G, Kokkinos I, Murphy K, Yuille AL. Semantic image segmentation with deep convolutional nets and fully connected crfs (2014). Available at:https://arxiv.org/abs/1412.7062 (Accessed December 22, 2014).
15. Chen LC, Papandreou G, Kokkinos I, Murphy K, Yuille AL. DeepLab: Semantic image segmentation with deep convolutional nets, atrous convolution, and fully connected CRFs. IEEE Trans pattern Anal machine intelligence (2017) 40(4):834–48. doi:10.1109/TPAMI.2017.2699184
16. Chen LC, Papandreou G, Schroff F, Adam H. Rethinking atrous convolution for semantic image segmentation (2017). Available at: https://arxiv.org/abs/1706.05587 (Accessed June 17, 2017).
17. Chen LC, Zhu Y, Papandreou G, Schroff F, Adam H. Encoder-decoder with atrous separable convolution for semantic image segmentation. In: Proceedings of the European conference on computer vision (ECCV); September 8, 2018; Munich, Germany (2018). p. 801–18.
18. Yang M, Yu K, Zhang C, Li Z, Yang K. Denseaspp for semantic segmentation in street scenes. In: Proceedings of the IEEE conference on computer vision and pattern recognition; June 18-23, 2018; Salt Lake City, UT (2018). p. 3684–92.
19. Zhao H, Shi J, Qi X, Wang X, Jia J. Pyramid scene parsing network. In: Proceedings of the IEEE conference on computer vision and pattern recognition; July 21-26, 2017; Honolulu, HI (2017). p. 2881–90.
20. Fu J, Liu J, Tian H, Li Y, Bao Y, Fang Z, et al. Dual attention network for scene segmentation. In: Proceedings of the IEEE/CVF conference on computer vision and pattern recognition; June 15-20, 2019; Long Beach, CA (2019). p. 3146–54.
21. Zhang H, Dana K, Shi J, Zhang Z, Wang X, Tyagi A, et al. Context encoding for semantic segmentation. In: Proceedings of the IEEE conference on Computer Vision and Pattern Recognition; June 18-23, 2018; Salt Lake City, UT (2018). p. 7151–60.
22. Yuan Y, Huang L, Guo J, Zhang C, Chen X, Wang J. Ocnet: Object context network for scene parsing (2018). Available at: https://arxiv.org/abs/1809.00916 (Accessed September 4, 2018).
23. Zhao H, Zhang Y, Liu S, Shi J, Loy CC, Lin D, et al. Psanet: Point-wise spatial attention network for scene parsing. In: Proceedings of the European conference on computer vision (ECCV); September 8, 2018; Munich, Germany (2018). p. 267–83.
24. Huang Z, Wang X, Huang L, Huang C, Wei Y, Liu W. Ccnet: Criss-cross attention for semantic segmentation. In: Proceedings of the IEEE/CVF international conference on computer vision; October 27- November 2, 2019; Seoul, Korea (2019). p. 603–12.
25. Choi S, Kim JT, Choo J. Cars can't fly up in the sky: Improving urban-scene segmentation via height-driven attention networks. In: Proceedings of the IEEE/CVF conference on computer vision and pattern recognition; June 13-19, 2020; Seattle, WA (2020). p. 9373–83.
26. Liu W, Zhang C, Lin G, Liu F. Crnet: Cross-reference networks for few-shot segmentation. In: Proceedings of the IEEE/CVF Conference on Computer Vision and Pattern Recognition; June 13-19, 2020; Seattle, WA (2020). p. 4165–73.
27. Zhang X, Du B, Wu Z, Wan T. LAANet: Lightweight attention-guided asymmetric network for real-time semantic segmentation. Neural Comput Appl (2022) 34(5):3573–87. doi:10.1007/s00521-022-06932-z
28. Deng Y, Hou Y, Yan J, Zeng D. ELU-Net: An efficient and lightweight U-net for medical image segmentation. IEEE Access (2022) 10:35932–41. doi:10.1109/access.2022.3163711
29. Chollet F. Xception: Deep learning with depthwise separable convolutions. In: Proceedings of the IEEE conference on computer vision and pattern recognition; July 21-26, 2017; Honolulu, HI (2017). p. 1251–8.
30. Woo S, Park J, Lee JY, Kweon IS. Cbam: Convolutional block attention module. In: Proceedings of the European conference on computer vision (ECCV); September 8-14, 2018; Munich, Germany (2018). p. 3–19.
31. Howard A, Zhmoginov A, Chen LC, Sandler M, Zhu M. Inverted residuals and linear bottlenecks: Mobile networks for classification, detection and segmentation (2018). Available at: https://research.google/pubs/pub48080/ (Accessed February 15, 2023).
Keywords: infrared image segmentation, DeepLabV3+, MobileNetV2, CBAM, composite loss function
Citation: Hao J, Xia X, Wang L, Li Z and Zhu M (2023) Accurate segmentation of infrared images for circuit board diagnosis using an improved Deeplabv3+ network. Front. Phys. 11:1223548. doi: 10.3389/fphy.2023.1223548
Received: 16 May 2023; Accepted: 30 June 2023;
Published: 13 July 2023.
Edited by:
Ming Yang, Civil Aviation Flight University of China, ChinaReviewed by:
Huijun Cao, Xiamen City University, ChinaCopyright © 2023 Hao, Xia, Wang, Li and Zhu. This is an open-access article distributed under the terms of the Creative Commons Attribution License (CC BY). The use, distribution or reproduction in other forums is permitted, provided the original author(s) and the copyright owner(s) are credited and that the original publication in this journal is cited, in accordance with accepted academic practice. No use, distribution or reproduction is permitted which does not comply with these terms.
*Correspondence: Jianxin Hao, anhoYW9AY2F1Yy5lZHUuY24=
Disclaimer: All claims expressed in this article are solely those of the authors and do not necessarily represent those of their affiliated organizations, or those of the publisher, the editors and the reviewers. Any product that may be evaluated in this article or claim that may be made by its manufacturer is not guaranteed or endorsed by the publisher.
Research integrity at Frontiers
Learn more about the work of our research integrity team to safeguard the quality of each article we publish.