 Esteban Meca
 Anatol W. Fritsch2,3
 Juan M. Iglesias-Artola
 Barbara Wagner
94% of researchers rate our articles as excellent or good
Learn more about the work of our research integrity team to safeguard the quality of each article we publish.
Find out more
ORIGINAL RESEARCH article
Front. Phys., 22 June 2023
Sec. Biophysics
Volume 11 - 2023 | https://doi.org/10.3389/fphy.2023.1213304
We investigate intrinsically disordered regions (IDRs) of phase separating proteins regarding their impact on liquid-liquid phase separation (LLPS) of the full protein. Our theoretical approach uses a mean-field theory that accounts for sequence-dependent electrostatic interactions via a Random Phase Approximation (RPA) and in addition allows for variable salt concentration for the condensed and dilute protein phases. The numerical solution of the complete phase diagrams together with the tie lines that we derive for this model system leaves two parameters to be determined by fitting experimental data on concentrations of all species involved in the system. For our comparisons, we focus on two proteins, PGL-3 and FUS, known to undergo LLPS. For PGL-3 we predict that its long IDR near the C-terminus promotes LLPS, which we validate through direct comparison with in vitro experimental results under the same physiological conditions. For the structurally more complex protein FUS the role of the low complexity (LC) domain in LLPS has been intensively studied. Apart from the LC domain we here investigate theoretically two IDRs, one near the N-terminus and another near the C-terminus. Our theoretical analysis of these domains predict that the IDR at the N-terminus (aa 1-285) is the main driver of LLPS of FUS by comparison to in vitro experiments of the full length protein under the same physiological temperature and salt conditions.
Protein condensation driven by liquid-liquid phase separation (LLPS) is a powerful concept to understand the mesoscale organization of cells. It provides a simple mechanism to form non-membrane bound organelles that separate from the nucleo- and cytosol. Examples of such biomolecular condensates include nucleoli, P-granules, stress granules and centrosomes as reviewed in [1, 2, 3]. These condensates correspond to a protein-rich phase coexisting with a protein-poor bulk phase.
One of the drivers of cellular LLPS are intrinsically disordered regions (IDRs), these can be either part of a protein or constitute the entire protein (intrinsically disordered proteins, IDPs). IDRs are highly dynamic regions within protein sequences that lack stable secondary or tertiary structure. Yet, they facilitate weak multivalent interactions. On the sequence level, driving forces include electrostatic interactions between charged motifs that promote long- and short-range interactions. Short-range interactions are characterized by directional interactions of dipoles or positive charges with aromatic groups [4]. Thus, the phase behaviour of a given protein is sequence encoded. Condensation, however, does not only depend on protein structure but also on the environmental conditions. These include temperature, ionic strength of the constituents or their concentration. For example, condensates can dissolve upon raising temperature or salt concentration and can reform when conditions are reverted.
Despite increasing experimental evidence, which lends insight into the physical chemistry that is driving LLPS, it remains a challenge to directly predict the phase behaviour of a protein based on its primary sequence and solvent environment. This limits our ability to predict how changes in the amino acid sequence of a protein influence its phase behaviour. Therefore, theoretical predictions for phase diagrams are needed to guide experimental research and provide insights into the molecular basis of physiological and pathological processes related to diseases and ageing.
While molecular dynamics simulations provide detailed biophysical information on a single protein level [5], they quickly become computationally expensive when applied to large ensembles of phase-separating proteins in a solvent. A coarse-grained lattice-based approach is the classical Flory-Huggins theory [6,7] and its extension to the Voorn-Overbeek theory [8], which incorporates electrostatic interactions via the Debye-Hückel theory. In the derivation of these theories, variations in charge patterns that are responsible for phase-separation are averaged out. They thus cannot capture structure- or even sequence-specific phase behaviour, which is a signature of IDPs. On an intermediate coarse-grained scale, Field Theoretic Simulations (FTS), rooted in statistical mechanics, are able to incorporate structural information of proteins and has recently been used to predict LLPS of tau, see, e.g., [9]. However, since FTS relies on the full partition function of the free energy it is still numerically very demanding. Asymptotic approximations of the full partition function, such as the Random Phase Approximation (RPA), reliably account for the structural features of proteins. Indeed, Lin et al. [10,11] have pioneered the application of RPA to LLPS of phase separating proteins to predict the sequence-specific phase behaviour of the RNA helicase Ddx4, see also the recent review by Dinic et al. [12].
Here we predict the phase behaviour of proteins by using a thermodynamically consistent theoretical mean-field model that includes salt concentration as a variable. Using a Random Phase Approximation, we introduce the sequence-dependent electrostatic interactions arising only from one IDR at a time to build the free energy. In our analysis, we assume that this free energy encodes the phase behaviour of the complete protein, and thus derive temperature-protein concentration and salt-protein concentration phase diagrams. Under the same physiological conditions we directly compare to in vitro experiments. We study in depth two well-known proteins on which this approach is successful. These are PGL-3 (C. elegans) and fused in sarcoma (FUS). These two proteins are known to undergo LLPS in vitro and in vivo [13,14]. By matching to the exact conditions of in vitro experiments, we determine the IDRs that drive LLPS of these proteins.
We first investigate PGL-3, since its phase behaviour is well understood [15, 13] and validate our predictions with experimental data of the dilute and condensed phase concentration from in vitro studies under physiological salt conditions. Our results confirm that the IDR at the C-terminus drives LLPS of PGL-3. We then focus our analysis on FUS, where the driving forces and sequence domains responsible for LLPS are still under debate [16, 14]. We identify and analyse three regions as possible candidates to impact the phase behaviour of FUS, the LC region, an IDR at the N-terminus and an IDR at the C-terminus.
Our analysis reveals that the domain at the N-terminus, from amino acids 1 to 285, to be responsible for LLPS when comparing to in vitro experimental data of FUS.
PGL-3 was purified from insect cells according to [15]. SF9-ESF cells were infected with baculovirus containing the PGL-3-GFP-6HIS protein under the polyhedrin promoter. Cells were harvested after 3 days of infection by centrifugation at 500 g for 10 min and then resuspended in lysis buffer (25 mM HEPES 7.25, 300 mM KCl, 10 mM imidazole, 1 mM DTT, 1 protease inhibitor). Cells were lysed by passing the cells 2 times through the LM20 microfluidizer at 15,000 psi. The lysate was then centrifuged at 20,000 rpm for 45 min at 15°C. The lysate was loaded in a pre-equilibrated Ni-NTA column with lysis buffer at 3 mL/min. The Ni-NTA column was rinsed with 10 C.V of wash buffer (25 mM HEPES 7.25, 300 mM KCl, 20 mM imidazole, 1 mM DTT, 1) and the protein was eluted in 1.5 mL fractions with elution buffer (25 mM HEPES 7.25, 300 mM KCl, 250 mM imidazole, 1 mM DTT). After elution the GFP tagged was cleaved to produce untagged PGL-3. The cleavage was performed using a TEV protease overnight at 4°C. PGL-3 and PGL-3-GFP proteins were diluted with Dilution buffer (25 mM Tris pH 8.0, 1 mM DTT) to reach 50 mM KCl before loading the protein in an anion exchange HiTrapQ HP 5 mL column. The HiTrap column was previously equilibrated first with HiTrapQ elution buffer (25 mM Tris pH 8.0, 50 mM KCl, 1 mM DTT) and then with HiTrapQ binding buffer (25 mM Tris pH 8.0, 1 M KCl, 1 mM DTT). The column was mounted in a Äkta Pure FPLC system. After the sample was loaded the column was washed with HiTrapQ binding buffer. The sample was finally eluted with a linear gradient from 0% to 55% of HiTrapQ elution buffer (25 mM Tris pH 8.0, 1 M KCl 1 mM DTT) for 25 C.V. Finally a 100% HiTrap elution buffer step was performed for 5 C.V. The pooled fractions were then loaded in a HiLoad 16/60 Superdex 200 size exclusion chromatography column that was previously equilibrated with superdex buffer (25 mM HEPES 7.25, 300 mM KCl, 1 mM DTT). After size exclusion, the final samples were collected.
Unlabeled FUS purified from a baculovirus construct containing N-HIS-MBP-FUS-TEV-SNAP. SF9-ESF cells were harvested after 3 days of infection by centrifugation at 500 g for 10 min. The cell pellet was resuspended using 50 mL of lysis buffer (50 mM Tris pH 7.4, 500 mM KCl, 5% glycerol, 10 mM imidazole, 1 mM PMSF, 1X protease inhibitor) for every 50 mL of cultured cells. The cells were lysed by passing them 2 times through the LM20 microfluidizer at 15,000 psi. The lysate was then centrifuged at 20,000 rpm for 45 min at 15°C. The supernatant was collected and loaded into a Ni-NTA column that was previously equilibrated with lysis buffer. After loading the sample the column was washed for 10 C.V. with Ni-NTA wash buffer (50 mM Tris pH 7.4, 500 mM KCl, 5% glycerol, 20 mM imidazole). The protein was then eluted with Ni-NTA elution buffer (50 mM Tris pH 7.4, 500 mM KCl, 5% glycerol, 300 mM imidazole). The collected fractions where then loaded into a MBPTrap HP column preequilibrated with Ni-NTA elution buffer. The MBP column was washed for 10 C.V with MBP wash buffer (50 mM Tris pH 7.4, 500 mM KCl, 5% glycerol). After washing, the sample was eluted with MBP elution buffer (50 mM Tris pH 7.4, 500 mM KCl, 5% glycerol, 500 mM arginine, 20 mM maltose). The protein was diluted to a concentration of less than 15 μM using MBP elution buffer. 3C and TEV proteases were then added to cleave the MBP and SNAP tags from the FUS construct. The cleavage reactions were incubated overnight at 18°C. Finally the protein was loaded in a SepFast GF-HS-L 26 mm × 600 mm gel filtration to remove the cleaved MBP and SNAP tags and exchange the buffer. The SepFast column was previously equilibrated in storage buffer (50 mM HEPES pH 7.25, 750 mM KCl, 5% glycerol, 1 mM DTT). The sample was concentrated to a final concentration of 15 μL using 30 kDa Amicon centrifuge filters. FUS-GFP was purified as previously described in [14].
In our analysis we mainly use the MetaDisorder predictor by [17] to identify the disordered and low complexity regions giving a disorder tendency score for each amino acid (Figure 1C). MetaDisorder queries other predictors and generates a consensus answer, with an algorithm that tests the strength of each method against several datasets. It thus addresses the issue of training-set dependent model predictions. In particular, MetaDisorder includes also widely used IUpred predictors [18].
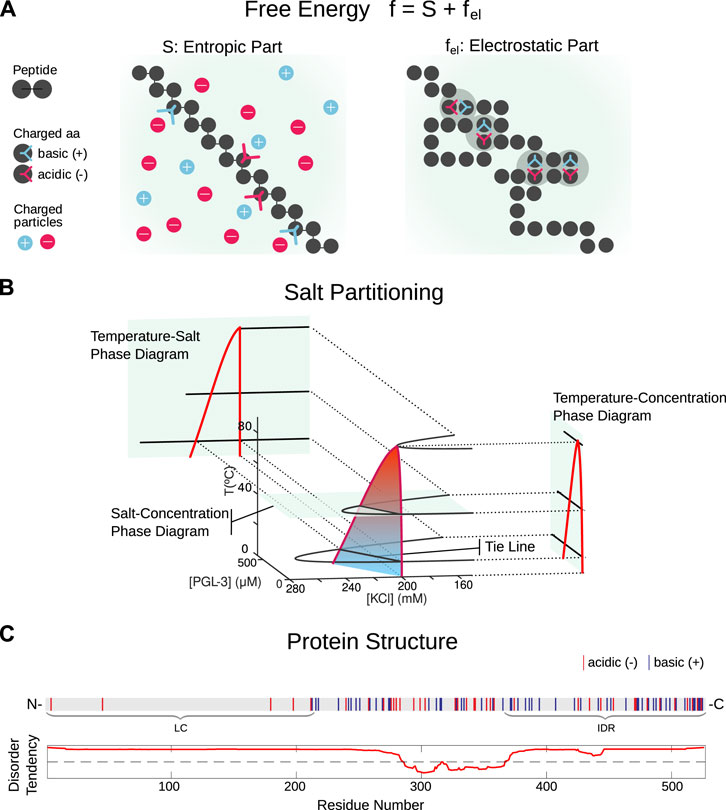
FIGURE 1. Theoretical approach. (A): We assume short range entropic and long range electrostatic interactions with residues of a peptide chain taking part in multivalent interactions, combine to drive liquid-liquid phase separation in solution. (B): The Random Phase Approximation (RPA) we present allows for variable salt concentration and can account for salt partitioning. The corresponding phase diagrams typically show pointy shapes as a consequence of a discontinuity in the difference in salt between the condensed and dilute phases at high temperatures. (C): For the sequence analysis we use the MetaDisorder predictor MD2 by [17] to identify the disordered and low complexity regions (represented here is FUS). MetaDisorder queries other predictors and generates a consensus answer, with an algorithm that tests the strength of each method against several datasets. It thus addresses the issue of training-set dependent model predictions. In particular, it also includes other widely used predictors such as IUpred [18].
Here we detail the procedure for measuring cout, the saturation protein concentration above which LLPS occurs and cin, the corresponding protein concentration in the condensed phase.
A master-mix of 95% unlabeled and 5% labeled protein was prepared from high-salt stock solutions (PGL-3: 300 mM KCl, 25 mM HEPES, 1 mM DTT; FUS: 750 mM KCl, 25 mM HEPES, 1 mM DTT, 5% Glycerol). Phase separation was initiated by diluting the stock salt concentration directly before encapsulation in water-in-oil emulsions that were created using Pico-Surf (2% (w/w) in Novec 7500, Sphere Fluidics). Emulsions were loaded on a temperature-controlled stage and the sample chambers were sealed with a two-component silicone (Picodent, Twinsil Speed). After a 30 min waiting time at the desired temperature the emulsion droplets were imaged using a 40X, 0.95 N.A., air objective mounted on an Olympus IX83 microscope stand controlled via CellSens. Confocal Z-stacks were recorded using a Hamamatsu Orca Flash 4.0 connected to a Yokogawa W1 spinning disc unit. Large 3D tile-images were collected to increase the statistics of individual emulsion droplets.
The fluorescence and bright-field images were analyzed using a custom MATLAB code. This allowed us to derive the volume fraction Vfrac of the condensed phase in each emulsion droplet by image segmentation. Using volume and mass conservation we can derive a linear relationship volume fraction and total protein concentration ctot: Vfrac = 1/(cin − cout) ⋅ ctot − cout/(cin − cout). We then used a set of total protein concentrations to determine both cout and cin via linear regression to this equation. Thus, this allows for experimental measurements of temperature- and salt-dependent phase diagrams using small amounts of protein sample.
For the purpose of this study, i.e., analysing the impact of different domains of an IDP on its propensity to phase separate, we use field theoretic approaches rooted in statistical mechanics that are able to incorporate detailed structural information of polyampholytes such as proteins. They are obtained from the partition function for ensembles of coarse-grained polyampholytes, which are represented, via the Hubbard-Stratonovich transformation, as multi-dimensional functional integral (path integral) over all possible states or the polymeric system. Field theoretic simulations (FTS) are numerical methods that consider the full functional integral of the associated partition function. However, the integration of the full integral relies on stochastic sampling via Monte-Carlo methods that have shown considerable convergence problems due to the oscillatory nature of the resulting distribution function [19]. Nevertheless, this approach has recently been used successfully for the tau protein [9]. It holds promise for the development of an appropriate and efficient theory that will allow to characterize a whole class of proteins such as IDPs and proteins that contain intrinsically disordered domains, and can be used to deliver analytical insight into the underlying biophysical principles leading to LLPS. For our analysis we use the Random Phase Approximation (RPA). As is the case for self-consistent field theory, it can be derived from a saddle-point approximation, taking into account the asymptotically dominant contribution (a single Gaussian distribution) of the functional integral of the partition function, reducing the field theory to a mean-field model where a single Gaussian configuration interacts with an average effective field. It is one of the simplest analytical theories that can account for small site-specific fluctuations, e.g., of charge patterns and structural features of the protein.
The RPA approach we use here has been set-up previously by Lin et al. [10,20] for the IDR of Ddx4. For our analysis we use the extended model that includes salt as an additional variable, apart from the protein (here for IDRs of PGL-3 and FUS) (ϕaa), counterions (ϕc), KCl (ϕs) and water. The free energy
combines the entropic part S, coming from Flory-Huggins solution theory:
where N denotes the number of amino acids and the solvent fraction can be written as ϕw = 1 − ϕaa − ϕc − 2ϕs, with the electrostatic part of the free energy fel. Note that we only have a single volume fraction ϕs to represent the salt concentration, which implies that the concentration of both ions conforming the salt is considered equal in all phases. Here we follow [10], but this assumption is not necessarily correct, see the discussion.
For the evaluation of fel the Random Phase Approximation is commonly used [21–24]. It can be expressed in its simplest non-dimensional form as the following integral:
with
where T* is the non-dimensionalised temperature which includes the relative permittivity of the medium. The correlation matrix for the chain can be written as
where the lengths have been non-dimensionalized with the characteristic length a of the polymeric link of the associated Gaussian chain, here the domain of interest for protein PGL-3 or FUS. Note that the neutrality condition implies ϕc = |σ|ϕaa, where
To compute the phase diagrams including salt dependence, in particular when solving for the tie lines of the model system, we integrate the system using Gauss-Laguerre quadrature, with the points computed using both our own implementation of the classic method by Golub et al. [25] and the state-of-the-art method by Glaser et al. [26]. In order to find the tie lines between two coexisting points (ϕaa, ϕs)|α and (ϕaa, ϕs)|β, we solve the following system, which is equivalent to the equality of the electrochemical potentials and the common tangent construction:
where the non-linear system of equations is solved by using the trust-region-dogleg algorithm as implemented in Octave.
Note that this is a system of three equations with four unknowns, the volume fraction of salt and protein in the dilute and in the condensed phases. Because of the way in which the protein concentrations are measured experimentally, we know the salt concentration in the dilute phase, which allows the system of equations to be determined when comparing with the experiments.
In order to draw the complete phase diagram, we can take one of the unknowns as a parameter and solve for the others. In order to solve effectively the system above it is imperative to develop a continuation strategy. Naively, one could vary the unknown taken as a parameter and solve for the others using the prior solution as a guess. This strategy is known as natural parameter continuation [27], but the system above presents turning points for the parameter, which requires the development of a pseudo-arclength continuation algorithm. The latter implies the definition of a new variable, the pseudo arclength, which is defined as the arclength of the solution curve in the four-dimensional space spanned by the four unknowns in the system above. In practical terms, using this method implies adding an additional equation to the previous system that imposes a fixed increase of the arclength from the prior solution. Thus, we obtain a system of four solutions with four unknowns that is similarly solved using the trust-region-dogleg algorithm.
We now express T* and ϕaa in terms of experimentally accessible variables, concentrations (c) and temperatures (T). In the case of ϕaa, we know that it corresponds to the total volume occupied by amino acids over the volume of the total lattice. We take the volume of a lattice site to be that of a single water molecule, which corresponds to 1/55.5 M. We would have then for PGL-3 in the presence of KCl (note that PGL-3 consists of 693 amino acids):
There are two implicit assumptions in this calculation. One, it is assumed that each amino acid takes the same volume as a water molecule, which is clearly not true, and two, that the volume of a protein scales linearly with the number of amino acids. The latter can be argued to be false, since different configurations of the protein will give different volumes. Therefore, there is not a clear and easy way of relating the volume fraction and the protein concentration.
The non-dimensional temperature T* is related to T by
where ɛ0 is the vacuum permittivity, ɛr is the relative permittivity of the medium, kB is Boltzmann’s constant, a the link length and e is the charge of the electron. The two unknowns in Eq. 8 are a and ϵr. We take a to be the Cα-Cα virtual bond length of 3.8 Å and fit ɛr, due to the lack of a complete theory to derive its value, we only know that it should be between 2 (typical value for hydrocarbon crystals) and 80
The impossibility of obtaining accurate theoretical estimates for the relation between volume fraction and the concentration of the protein and for the permittivity of the solution make it necessary to proceed with a fitting procedure. There exist two parameters, β1 and β2 that allow us to scale the volume fraction and the non-dimensional temperature to fit the data of a T-c phase diagram, i.e., T = β1T* and c = β2ϕaa. Once the phase diagram is computed, we obtain a functional relation between T* and ϕaa, ϕaa = f(T*) (note that f has different branches, a dilute and a condensed branch). If we know both parameters we can rescale the previous relation to obtain c = β2f(T/β1), a predictor for the concentration. We can find both parameters by minimizing the following function:
where cexp are the experimental values of the concentration, σ is the standard deviation of the experimental points. The sum runs over all experimental points including all branches and all values of the salt concentration. The parameter β1 is allowed to vary with the salt concentration on account of the strong dependence of the permittivity on salt concentration.
Note that we do not assume any particular functional dependencence of ɛr on salt, we simply fit a value of β1 at each salt concentration. On the other hand, β2 is considered independent of salt concentration, which is the most parsimonious choice. Finally, note that the lack of a good theory for the dependencence of ɛr on salt implies that a single value of β1 has to be selected for the computation of the salt-concentration phase diagrams, which limits the agreement of the model with the experimental data.
Equation 9 is minimized using a sequential quadratic programming algorithm as implemented in Octave. The parameter χ2 will provide then a measure of the goodness of fit for each case. In Table 1 we give a summary of all fitting parameters for all cases we have considered.
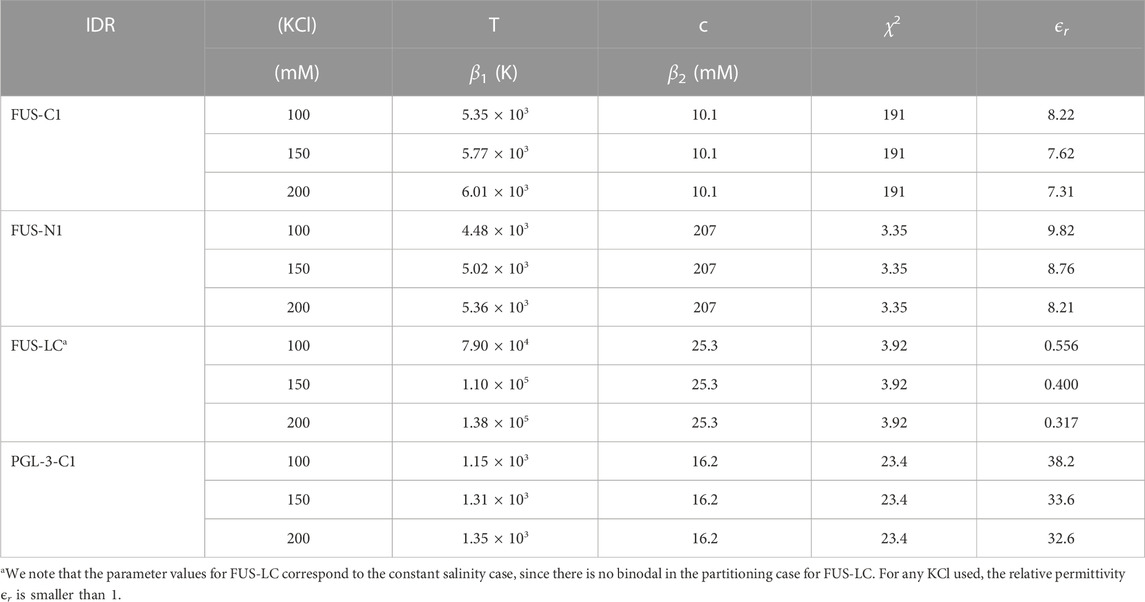
TABLE 1. Fitting parameters for the IDRs of FUS and PGL-3 at KCl and temperatures used in experiments. The temperature T is scaled via the parameter β1 (K) and the concentration c is scaled via β2 (mM).
The phase behavior of a given protein is encoded in its free energy function f,
As indicated in Figure 1A, the free energy has an entropic part S, representing the Flory-Huggins interactions
where N denotes the number of amino acids. Apart from the volume fraction of the amino acids of the protein ϕaa, the volume fraction of counterions ϕc and the volume fraction ϕw of water, we also include in our analysis the volume fraction of salt ions KCl (ϕs) as an additional variable. The second term fel represents the electrostatic multivalent interactions of protein chains with each other and the surrounding salt solution, and in our case these interactions drive LLPS. Thus, it is this part of the free energy for which the Random Phase Approximation (RPA) is being applied in order to account for the dependence of the free energy on the protein structure (see Field theoretic approach in the Methods and Materials section). After we determine the regions of the protein with a high disorder tendency, we derive the temperature-protein concentration and salt-protein concentration phase diagrams, as sketched in Figure 1B, based on the free energy function f for the proteins PGL-3 and FUS (see Computation of phase diagrams in Methods and Materials section).
We first test the predictions of this model with experimental results for a range of different bulk concentrations of recombinant PGL-3 in an in vitro phase-separation assay. The experiments exhibit the generic behaviour that higher PGL-3 concentrations are necessary at increasing temperatures in order to initiate LLPS at physiological salt (150 mM KCl) concentration. This is quantified at each temperature with a corresponding protein saturation concentration cout (Figures 2B, C).
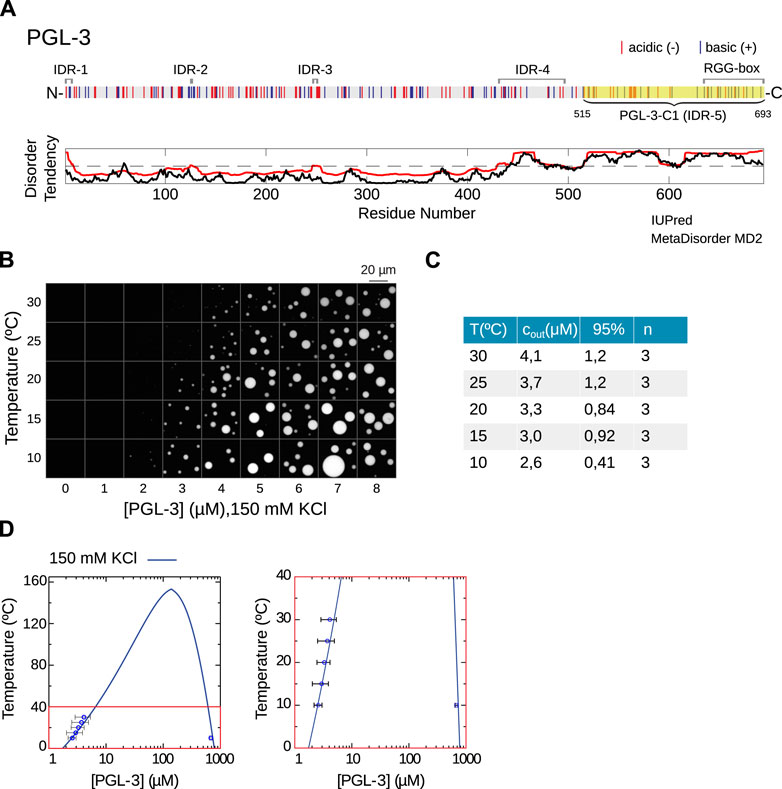
FIGURE 2. Phase separation of PGL-3. (A) Sequence of C. elegans PGL-3 with negatively (red) and positively (blue) charged amino acids. MetaDisorder MD2 (red) and IUPred (black) identify five disordered regions with IDR-5 (PGL-3-C1) at the C-terminus being the longest and RGG-box as in [15]. PGL-3-C1 (highlighted) is used for the computations of the phase diagrams below. (B) Experimental data show the temperature- and concentration-dependent phase separation of PGL-3 at physiological salt conditions of 150 mM KCl. (C) Quantification of data in (B) to derive cout. n is the number of repetitions of the experiment, 95% corresponds to the confidence interval. (D) Predicted temperature-protein concentration phase diagram for PGL-3-C1 based on RPA. The phase diagram is computed with ɛr = 33.6 and β2 = 16.2 mM, using Eqs 2–7 (see Methods and Materials). To the right is a zoom of the red region.
To investigate the role of intrinsically disordered regions (IDRs) of PGL-3, we determine (using MetaDisorder MD2) four small disordered regions (IDRs) and one large IDR (IDR-5: aa 515-693) near the C-terminus, which we denote by PGL-3-C1, see Figure 2A. It is the longest linear sequence predicted to lack a secondary structure. Indeed, this region has previously been shown to include a set of six C-terminal RGG repeats (aa 633-695), which bind RNA and promote droplet formation [15]. For the derivation of the binodal, specifically to find the RPA free energy due to the electrostatic interactions (fel), we use the longest IDR PGL-3-C1.
For the quantitative comparison, we need to relate the PGL-3 volume fraction ϕaa and the non-dimensional temperature T* in terms of the experimentally accessible PGL-3 concentration (c) and temperature (T), respectively.
To relate ϕaa with c we could assume, as it is sometimes done, that we have a lattice with each lattice site having the volume of a water molecule and that an amino acid occupies exactly one site. This provides a conversion factor (Eq. 7), but it is at best a crude estimation. Similarly, the non-dimensional temperature depends on the relative permittivity ɛr (see Eq. 8). A complete theory to derive the value of ɛr is lacking, thus leaving us with little choice but to fit both conversion factors β1 and β2 for T = β1T* and c = β2ϕaa. Note that ɛr is expected to have a strong dependence on salt concentration, and hence we will fit β1 independently for each temperature phase diagram at each salinity. (See Materials and Methods for the details).
The experimental values were obtained using a method that calculates cin and cout by measuring the volume of the condensed phase in an enclosed compartment with fluorescence microscopy. This method relies on the linear relationship between total protein concentration and condensed phase volume fraction. A visual example of this linear relationship can be observed in Figure 2B for PGL-3 at different temperatures. Figure 2B shows that an increase in temperature is accompanied by an increase in the proetin concentration required for phase separation (cout). Here, we used water-in-oil emulsions to encapsulate the protein solutions immediately after triggering phase separation. The corresponding experimental values of cout are presented in the table in Figure 2C.
The theoretical phase diagram in Figure 2D reaches its maximum near 160°C. At this point the slope of the phase diagram is clearly discontinuous, thus creating a pointy feature. In the zoom on the temperature range of the experimental data (Figure 2D, right panel), we observe a good agreement between theory and experimental data, particularly for lower temperatures. The value of the concentration for the theoretical condensed branch at 10°C does not fall strictly within the 95% confidence interval, but it is nevertheless close. Considering that we only have two parameters at our disposal, we can consider this agreement of experiments and theory very good. The goodness of fit is quantified by the comparatively low value of the χ2 parameter (see Table 1 in Methods and Materials).
Our theoretical model allows for a variable salt concentration. As a consequence, the protein-poor and protein-rich phases may have different equilibrium salt concentrations, which implies in turn that the tie lines connecting both equilibria have a non-zero slope. We note that this is responsible for the characteristic pointy shape of the temperature phase diagram in Figure 2D, which is a path along the complete 3D phase diagram (shown in the Supplementary Figure S1). Experimentally, the value of the saturation concentration cout is found by extrapolation at a value where the salt concentration in the supernatant phase is fixed. This implies a constant salt concentration in the protein-poor branch but a varying salt concentration in the protein-rich branch. This is the underlying cause of the non-smoothness of the binodal curve at the point where both branches meet.
Starting with the protein-poor branch we measure how salt affects cout. Again we obtain a generic behaviour where higher salt concentration requires higher protein concentration for phase separation of PGL-3 to occur (Figure 3A). Compared to the dependence we saw for temperature, however, our experimental results suggest that salt has a stronger influence on cout. Specifically, in the range from 100 to 220 mM KCl at 20°C, cout changes approximately 30-fold from 1.12 to 34 μM (Figure 3B). For the quantitative comparison against experimental results for the salt-concentration phase diagram we use the now already determined scaling parameters to derive the phase diagram from our theoretical model. For that purpose we use the scaling parameters fitted at a constant salt concentration of 150 mM KCl, since a model that captures how permittivity changes with salt concentration is not available.
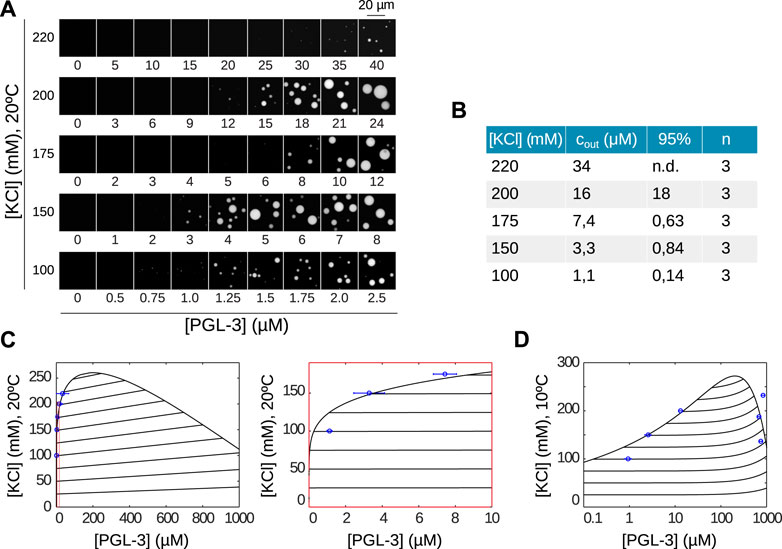
FIGURE 3. Salt partitioning and the domain PGL-3-C1 capture LLPS for PGL-3. (A) Salt- and concentration-dependent phase separation of PGL-3 at 20°C. They show higher concentration of PGL-3 is needed for higher salt concentrations in order to initiate phase separation. (B) Quantification of data in A to derive cout with n = 3 repetitions, 95% denotes the corresponding confidence interval. (C) Predicted salt-concentration phase diagram based on PGL-3-C1 computed with the same parameter values and methods as in Figure 2. Comparison to experimental data are shown for the dilute branch at 20°C. Panel to the right (red) is a zoom into the left panel. Also shown are the theoretically predicted tie lines showing a slightly positive slope. (D) Predicted salt-concentration phase diagram based on PGL-3-C1 computed as in (C) but at 10°C and compared to experimental data for both (dilute and condensed) branches. Note that the graph is shown in semi-logarithmic scale, including the tie lines.
The resulting theoretical curve at 20°C (Figure 3C) has a maximum near 250 mM KCl, a salinity above which we do not expect LLPS.
The agreement of the overlaid experimental points with the theoretical dilute branch (Figure 3C, right panel) is very good, with the discrepancy with the confidence interval stemming from the fact that the value of the permittivity varies strongly with salt concentration, and we are considering it to be constant. At the lower temperature of 10°C we observe a similar good agreement between theory and experiments in the dilute branch (Figure 3D) and on the condensed branch, again considering we only have two parameters at our disposal.
Note that our theoretical model provides a prediction for the slope of the tie lines and the salt content of the protein-rich branch. As an example, for 10°C and a salt concentration of 150 mM in the protein-poor branch, we obtain a salt concentration of 187 mM in the protein-rich branch. This corresponds to an increase of salt in the condensed phase of 25% and a slope of the tie line equal to 51.9 (M KCl/M PGL-3).
We expect to test these results in future experiments.
We have shown, in the case of PGL-3, how the prediction of its temperature vs. protein concentration or salt vs. protein concentration phase diagrams can be achieved using only minimal experimental input data. However, the actual predicting power of our approach is revealed for structurally more complex proteins such as FUS. In contrast to PGL-3, which has only one long, continuous IDR, the application of the same machine learning tools yields that FUS has two long IDRs. Note that the structure of FUS is well known [28], but we proceed according to the output of the disorder prediction software, since our stated goal is to apply our method to proteins with unknown structure. Nevertheless, it is known that FUS contains a prion-like low complexity domain [29] (LC) (aa 1-214), which overlaps with the predicted IDR near the N terminus (aa 1-285, FUS-N1) (Figure 4A) and is mostly devoid of charged amino acids.
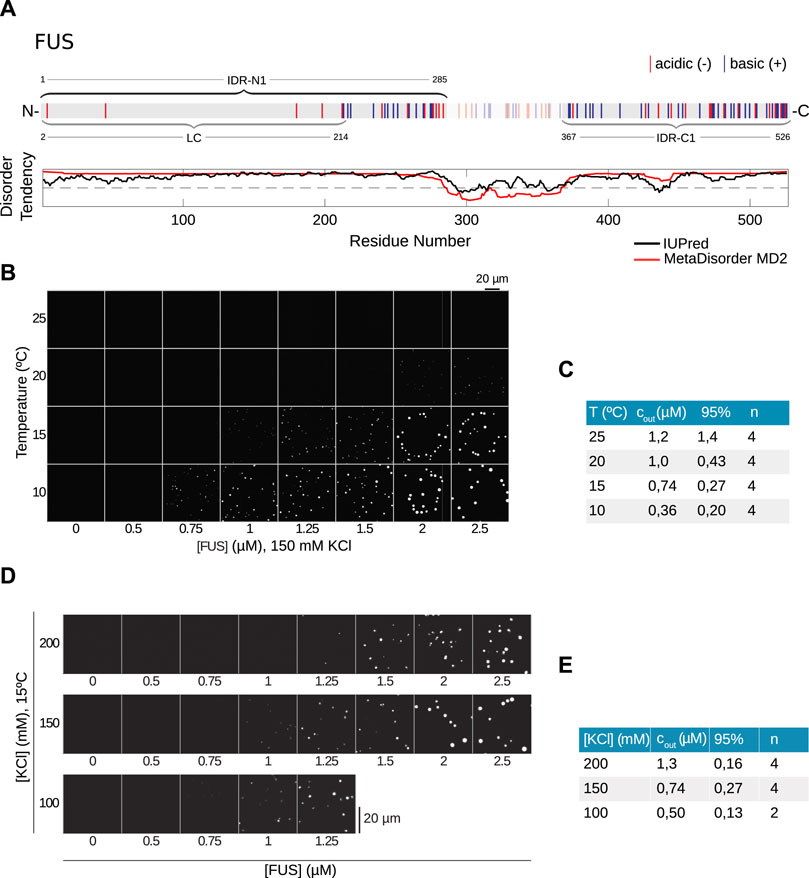
FIGURE 4. The LLPS of FUS depends weakly on salt concentration. (A) Sequence of hFUS with predicted N-terminal IDR (IDR-N1), which contains the well-described low complexity (LC) region [14], and a C-terminal IDR (IDR-C1). (B) Temperature- and concentration-dependent LLPS of hFUS-mEGFP at 150 mM KCl. (C) Quantification of data in (B) to derive cout with n = 4 repetitions, 95% denotes the corresponding confidence interval. (D) Salt- and concentration-dependent phase separation of hFUS-mEGFP show a weak salt dependence of LLPS. (E) Quantification of data in (D) to obtain cout. Column n corresponds to the number of repetitions and 95% denotes the corresponding confidence interval.
We predict an additional IDR near the C terminus (aa 367-526, FUS-C1) (Figure 4A). Within the latter IDR it is localized a Zn-finger domain, which is reported to have a role in RNA binding and sequence recognition [30]. The role of these domains in LLPS of FUS is still not known and in particular the role of the LC domain is still debated, even if it is known to be necessary for phase separation, see the discussion below.
Initially, the comparison of the theoretical and experimental results is performed using FUS-N1, which gives the smallest overall error (see Table 1 in Methods and Materials), and later we also explore the consequences of using the other IDRs we have identified. We show that we can not only predict if FUS undergoes LLPS by itself under physiological conditions, but we can now test whether our approach can determine which domain is responsible for LLPS of FUS.
In a similar fashion as for PGL-3, we first investigate experimentally the temperature-protein concentration phase diagram in order to fit the parameters of the model. In contrast to PGL-3, we observe for FUS that the influence of temperature on the saturation concentration cout is comparable to the change we see for salt, with a 3.4-fold increase from 0.36 to 1.21 μM between 10°C and 25°C (Figures 4B, C) and a salt dependence in a range of 100–200 mM KCl with a 2.5-fold change from 0.5 to 1.26 μM (Figures 4D, E). Considering the FUS-N1 region for the model (IDR-N1, highlighted in Figure 5A), the theoretical results show good agreement with the experimental results (Figure 5B). The theoretical phase diagram has a maximum near 150°C and has an even more striking pointy feature. If we zoom in to the region with a biologically meaningful temperature (Figure 5A, right panel), we can see how well the overlaid experimental points fall upon the theoretical dilute branch. In this case, the experimental point at 10°C also falls directly upon the condensed branch, thus giving an even better fit that PGL-3, which is manifest in the value of the χ2 parameter (see Table 1 in Methods and Materials).
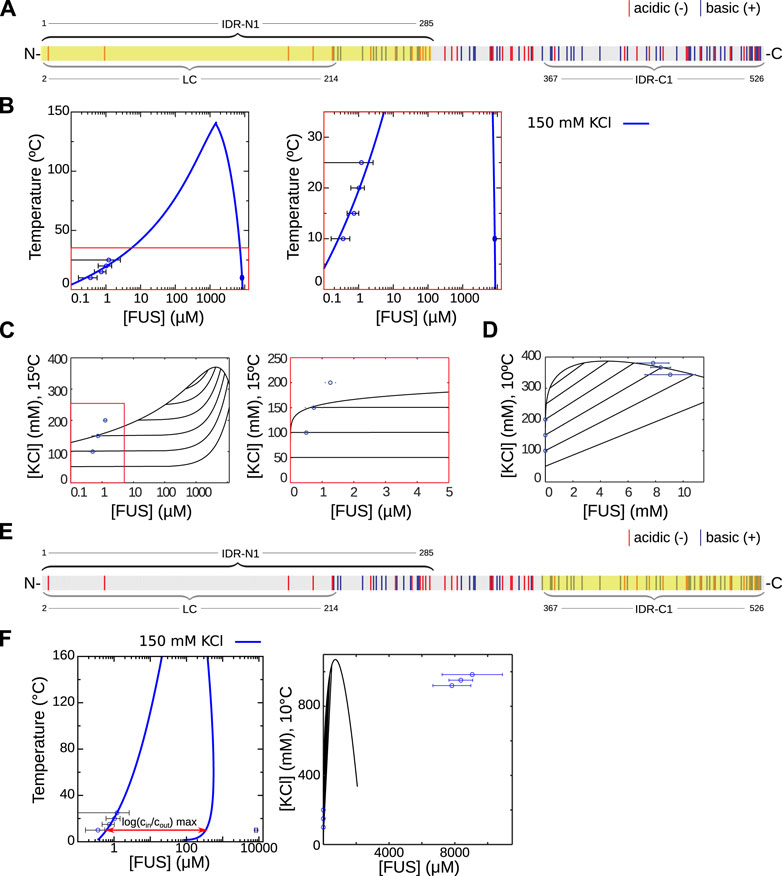
FIGURE 5. The domain FUS-N1 is responsible for LLPS in FUS. (A) Intrinsically disordered region FUS-N1 (IDR-N1, highlighted) (B) Predicted temperature-concentration phase diagram based on RPA analysis using FUS-N1 with parameter values ɛr = 8.76 and β2 = 207 mM, for 150 mM KCl. C Predicted salt-concentration phase diagram for T = 20°C obtained using the same parameter values as in (B). The right panel is a zoom to the red square in the left panel. Experimental data is shown for the dilute branch (D) Predicted salt-concentration phase diagram for T = 20°C, same parameters as (B). Experimental data is shown for the dilute and condensed branches. (E) Intrinsically disordered region FUS-C1 (IDR-C1, highlighted) (F) Phase diagrams in the FUS-C1 case. Left panel: theoretical temperature-concentration diagram at 150 mM KCl obtained with parameter values ɛr = 7.62 and β2 = 10.1 mM. Right panel: salt-concentration diagram obtained with the same parameters. Notice that the experimental points cannot be fitted to the condensed branch of the model, since the ratio of cin to cout is much greater than its maximum value (see discussion in the main text).
As in the PGL-3 case, the experimentally fitted parameter values obtained for the temperature-concentration phase diagram are also used to generate the salt-concentration phase diagram for comparison to the experimental data. The overlay of experimental points and the theory captures the trend of the change of concentration with the salinity in the dilute branch (Figure 5C). Again the discrepancy in the values of the concentration stems from the fact that we use the value of the permittivity at 150 mM KCl but we know that its value depends strongly on salt concentration. In the condensed branch we obtain a very good agreement between theory an experiments (Figure 5D), probably on account of the smaller variation of the salinity. For 10°C we can compute the slope of the tie line for a salt concentration of 150 mM in the dilute branch, giving 25.6 (M KCl/M FUS), and a predicted salt concentration of 366 mM, and thus an increase of 144% in the condensed branch, which we also expect to be tested experimentally in the future.
We also investigated the FUS-LC domain and found that the theoretical curve cannot be fitted to allow for comparison with the experimental results, since the scaling factor involves a permittivity smaller than 1 as shown in Table 1 in Methods and Materials. Thus, interestingly, the LC domain should not play a dominant role in LLPS of FUS, according to our approach. Other than FUS-N1, a further IDR should be considered according to the results from MetaDisorder, FUS-C1 (highlighted in Figure 5E). In principle one could compare the fits and reason in terms of the goodness of fit (i.e., the χ2 parameter given in the Methods and Materials section) to decide which region is most likely responsible. But a side-by-side comparison of the overlay of the experimental data points for FUS-N1 and FUS-C1 shows a much more clear-cut result, which is that the experimental results cannot be fitted to the FUS-C1 curve (See Figure 5F). This is a consequence of salt partitioning and our parsimonious fitting approach.
Salt partitioning and the requisite that the dilute branch has a constant salt concentration give a very constrained form of the phase diagram (Figure 5F, left panel). This is in contrast with constant-salt models, which give a binodal curve that can be conveniently scaled to fit most experimental data. In particular, salt partitioning imposes a maximum ratio of the protein concentration in the condensed branch with the concentration in the dilute branch. This maximum ratio is marked explicitly with an arrow in Figure 5F, left panel. The arrow has a length of
This surprising result is in clear contrast with models where the salinity is considered constant in both phases (as shown in Supplementary Figure S1) and thus clearly shows the predictive power of our model, discarding regions for being responsible for LLPS while giving a testable prediction for the salinity of the condensed phase.
In this study we investigated the disordered regions of the C. elegans protein PGL-3 and the human fused in sarcoma (FUS) protein regarding their role in LLPS using the Random Phase Approximation (RPA) for the electrostatic interactions and including variable salt concentrations. By direct comparison of the resulting theoretical predictions for the phase behaviour with in vitro experimental results under physiological salt conditions we show that the model is capable to identify specific domains that trigger LLPS.
For FUS, the role in phase separation of the different domains, such as the LC domain, has been controversial, starting with its structural identification. In fact, the LC domain was first identified in a bioinformatics survey for prion-like domains in different proteins [31,32], identifying the LC region to amino acids 1 to 239. Kato et al. [29] identified this region using SEG [33] to be amino acids 2 to 214. We have adopted their definition, as it has become a standard in the subsequent literature, but it has not been possible to reproduce their result using SEG. Kato et al. [29] identified the FUS-LC region as responsible for the protein hydrogel formation by performing experiments with the excised domain, but used a very large concentration (
Our results on FUS clearly single out the IDR N1 at the N-terminus (1-285) to lead to phase separation of the full protein in comparison with experiments, while other candidate regions such as the LC or IDR at the C-terminus either require a permittivity smaller than one or cannot be fitted to the experimental data at all. These results are in disagreement with [29] but [14] and [36] support our findings. They showed that the LC domain needs indeed very high concentrations in order to phase-separate on its own, which was the regime tested by Kato et al. [29]. Wang et al. [14] further ascertain that it is the interaction of the LC region and the RNA binding domain which makes the phase transition possible at low protein concentrations. In other recent studies [37,38], coarse grained models in combination with MD simulations have been used. In particular in [38] it is shown that the longer a sequence containing the LC is, the higher is the propensity towards phase separation. In accordance with our results, Kang et al. [39] demonstrate experimentally that an extended LC domain containing the RGG region next to it phase separated at a much smaller saturation concentration than the LC domain. The domain reported by Kang et al. [39] is very similar to our N1 domain, thus supporting our theoretical results. Moreover, our results show that the phase diagram corresponding to the FUS-C1 region cannot be fitted to the experimental results, thus showing that our model is able to discard IDRs as responsible for phase separation in different ways. These findings suggest further experimental studies on the role of IDR N1, specifically on the role of the amino acids that are lacking in the LC region. They also show the need to systematically explore the impact of variations as well as mutations of these regions in our future theoretical studies.
We further note that the connection of the domain structure of proteins with their phase behaviour may be rooted in the underlying model system for polyampholytes, that we used in our analysis. Indeed, Lytle et al. [40] investigated the impact of the blockyness of polyampholytes on their phase behaviour, and Das et al. [41] compared results from Monte Carlo simulations to RPA for specific polyampholyte sequences showing that patterns of larger blocks of charge lead to significantly higher tendency to phase separate.
Also, one can argue that the failure of FUS-LC to phase separate in our framework is directly related to the fact that our approach only considers elctrostatic interactions between charged residues and not other kind of interactions. Then, since the FUS-LC domain is mostly devoid of charges it is not surprising that it does not phase separate. We see this as a confirmation of the relevance of charged residues in the case of FUS, and thus our simple RPA approach is appropriate to understand the main mechanism of LLPS in FUS. We do not claim, however, that we capture the complete picture of LLPS in FUS, since, for instance, FUS-LC is known to phase-separate, even if it does so at a very high concentrations due to other interaction mechanisms [42], and the RGG domain near the C terminus is known to influence LLPS [34].
We have also shown the impact of salt distribution on the resulting phase diagram and obtained salt partitioning into the condensed phase for both proteins, making manifest the strong salt dependence of the permittivity. The inclusion of salt as a further variable in the model led to phase diagrams with a characteristic pointy feature, corresponding to a discontinuity in the slope of the binodal curve. We showed that this is a generic feature and is rooted in the fact that salt concentration is not imposed to be constant everywhere, but is allowed to vary in the condensed phase. In previous studies this fact has often been neglected but, in fact, it is thermodynamically not consistent to do so.
The experimental corroboration of our predictions on the salt concentration in the condensed phase will be part for our future studies, requiring a detailed discussion of the theoretical model for polyampholyte solutions that we used as a model system for proteins. Here, we remark that the question of salt partitioning during LLPS is also not completely understood, even for polyelectrolytes and polyampholytes. This is the case in the context of Random Phase Approximation, Liquid-State-Theory, Monte Carlo simulation and Voorn-Overbeek theory, as well as in experimental studies [43–49]. Voorn-Overbeek theory predicts an excess of salt in the condensed phase, corresponding to a positive slope of the tie line, while more recent theoretical and experimental studies find that excluded volume effects are responsible for expelling the salt counterions into the dilute phase, thus predicting a negative slope of the tie lines. However, for low overall salt concentration this can be reversed, see, for example, [49]. Also, molecular dynamics simulations seem to indicate that electrical neutrality and a lack of preferential interactions between salt ions and interactions are enough to obtain a reasonable prediction of the concentration of salt ions in the condensed phase [50]. In summary, the slope of the tie lines and salt partitioning depend strongly on the model used, and more experimental results are needed to guide the theoretical efforts.
While RPA is the appropriate tool to address the structural properties of IDPs [51], recent discussion in [41], where explicit chain simulation and RPA are compared for a number of polyampholyte sequences, suggest higher order contributions of the functional integral of the partition function in order to address the accuracy of RPA [11,23,52], specifically in the protein-poor phase.
We also note that further physical interactions also play a role and are still being discovered [53]. Currently, our model does not account for non-specific contacts between positively charged arginine-glycine-glycine (RGG) domains, such as those found in FUS or PGL-3, and negatively charged RNA, which can strengthen the binding affinity of existing RNA binding domains and could provide alternative interaction modes. Also, heterotypic interactions with other regions of the same polypeptide or other proteins are known to drive phase separation [14] but they can be included in principle into our framework.
The raw data supporting the conclusion of this article will be made available by the authors, without undue reservation.
EM designed the theoretical research, carried out all simulations and parameter estimations and helped prepare the manuscript. AF and JI-A carried out the experiments, analyzed the data and helped prepare the manuscript. SR helped conceive the research and to prepare the manuscript. BW conceived the research, supervised the project and prepared the manuscript. All authors contributed to the article and approved the submitted version.
We acknowledge Anthony Hyman for providing all the support needed for the experimental part of this project. EM would like thank the Weierstrass Institute for hosting a research visit. EM and BW would like to thank Andreas Münch for helpful discussions on the theoretical aspects of the research project. For discussions and help with the experimental part of the project we thank, Martine Ruer, Patrick McCall, Tylor Harmon, Jie Wang, and Titius Franzmann. We thank the light microscopy, chromatography, and protein purification facilities at MPI-CBG for their support. We thank Olympus for providing the CSU-W1 SoRa spinning-disc system based on an IXplore IX83 microscope. AF was supported by the ELBE postdoctoral fellows program and the Max Planck Research Network for Synthetic Biology (MaxSynBio) consortium, jointly funded by the Federal Ministry of Education and Research of Germany and the Max Planck Society.
The authors declare that the research was conducted in the absence of any commercial or financial relationships that could be construed as a potential conflict of interest.
All claims expressed in this article are solely those of the authors and do not necessarily represent those of their affiliated organizations, or those of the publisher, the editors and the reviewers. Any product that may be evaluated in this article, or claim that may be made by its manufacturer, is not guaranteed or endorsed by the publisher.
The Supplementary Material for this article can be found online at: https://www.frontiersin.org/articles/10.3389/fphy.2023.1213304/full#supplementary-material
1. Banani SF, Lee HO, Hyman AA, Rosen MK. Biomolecular condensates: Organizers of cellular biochemistry. Nat Rev Mol Cel Biol (2017) 18:285–98. doi:10.1038/nrm.2017.7
2. Shin Y, Brangwynne CP. Liquid phase condensation in cell physiology and disease. Science (2017) 357:eaaf4382. doi:10.1126/science.aaf4382
3. Alberti S, Hyman AA. Biomolecular condensates at the nexus of cellular stress, protein aggregation disease and ageing. Nat Rev Mol Cel Biol (2021) 22:196–213. doi:10.1038/s41580-020-00326-6
4. Brangwynne CP, Tompa P, Pappu RV. Polymer physics of intracellular phase transitions. Nat Phys (2015) 11:899–904. doi:10.1038/nphys3532
5. Rauscher S, Pomès R. The liquid structure of elastin. Elife (2017) 6:e26526. doi:10.7554/elife.26526
6. Flory PJ. Thermodynamics of high polymer solutions. J Chem Phys (1942) 10:51–61. doi:10.1063/1.1723621
7. Huggins ML. Some properties of solutions of long-chain compounds. J Phys Chem (1942) 46:151–8. doi:10.1021/j150415a018
8. Overbeek JTG, Voorn M. Phase separation in polyelectrolyte solutions. theory of complex coacervation. J Cell Comp Physiol (1957) 49:7–26. doi:10.1002/jcp.1030490404
9. Zhang X, Vigers M, McCarty J, Rauch JN, Fredrickson GH, Wilson MZ, et al. The proline-rich domain promotes Tau liquid–liquid phase separation in cells. J Cel Biol (2020) 219:e202006054. doi:10.1083/jcb.202006054
10. Lin Y-H, Forman-Kay JD, Chan HS. Sequence-specific polyampholyte phase separation in membraneless organelles. Phys Rev Lett (2016) 117:178101. doi:10.1103/physrevlett.117.178101
11. Lin Y-H, Brady JP, Chan HS, Ghosh K. A unified analytical theory of heteropolymers for sequence-specific phase behaviors of polyelectrolytes and polyampholytes. J Chem Phys (2020) 152:045102. doi:10.1063/1.5139661
12. Dinic J, Marciel AB, Tirrell MV. Polyampholyte physics: Liquid-liquid phase separation and biological condensates. Curr Opin Colloid Interf Sci (2021) 54:101457. doi:10.1016/j.cocis.2021.101457
13. Brangwynne CP, Eckmann CR, Courson DS, Rybarska A, Hoege C, Gharakhani J, et al. Germline p granules are liquid droplets that localize by controlled dissolution/condensation. Science (2009) 324:1729–32. doi:10.1126/science.1172046
14. Wang J, Choi J-M, Holehouse AS, Lee HO, Zhang X, Jahnel M, et al. A molecular grammar governing the driving forces for phase separation of prion-like rna binding proteins. Cell (2018) 174:688–99.e16. doi:10.1016/j.cell.2018.06.006
15. Saha S, Weber CA, Nousch M, Adame-Arana O, Hoege C, Hein MY, et al. Polar positioning of phase-separated liquid compartments in cells regulated by an mrna competition mechanism. Cell (2016) 166:1572–84.e16. doi:10.1016/j.cell.2016.08.006
16. Patel A, Lee HO, Jawerth L, Maharana S, Jahnel M, Hein MY, et al. A liquid-to-solid phase transition of the als protein fus accelerated by disease mutation. Cell (2015) 162:1066–77. doi:10.1016/j.cell.2015.07.047
17. Kozlowski LP, Bujnicki JM. MetaDisorder: A meta-server for the prediction of intrinsic disorder in proteins. BMC Bioinformatics (2012) 13:111. doi:10.1186/1471-2105-13-111
18. Dosztányi Z. Prediction of protein disorder based on iupred. Protein Sci (2018) 27:331–40. doi:10.1002/pro.3334
19. Baeurle SA. Method of Gaussian equivalent representation: A new technique for reducing the sign problem of functional integral methods. Phys Rev Lett (2002) 89:080602. doi:10.1103/PhysRevLett.89.080602
20. Lin Y-H, Song J, Forman-Kay JD, Chan HS. Random-phase-approximation theory for sequence-dependent, biologically functional liquid-liquid phase separation of intrinsically disordered proteins. J Mol Liquids (2017) 228:176–93. doi:10.1016/j.molliq.2016.09.090
21. Castelnovo M, Joanny JF. Complexation between oppositely charged polyelectrolytes: Beyond the Random Phase Approximation. The Eur Phys J E (2001) 6:377–86. doi:10.1007/s10189-001-8051-7
22. Borukhov I, Andelman D, Orland H. Random polyelectrolytes and polyampholytes in solution. Eur Phys J B - Condensed Matter Complex Syst (1998) 5:869–80. doi:10.1007/s100510050513
23. Borue VY, Erukhimovich IY. A statistical theory of weakly charged polyelectrolytes: Fluctuations, equation of state and microphase separation. Macromolecules (1988) 21:3240–9. doi:10.1021/ma00189a019
24. Ermoshkin AV, Olvera de la Cruz M. Gelation in strongly charged polyelectrolytes. J Ploym Sci B (2004) 42:766–76. doi:10.1002/polb.10752
25. Golub GH, Welsch JH. Calculation of gauss quadrature rules. Math Comput (1969) 23:221–30. doi:10.1090/s0025-5718-69-99647-1
26. Glaser A, Liu X, Rokhlin V. A fast algorithm for the calculation of the roots of special functions. SIAM J Scientific Comput (2007) 29:1420–38. doi:10.1137/06067016x
27. Govaerts WJ Numerical methods for bifurcations of dynamical equilibria, 66. Philadelphia: Society for Industrial and Applied Mathematics (2000).
28. Aulas A, Vande Velde C. Alterations in stress granule dynamics driven by tdp-43 and fus: A link to pathological inclusions in als? Front Cell Neurosci (2015) 9:423. doi:10.3389/fncel.2015.00423
29. Kato M, Han TW, Xie S, Shi K, Du X, Wu LC, et al. Cell-free formation of rna granules: Low complexity sequence domains form dynamic fibers within hydrogels. Cell (2012) 149:753–67. doi:10.1016/j.cell.2012.04.017
30. Loughlin FE, Lukavsky PJ, Kazeeva T, Reber S, Hock E-M, Colombo M, et al. The solution structure of fus bound to rna reveals a bipartite mode of rna recognition with both sequence and shape specificity. Mol Cel (2019) 73:490–504.e6. doi:10.1016/j.molcel.2018.11.012
31. Cushman M, Johnson BS, King OD, Gitler AD, Shorter J. Prion-like disorders: Blurring the divide between transmissibility and infectivity. J Cel Sci (2010) 123:1191–201. doi:10.1242/jcs.051672
32. Alberti S, Halfmann R, King O, Kapila A, Lindquist S. A systematic survey identifies prions and illuminates sequence features of prionogenic proteins. Cell (2009) 137:146–58. doi:10.1016/j.cell.2009.02.044
33. Wootton JC, Federhen S. [33] analysis of compositionally biased regions in sequence databases. In: Methods in enzymology, 266. Elsevier (1996). p. 554–71.
34. Murthy AC, Tang WS, Jovic N, Janke AM, Seo DH, Perdikari TM, et al. Molecular interactions contributing to fus sygq lc-rgg phase separation and co-partitioning with rna polymerase ii heptads. Nat Struct Mol Biol (2021) 28:923–35. doi:10.1038/s41594-021-00677-4
35. Burke KA, Janke AM, Rhine CL, Fawzi NL. Residue-by-residue view of in vitro fus granules that bind the c-terminal domain of rna polymerase ii. Mol Cel (2015) 60:231–41. doi:10.1016/j.molcel.2015.09.006
36. Luo F, Gui X, Zhou H, Gu J, Li Y, Liu X, et al. Atomic structures of fus lc domain segments reveal bases for reversible amyloid fibril formation. Nat Struct Mol Biol (2018) 25:341–6. doi:10.1038/s41594-018-0050-8
37. Benayad Z, von Bülow S, Stelzl LS, Hummer G. Simulation of fus protein condensates with an adapted coarse-grained model. J Chem Theor Comput (2021) 17:525–37. doi:10.1021/acs.jctc.0c01064
38. Dignon G, Zheng W, Kim Y, Best R, Mittal J. Sequence determinants of protein phase behavior from a coarse-grained model. Plos Comput Biol (2018) 14:e1005941. doi:10.1371/journal.pcbi.1005941
39. Kang J, Lim L, Lu Y, Song J. A unified mechanism for llps of als/ftld-causing fus as well as its modulation by atp and oligonucleic acids. PLoS Biol (2019) 17:e3000327. doi:10.1371/journal.pbio.3000327
40. Lytle TK, Chang L-W, Markiewicz N, Perry SL, Sing CE. Designing electrostatic interactions via polyelectrolyte monomer sequence. ACS Cent Sci (2019) 5:709–18. doi:10.1021/acscentsci.9b00087
41. Das S, Eisen A, Lin Y-H, Chan HS. A lattice model of charge-pattern-dependent polyampholyte phase separation. The J Phys Chem B (2018) 122:5418–31. doi:10.1021/acs.jpcb.7b11723
42. Murthy AC, Dignon GL, Kan Y, Zerze GH, Parekh SH, Mittal J, et al. Molecular interactions underlying liquid-liquid phase separation of the fus low-complexity domain. Nat Struct Mol Biol (2019) 26:637–48. doi:10.1038/s41594-019-0250-x
43. Perry SL, Sing CE. Prism-based theory of complex coacervation: Excluded volume versus chain correlation. Macromolecules (2015) 48:5040–53. doi:10.1021/acs.macromol.5b01027
44. Radhakrishna M, Basu K, Liu Y, Shamsi R, Perry SL, Sing CE. Molecular connectivity and correlation effects on polymer coacervation. Macromolecules (2017) 50:3030–7. doi:10.1021/acs.macromol.6b02582
45. Zhang P, Shen K, Alsaifi NM, Wang ZG. Salt partitioning in complex coacervation of symmetric polyelectrolytes. Macromolecules (2018) 51:5586–93. doi:10.1021/acs.macromol.8b00726
46. Madinya JJ, Chang L-W, Perry SL, Sing CE. Sequence-dependent self-coacervation in high charge-density polyampholytes. Mol Syst Des Eng (2019) 5:632–44. doi:10.1039/C9ME00074G
47. Lytle TK, Sing CE. Transfer matrix theory of polymer complex coacervation. Soft Matter (2017) 13:7001–12. doi:10.1039/C7SM01080J
48. Shen K, Wang ZG. Polyelectrolyte chain structure and solution phase behavior. Macromolecules (2018) 51:1706–17. doi:10.1021/acs.macromol.7b02685
49. Li L, Srivastava S, Andreev M, Marciel AB, de Pablo JJ, Tirrell MV. Phase behavior and salt partitioning in polyelectrolyte complex coacervates. Macromolecules (2018) 51:2988–95. doi:10.1021/acs.macromol.8b00238
50. Zheng W, Dignon GL, Jovic N, Xu X, Regy RM, Fawzi NL, et al. Molecular details of protein condensates probed by microsecond long atomistic simulations. J Phys Chem B (2020) 124:11671–9. doi:10.1021/acs.jpcb.0c10489
51. Rumyantsev AM, Jackson NE, Yu B, Ting JM, Chen W, Tirrell MV, et al. Controlling complex coacervation via random polyelectrolyte sequences. ACS Macro Lett (2019) 8:1296–302. doi:10.1021/acsmacrolett.9b00494
52. Shen K, Wang ZG (2017). Electrostatic correlations and the polyelectrolyte self energy. J Chem Phys 146, 084901. doi:10.1063/1.4975777
Keywords: intrinsically disordered proteins (IDP), Random Phase Approximation (RPA), FUS, liquid-liquid phase separation (LLPS), phase diagrams
Citation: Meca E, Fritsch AW, Iglesias-Artola JM, Reber S and Wagner B (2023) Predicting disordered regions driving phase separation of proteins under variable salt concentration. Front. Phys. 11:1213304. doi: 10.3389/fphy.2023.1213304
Received: 27 April 2023; Accepted: 06 June 2023;
Published: 22 June 2023.
Edited by:
Bruno Rizzuti, National Research Council (CNR), ItalyReviewed by:
Arnab Bhattacherjee, Jawaharlal Nehru University, IndiaCopyright © 2023 Meca, Fritsch, Iglesias-Artola, Reber and Wagner. This is an open-access article distributed under the terms of the Creative Commons Attribution License (CC BY). The use, distribution or reproduction in other forums is permitted, provided the original author(s) and the copyright owner(s) are credited and that the original publication in this journal is cited, in accordance with accepted academic practice. No use, distribution or reproduction is permitted which does not comply with these terms.
*Correspondence: Esteban Meca, ZXN0ZWJhbi5tZWNhQHVjby5lcw==; Barbara Wagner, QmFyYmFyYS5XYWduZXJAd2lhcy1iZXJsaW4uZGU=
Disclaimer: All claims expressed in this article are solely those of the authors and do not necessarily represent those of their affiliated organizations, or those of the publisher, the editors and the reviewers. Any product that may be evaluated in this article or claim that may be made by its manufacturer is not guaranteed or endorsed by the publisher.
Research integrity at Frontiers
Learn more about the work of our research integrity team to safeguard the quality of each article we publish.