 Hao-Liang Chang1,2
 Hao-Tian Ren
 Gang Wang
 Xin-Yu Zhu
- 1Institution of Electronic and Electrical Engineering, Civil Aviation Flight University of China, Guanghan, Sichuan, China
- 2Sichuan General Aircraft Maintenance Engineering Technology Research Center, Guanghan, Sichuan, China
- 3The 10th Research Institute of China Electronics Technology Group Corporation, Chengdu, Sichuan, China
This study mainly involves the methods and experiments of using infrared thermal wave imaging detection technology to detect internal defects in aircraft composite materials. The results were discussed and analyzed. In this paper, the feasibility of the experiment was verified by simulation. In simulation, the minimum accuracy of detectable defects is 4 mm radius under the mesh division accuracy with a correlation coefficient of 5. On this basis, an accurate detection method and prototype nondestructive testing system for defects of aircraft composite materials based on infrared imaging detection technology were designed, which can realize the identification and positioning of defects in aircraft composite material structures, including type, size and accurate depth of defects. Finally, the data collected by the infrared detection system was recognized through YOLO neural network. The test result shows the confidence level for water point defect is more than 0.9, while the confidence level for crack defect is about 0.5. This research result will expand the use case of infrared nondestructive testing technology around the world, and the transformation of the results will help to solve the maintenance problems of aircraft in general aviation.
1 Introduction
Due to their advantages of high heat resistance and strength, low density and thermal expansion coefficient, and small heat capacity and specific gravity, etc., composite materials can save fuel by reducing the weight of aircraft structures and are widely used in the aviation field. Figure 1 shows the total materials used in Boeing series aircraft. The minimum yield strength of carbon fiber-reinforced polymer (CFRP) is 550 MPa, while the density of CFRP is only one-fifth that of steel and three-fifths that of Al-based alloys [1–5]. A lighter weight means lower fuel consumption. However, in the process of preparing and servicing composite materials, internal defects might occur, which greatly reduce their safety performance and pose a major hidden threat to the application fields [6–8]. The existing detection methods, including manual testing, radiographic testing, and ultrasonic testing, are difficult to efficiently, accurately, and non-destructively apply to discover and locate the internal defects of composite materials [9, 10]. For example, manual testing can only inspect defects on the surface. Radiographic testing requires high technical operations and is harmful to the human body. Ultrasonic testing is limited to detecting layered defects parallel to the detection plane of the workpiece.
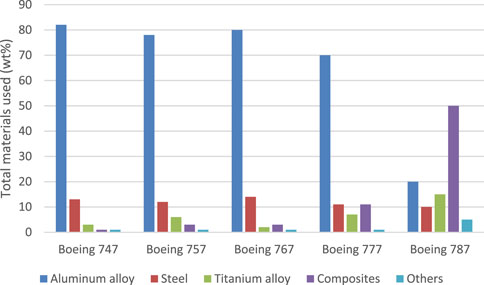
FIGURE 1. Total materials used in Boeing series aircraft.
Infrared imaging recognition technology is used to detect internal defects by displaying the changes in the infrared ray emitted by the sample. This technology is a new non-destructive testing technology with broad application prospects and has been applied to the inspection of aircraft components in recent years and can be used to detect defects in composite materials and metal materials, including debonding defects, water point defects, and corrosion defects [11, 12]. Traditional methods for detecting defects in composite materials used on general aircraft are prone to misjudging minor defects and are unable to accurately locate defects, which can seriously affect the safety performance and maintenance efficiency of these materials [13]. Therefore, studying non-destructive infrared imaging testing technologies and establishing accurate defect detection methods and prototype non-destructive testing systems for aircraft composite materials are of great significance to improve aircraft maintenance efficiency and enhance the reliability and safety of aircraft to ensure their airworthiness [14–17].
This study adopted infrared imaging detection technology with wide adaptability, large observation area, visual quantification, lightweight, non-contact, and non-destructive. Simulations and experiments were combined to realize defect localization and quantitative measurement of defects inside aircraft composite materials. In finite element simulation, the feasibility of the experiment was verified based on the change trends of the surface temperature. Then, through the optical excitation method, controllable infrared excitation was applied to the measured object such that the defects or damage inside the object showed different temperature field changes from the surrounding normal structure. Meanwhile, a thermal imager was used to collect and process thermal image sequences containing time information. Finally, YOLOv5 was used to identify defects in the image sequences with high confidence levels. The results will be conducive to solving maintenance problems of aircraft during navigation.
2 Experimental principles and methods
2.1 Establishment of the heat transfer mechanism for layers of aircraft composite materials
Infrared imaging recognition technology is used to detect defects on the surface and internal uneven or abnormal positions of test samples according to the different thermal conductivities of materials or structures, which has the advantages of environmental protection, high efficiency, non-contact, large detection area, visual results, and wide application range. This technology is suitable for the non-destructive, non-contact assessment of large complex structures of aircraft composite materials and in situ in-service detection [18–21]. According to the composition of aircraft composite materials, different kinds of samples such as aluminum alloy, glass fiber composite, and carbon/epoxy composite are prepared [22–24]. Then, a high-precision infrared camera was used to collect the thermal image sequence. The relationships of temperature and energy of materials with different thicknesses in the space and time dimensions were recorded. Due to the inconsistent thickness of materials in different parts of the aircraft, the heat flow field in the materials is inconsistent, which greatly impacts the accuracy of defect detection under the same experimental conditions. For example, the method can detect shallow defects by heating in a short time rather than deep defects. Therefore, the experiment classified the composite materials in various situations and tested them in groups. Next, different databases were established as reference standards for subsequent tests. A one-dimensional analytical model of the temperature field distribution of each layer was then established to analyze the relationships between material thickness, time, and temperature field distribution of each layer [25–27]. In the one-dimensional case, the heat conduction equation of the material is
where u(x, t) is the material temperature, α = k/ρc is the thermal diffusion coefficient, k is the thermal conductivity, ρ is the density, and c is the specific heat capacity.
Set the initial value at time t = 0:
Then, the substitute boundary condition is
The resulting equation is
At x = 0, the temperature field distribution on the material surface is easily obtained:
Since the depth of the defect from the material surface is d, the problem is transformed to solve the heat conduction equation of a material with a thickness of d. When the boundary condition is met, the mirror image method can be used to obtain the following:
Subtracting (4) from (5) provides the relationship between the contrast temperature of defects on the material surface and t:
For
The collected thermal image sequence shows that the depth of the defects from the material surface can be obtained by calculating t from the time between the application of the external heat source to the material and the appearance of the maximum contrast temperature image
The propagation of heat flux applied on the surface of composite materials is shown in Figure 2.
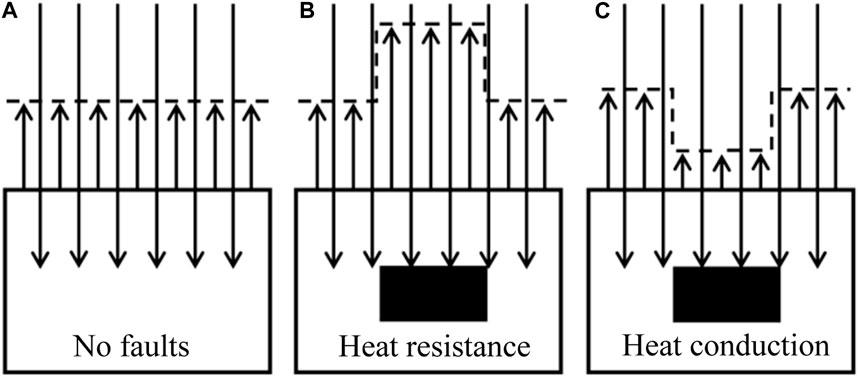
FIGURE 2. Schematic diagram of heat wave propagation in composite materials. (A) Composite material without defects. (B) Composite material with heat resistance defects. (C) Composite material with heat conductivity defects.
In the composite material without defects, the heat wave is evenly radiated on the surface after it is propagated in the material without influence. In composite material with heat resistance defects, the defect shows higher thermal radiation on the surface than the surrounding area after the heat wave is propagated in the material. In composite material with heat conductivity defects, the defect shows lower thermal radiation on the surface than the surrounding area after the heat wave is propagated in the material.
2.2 Establishment of a non-destructive testing system for aircraft composite material based on optical excitation infrared imaging
During the production and use of aircraft composite materials, different types and extents of damage may occur. This section describes the construction of an optical excitation infrared imaging non-destructive testing system based on the thermal conductivity data of aircraft composite materials obtained in Section 2.1. The system composition diagram is shown in Figure 3.
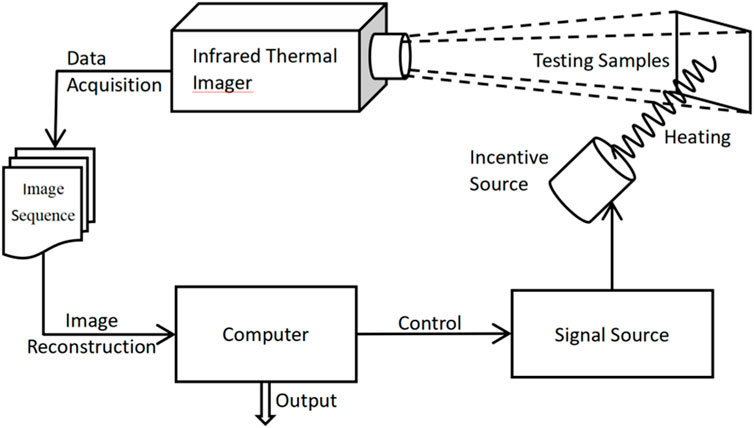
FIGURE 3. Schematic diagram of the infrared thermography NDT system using flash excitation. The system includes a data acquisition system, a signal source group, an infrared thermal imager group, an infrared image processing and a reconstruction system.
2.3 Optimization of the processing algorithm for infrared image sequences
In the infrared image sequence, each pixel has a corresponding temperature state. The infrared image composed of pixel points contains rich temperature change information. Different excitation methods have different effects on the temperature change distribution field of materials [28, 29]. Therefore, it is important to determine the infrared image sequence processing algorithm for different types of optical excitation (pulse, short time, long time, continuous illumination, etc.) to obtain the infrared reconstruction images of composite material defects and typical temperature changes [30]. In this paper, the characterization of defect features was obtained by using the temperature change characteristics of the transient thermal response curve in the sequence of multi-frame infrared images. The infrared thermal imager was used to collect temperature change information of the test sample under optical excitation, and the collected data were converted into three-dimensional array infrared image sequences using MATLAB. A secondary reconstruction infrared feature sequence image of aircraft composite materials with prominent temperature information was obtained through the reconstruction image algorithm. Temperature data segmentation, variable search, probability density function modeling, and data classification of infrared image sequences were then carried out. The inverse heat conduction theory and simulated annealing algorithm [31] were then applied to realize the quantitative inversion calculation of the coating thickness. The fuzzy mean clustering C-operator edge detection algorithm was proposed to extract defect edges in the infrared images [32].
Finally, the combination of principal component analysis and neural network theory [33]was used to more accurately identify the defect types and locate the positions of the defects in aircraft composite structures. YOLOv5 (You Only Look Once) by Ultralytics was used to train and test the collected experimental data and obtain the threshold prediction system, the advantages of which include fast image reasoning speed (up to 0.007 s) and small file sizes (YOLOv5s is only 27 MB) [34].
3 Finite element simulation and experiment
The composite material reached a steady state under the heating by the external source, and gradually cooled after the external heat source was removed. The steady-state thermal was used to simulate the heating process, the temperature distribution results of which were the initial setting for the transient thermal to simulate the cooling process. All temperature distribution changes with time were recorded.
3.1 Analysis process of the finite elements
This experiment used the Ansys Workbench finite element software to simulate the heating and cooling process of the composite material on the computer. The Ansys Mechanical solver was used to calculate the temperature distribution of the sample to draw images of surface temperature changes over time.
The finite element analysis is mainly divided into three steps: pretreatment, solution, and post-processing. Pretreatment included model establishment, material definition and assignment, and mesh division. Model establishment represents the establishment of a three-dimensional model corresponding to the material. A bottom shape was first drawn, and the model was established by stretching the vertical axis. The three-dimensional model established in the experiment is shown in Figure 4. The material properties were then selected from the library at the corresponding material location. If there are no required material properties, materials with custom properties were entered. Finally, different mesh division methods were used to meet different accuracy requirements. The denser the mesh division, the higher the accuracy and computational complexity. The solution was divided into load conditions, boundary conditions, and solution settings.
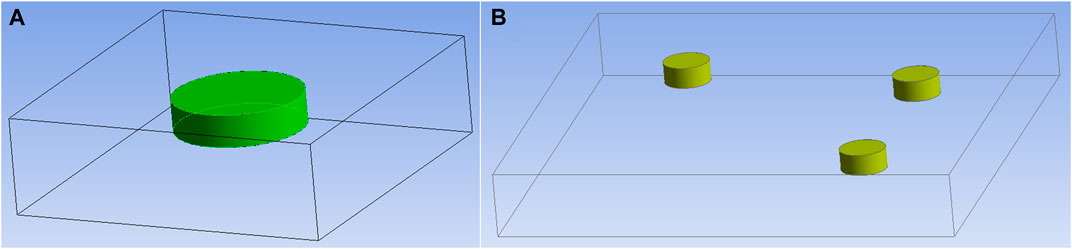
FIGURE 4. Three-dimensional model of test material with a single defect and multiple defects. (A) The three-dimensional model measures 100 mm × 100 mm × 30 mm. A cylindrical defect with a height of 10 mm and radii of 4 mm, 6 mm, 8 mm, 12 mm, 16 mm, and 20 mm is dug at its center. The distance from the defect to the surface is 5 mm. (B) The three-dimensional model measures 200 mm × 200 mm × 30 mm. Three identical cylindrical defects with heights of 9 mm and radii of 5 mm are dug at the center of each part. The distances from the defects to the surface are 3 mm, 6 mm, and 9 mm, respectively.
3.2 Experiment of finite element simulation
In the pretreatment process, a three-dimensional model of the material was first established using DesignModeler. First, a square with side lengths of 100 mm on the xy plane was created. Next, the model was extruded at a 30 mm depth by adding material. Then, a cycle was created on the plane parallel to the xy plane. A cylindrical shape was extruded into a cuboid shape by adding frozen material. Finally, another three-dimensional model was established as follows. The defects were set to different depths to verify the feasibility of the heat conduction model in Section 2.1, which was composed of the aforementioned four models. Three parts were defective and one part was not defective as a control group.
Next, the thermal conductivity of the carbon fiber material was imported into the material library. The carbon fiber material was then assigned to the non-defective part of the model. The water material was assigned to the defective part. In the mesh division, the correlation coefficient of all models was set to 5. For example, after the automatic division of the model with 20 mm defects, the statistics showed 14,734 cells and 33,490 nodes in total.
In the steady-state heat solution setting, a heat source of 260 W/m2 was added to the surface close to the defect. The heating time was set to 120 s, and the air convection coefficient of the material surface was set to 20 W/(m2•K). The ambient temperature was set to 295.15 K. The temperature to the solution result was added. In the transient thermal solution setting, the cooling time was set to 120 s with a total of 240 steps. The time integration was closed. The air convection coefficient on the material surface was set to 20 W/(m2•K). The ambient temperature was set to 295.15 K as well. The temperature to the solution result was added.
The solution results are shown in the Figures 5–9.
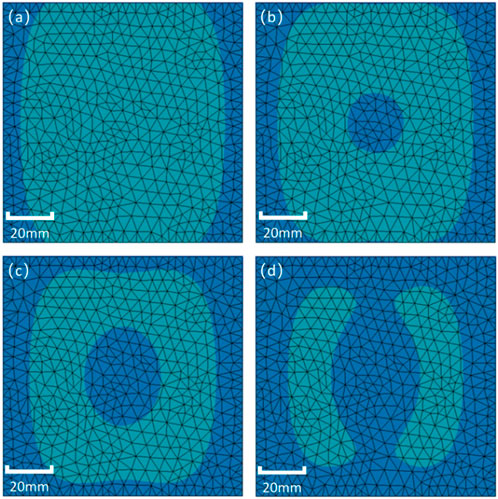
FIGURE 5. Temperature change trends of a defect with a 20 mm radius. (A–D) Screenshots of the temperature trends at 72 s, 75 s, 78 s, and 81 s, respectively.
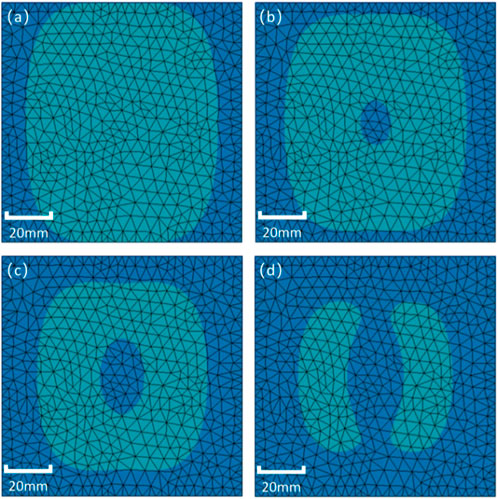
FIGURE 6. Temperature change trends of a defect with a 12 mm radius. (A–D) Screenshots of the temperature trends at 72 s, 75 s, 78 s, and 81 s, respectively.
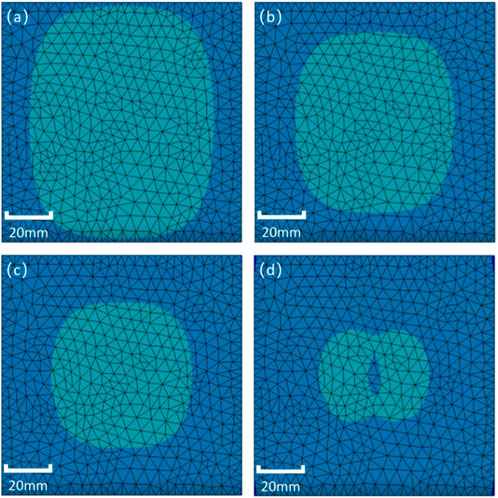
FIGURE 7. Temperature change trends of a defect with a 4 mm radius. (A–D) Screenshots of the temperature trends at 72 s, 75 s, 78 s, and 81 s, respectively.
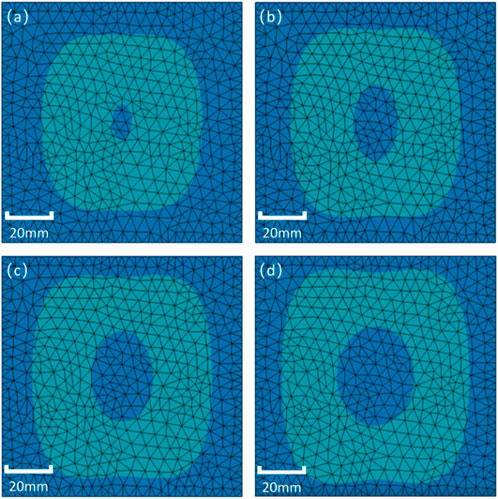
FIGURE 8. Comparison chart of defects with different sizes. (A–D) Defects with 8, 12, 16, and 20 mm radii in the composite material, respectively.
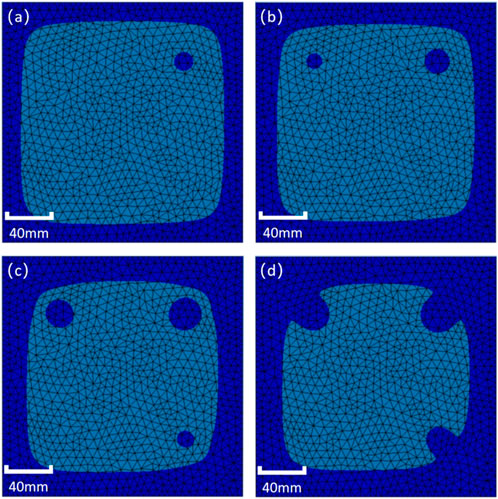
FIGURE 9. Temperature change trends of multiple defects with 5 mm radii. (A–D) Screenshot of the temperature trends at 122 s, 131 s, 140 s, and 149 s, respectively.
The temperature change trend of the defect area is lower than the surrounding area over time. The surface temperature field of the defect gradually shrinks as the defect radius decreases. Therefore, temperature distribution diagrams of different defect sizes at the same time were produced as follows.
The surface temperature change trend of the model showed that the influence of defects on the heat flow inside the material is related to the depth of the defect. The maximum contrast temperature appears later as the defect depth increases.
In conclusion, experiments such as those performed in this study can detect defects of different sizes and depths in composite materials. By comparing the surface temperature fields produced by defects of different sizes simultaneously under the same additional conditions, direct observation shows that the surface temperature field distribution is affected by the defect size. The time point at which the maximum contrast temperature appears is influenced by the defect depth. As the size of the defect decreases, under the mesh division accuracy with a correlation coefficient of 5, the minimum accuracy of detectable defects is 4 mm radius.
4 Detection and identification of composite material defects
A composite material infrared imaging detection system was built with an optical excitation, which was based on the TiX640 Infrared Camera infrared instrument produced by Fluke (United States). The key features are as follows: (1) infrared camera resolution: 640 × 480, (2) temperature measurement range: −40°C to +1200°C, and (3) maximum zoom 32x, which ensures high-definition shooting at long safe distances. The excitation source in the system is a G9 halogen lamp controlled by the Rigol DG1022U signal source.
The test piece was a multi-layer composite material from the wing of plane DA42NG. The material showed no visual defects. Water point and crack defects were identified in different layers below the material surface. Since the experiment is in the initial stage and the experimental database is being established, more defects of various types will be detected under different conditions in the future, among which millimeter defects are the focus of research. Experimental equipment and materials are shown in Figure 10.
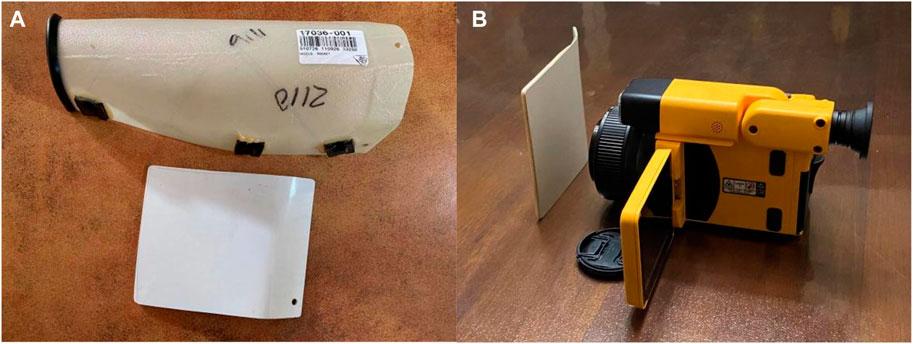
FIGURE 10. Pictures of the composite materials and experimental equipment. (A) Composite materials. (B) Infrared imager collecting composite material data.
This test used the single-side method at an ambient temperature of 18°C. First, the incentive source was used to heat the test piece for 200 s, and then the infrared thermal imager was used to collect the thermal image sequence for 200 s after heating. The test results of millimeter-scale defects in the composite materials at different temperatures were obtained, which were processed by the optimization algorithm. Photographs of internal defects cannot be taken without destroying the test piece. A comparison of the photos of the test piece with the infrared images showed that the infrared non-destructive testing technology has the advantage of quickly and accurately detecting the internal defects of the aircraft skin. By calculating the time t when the maximum contrast temperature image appears, the depth of the defects can be calculated by the formula derived in Section 2.1, to locate the internal defects of aircraft skin. Some experimental data are shown in Figure 11. In the future, the test piece will be used for more experiments under different conditions. According to the defects infrared thermal images, we can easily identify defect location and size, which helps detect internal defects of the aircraft skin.

FIGURE 11. Detection diagrams of water point and crack defects. (A–D) Infrared images of millimeter-scale point defects in the composite material at temperatures of 20°C, 25°C, 32°C, and 36°C, respectively. (E–H) Infrared images of millimeter-scale crack defects in the composite material at temperatures of 20°C, 25°C, 32°C, and 36°C, respectively.
Due to individual differences in the collected infrared image samples, which might affect the experimental results, the jpg images were randomly classified into training (n = 270) and test (n=30) data sets. This allowed the neural network to have better stability, and the experimental results had good universality. The data set included two categories, namely, water and crack, where water represented water point defects and crack represented crack defects. The images were labeled with LabelImg and saved in txt format, with consistent naming between the file and image names. The specific experimental configuration was as follows: the CPU was an 11th Gen Inter(R) CoreTM i7-11700 @ 2.50 GHz. GPU is NVIDIA T600. The program environment was Windows 10 Professional 21H2, and the program was written in the Python language.
The training set and test set were entered into YOLOv5s for network model training using the default parameter settings to obtain the training model. The infrared images were then imported into the model. The test results are shown in Figure 12.
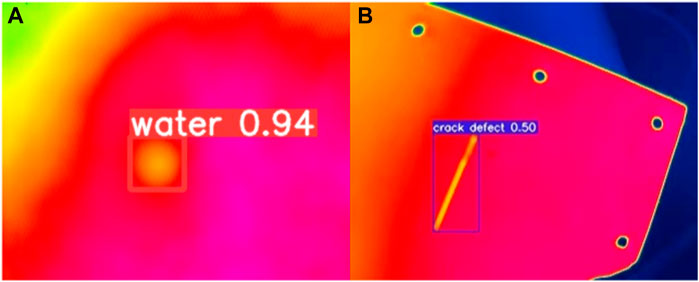
FIGURE 12. Identification results of YOLOv5. (A) Identification result of a water point defect. (B) Identification result of a crack defect.
The number in the upper right corner of the target box in the figure represents the confidence level of detection. The confidence level for water point defect is 0.94, which means that the results correspond well. The confidence level for crack defect is 0.50, which means that the results correspond poorly.
Because the training data sets were all infrared images of the same defect and the sample size was small, the model may show over-fitting such that only a single pattern can be identified and the generalization ability is poor. The model may not be able to identify the same type of defects with certain differences. Generally, the solution to this problem is to increase the capacity of the data set. Therefore, increasing the training set after collecting more infrared images with different defects can address this limitation.
At present, this system can detect and identify water points and crack defects. The subsequent algorithms are also being further optimized.
5 Summary
To solve the problem of accurately detecting defects in aircraft composite materials, this study proposes a non-destructive testing method based on infrared imaging detection technology. First, the heat flow transfer mechanism of aircraft composite materials was established. Based on the time when the maximum contrast temperature appears in the image, we can calculate the defect depth as d = (αt/2)1/2. Then, the feasibility of thermal excitation infrared detection of defects was verified through finite element simulation experiments. Based on these results, an active excitation method was introduced to build a non-destructive system for aircraft composite testing using infrared imaging. Combined with simulation technology such as infrared image acquisition, conversion, and feature sequence extraction and training the data with the neural network were used to develop a network model to automatically identify defects. The result showed confidence levels of >0.9 for water point defects and approximately 0.5 for crack defects. Hence, this infrared detection system achieved the rapid, accurate, non-contact, and non-destructive positioning of millimeter-level defects in aircraft composite materials, which improves the efficiency of aircraft composite material maintenance and ensures aircraft safety. With database improvement, the identification accuracy of different defect types by the system will also improve to provide accurate data support for the defect detection and maintenance of composite materials.
Data availability statement
The original contributions presented in the study are included in the article/Supplementary material. Further inquiries can be directed to the corresponding authors.
Author contributions
H-LC, H-TR, and GW conducted and designed the work. H-LC, H-TR, and X-YZ conducted the experimental measurements. H-LC and MY performed the investigation and data analysis. MY and X-YZ edited the manuscript. GW and X-YZ provided suggestions and assistance. All authors contributed to the article and approved the submitted version.
Acknowledgments
The authors thank the open research project of the Sichuan Province Engineering Technology Research Center of General Aircraft Maintenance (No. GAMRC2021ZD01).
Conflict of interest
Author GW was employed by The 10th Research Institute of China Electronics Technology Group Corporation.
The remaining authors declare that the research was conducted in the absence of any commercial or financial relationships that could be construed as a potential conflict of interest.
Publisher’s note
All claims expressed in this article are solely those of the authors and do not necessarily represent those of their affiliated organizations, or those of the publisher, the editors, and the reviewers. Any product that may be evaluated in this article, or claim that may be made by its manufacturer, is not guaranteed or endorsed by the publisher.
References
1. Zhang X-S, Chen Y-J, Hu J-L. Recent advances in the development of aerospace materials. Prog Aerospace Sci (2018) 97:22–34. doi:10.1016/j.paerosci.2018.01.001
2. Dhas JER, Arun M. A review on development of hybrid composites for aerospace applications. Mater Today-Proceedings (2022) 64:267–73. doi:10.1016/j.matpr.2022.04.511
3. Liu Y, Zhang R, Liang E-Q, Li D, Chen Y, Zhang J. A review on development and properties of GLARE, an advanced aircraft. Mater Appl Mech Mater (2014) 618:140–5. doi:10.4028/www.scientific.net/AMM.618.140
4. Zhu L, Li N, Childs PRN. Light-weighting in aerospace component and system design. Propulsion Power Res (2018) 7:103–19. doi:10.1016/j.jppr.2018.04.001
5. Bhat A, Budholiya S, Raj SA, Sultan MTH, Hui D, Shah AUM, et al. Review on nanocomposites based on aerospace applications. Nanotechnology Rev (2021) 10:237–53. doi:10.1515/ntrev-2021-0018
6. Khosravani MR Composite materials manufacturing processes. Appl Mech Mater. (2012) 110-116:1361–7. doi:10.4028/www.scientific.net/AMM.110-116.1361
7. Feraboli P, Cleveland T, Ciccu M, Stickler P, DeOto L. Defect and damage analysis of advanced discontinuous carbon/epoxy composite materials. Composites A: Appl Sci Manufacturing (2010) 41:888–901. doi:10.1016/j.compositesa.2010.03.002
8. Talreja R. Studies on the failure analysis of composite materials with manufacturing defects. Mech Compos Mater (2013) 49:35–44. doi:10.1007/s11029-013-9318-6
9. Olejnik A, Rogolski R, Szczesniak M. Contact and non-contact methods of vibration measurement in aircraft structures. IEEE Metrology for AeroSpace (2021) 619–24. doi:10.1109/METROAEROSPACE51421.2021.9511682
10. Zhou Y, Cai J. Infrared thermal wave nondestructive testing technology and its application. ACSR-Advances Comptuer Sci Res (2016) 56:480–6. doi:10.2991/iccia-16.2016.77
11. Qu Z, Jiang P, Zhang W-X. Development and application of infrared thermography non-destructive testing techniques. Sensors (2020) 20:3851. doi:10.3390/s20143851
12. Khodayar F, Sojasi S, Maldague X. Infrared thermography and NDT: 2050 horizon. Quantitative Infrared Thermography J (2016) 13:210–31. doi:10.1080/17686733.2016.1200265
13. Lafiosca P, Fan IS. Review of non-contact methods for automated aircraft inspections. Insight (2020) 62:692–701. doi:10.1784/insi.2020.62.12.692
14. Garnier C, Pastor ML, Eyma F, Lorrain B. The detection of aeronautical defects in situ on composite structures using Non Destructive Testing. Compos Structures (2011) 93:1328–36. doi:10.1016/j.compstruct.2010.10.017
15. Wen M-X, Wei L-Q, Zhuang X-Q, He D-G, Wang S-W, Wang Y-M. High-sensitivity short-wave infrared technology for thermal imaging. Infrared Phys Technol (2018) 95:93–9. doi:10.1016/j.infrared.2018.10.020
16. Fan X-Y, Gu F, Guo F. Development of thermal infrared imaging system. Proc SPIE (2013) 8912:891208. doi:10.1117/12.2031841
17. Aldave IJ, Bosom PV, Gonzalez LV, de Santiago IL, Vollheim B, Krausz L, et al. Review of thermal imaging systems in composite defect detection. Infrared Phys Technol (2013) 61:167–75. doi:10.1016/j.infrared.2013.07.009
18. Li Y, Yang Z-W, Zhu J-T, Ming A-B, Zhang W, Zhang J-Y. Investigation on the damage evolution in the impacted composite material based on active infrared thermography. NDT E Int (2016) 83:114–22. doi:10.1016/j.ndteint.2016.06.008
19. Ciampa F, Mahmoodi P, Pinto F, Meo M. Recent advances in active infrared thermography for non-destructive testing of aerospace components. Sensors (2018) 18:609. doi:10.3390/s18020609
20. Usamentiaga R, Venegas P, Guerediaga J, Vega L, Molleda J, Bulnes FG. Infrared thermography for temperature measurement and non-destructive testing. Sensors (2014) 14:12305–48. doi:10.3390/s140712305
21. Venegas P, Peran J, Usamentiaga R, De Ocariz IS. NDT inspection of aeronautical components by projected thermal diffusivity analysis. Quantitative Infrared Thermography J (2019) 18:34–49. doi:10.1080/17686733.2019.1665298
22. Avdelidis NP, Exarchos D, Vazquez P, Ibarra-Castanedo C, Sfarra S, Maldague XPV, et al. Fracture behavior of reinforced aluminum alloy matrix composites using thermal imaging tools. Proc SPIE (2016) 9861:98610K. doi:10.1117/12.2225511
23. Knight B, Howard DR, Ringermacher HI, Hudson LD. Infrared imaging of carbon and ceramic composites: Data reproducibility. AIP Conf Proc (2010) 1211:466. doi:10.1063/1.3362430
24. Banerjee D, Chattopadhyay SK, Chatterjee K, Tuli S, Jain N, Goyal I, et al. Non-destructive testing of jute-polypropylene composite using frequency-modulated thermal wave imaging. J Thermoplastic Composites Mater (2015) 28:548–57. doi:10.1177/0892705713486134
25. Huo Y, Li H-J, Zhao Y-J, Zhang C-L. Study on detecting CFRP composites using pulsed infrared thermography. Proc SPIE (2011) 8193:81934E. doi:10.1117/12.901220
26. Doshvarpassand S, Wu C-Z, Wang X-Y. An overview of corrosion defect characterization using active infrared thermography. Infrared Phys Technol (2019) 96:366–89. doi:10.1016/j.infrared.2018.12.006
27. Chung Y, Lee S, Kim W. Latest advances in common signal processing of pulsed thermography for enhanced detectability: A review. Appl Sciences-Basel (2021) 11:12168. doi:10.3390/app112412168
28. Fedala Y, Streza M, Roger JP, Tessier G, Boue C. Open crack depth sizing by laser stimulated infrared lock-in thermography. J Phys D: Appl Phys (2014) 47:465501. doi:10.1088/0022-3727/47/46/465501
29. Mulaveesala R, Ghali VS, Arora V, Siddiqui JA, Muniyappa A, Takei M. Recent advances in thermal wave detection and ranging for non-destructive testing and evaluation of materials. Proc SPIE (2013) 8705:870510. doi:10.1117/12.2018465
30. Rani A, Arora V, Mulaveesala R. InfraRed image correlation for non-destructive testing and evaluation. Proc SPIE (2021) 11743:1174310. doi:10.1117/12.2593389
31. Huang Y Inversion of infrared nondestructive testing with evolution algorithm. Adv Mater Res (2012) 479-481:1614–7. doi:10.4028/www.scientific.net/AMR.479-481.1614
32. Shanthi I, Valarmathi ML. SAR image despeckling using possibilistic fuzzy C-means clustering and edge detection in bandelet domain. Neural Comput Appl (2013) 23:S279–91. doi:10.1007/s00521-013-1394-y
33. Yousefi B, Kalhor D, Usamentiaga R, Lei L, Castanedo CI, Maldague XPV. Application of deep learning in infrared non-destructive testing. Quantitative Infrared Thermography (2018) 97–105. doi:10.21611/qirt.2018.p27
Keywords: composite materials, simulation, non-destructive testing, infrared imaging, defect positioning
Citation: Chang H-L, Ren H-T, Wang G, Yang M and Zhu X-Y (2023) Infrared defect recognition technology for composite materials. Front. Phys. 11:1203762. doi: 10.3389/fphy.2023.1203762
Received: 11 April 2023; Accepted: 08 June 2023;
Published: 10 July 2023.
Edited by:
Mohammad Yazdi, Macquarie University, AustraliaReviewed by:
He Li, University of Lisbon, PortugalJianxin Hao, Civil Aviation University of China, China
Copyright © 2023 Chang, Ren, Wang, Yang and Zhu. This is an open-access article distributed under the terms of the Creative Commons Attribution License (CC BY). The use, distribution or reproduction in other forums is permitted, provided the original author(s) and the copyright owner(s) are credited and that the original publication in this journal is cited, in accordance with accepted academic practice. No use, distribution or reproduction is permitted which does not comply with these terms.
*Correspondence: Gang Wang, c2FuYnVkZXl1MTIxQDE2My5jb20=; Xin-Yu Zhu, eHl6aHVAY2FmdWMuZWR1LmNu