 H. Yang1*
 M. M. Chen
94% of researchers rate our articles as excellent or good
Learn more about the work of our research integrity team to safeguard the quality of each article we publish.
Find out more
ORIGINAL RESEARCH article
Front. Phys., 05 December 2023
Sec. Low-Temperature Plasma Physics
Volume 11 - 2023 | https://doi.org/10.3389/fphy.2023.1189371
This article is part of the Research TopicLow-Temperature Plasma Chemistry Optimizations and ApplicationsView all articles
The homogeneous discharge mode in dielectric barrier discharge (DBD) has sparked wide interest in recent years. Assessing the dielectric barrier discharge homogeneity value (DHV) offers value in the industry. The current method of assessing DHV involves distinguishing between the filamentous and homogeneous modes of discharge but struggles to qualitatively analyze it. This study proposes a method for evaluating DHV that involves using the dispersion normalization and the local temperature difference methods. The values of such parameters as the voltage, frequency, air gap, and gas flow were tested to verify the validity and generality of the proposed method. The results of experiments revealed that the dispersion normalization method uses information on the luminosity of the discharge image to assess the homogeneity of DBD under different conditions. The temperature difference in the area of discharge was also calculated to assess the homogeneity of DBD, and the results showed that it is useful to this end. Moreover, the dispersion coefficient and the difference in local temperature were found to be inversely proportional to DHV. The proposed method can thus be used to identify variations in DHV under different conditions, and provides a basis for its characterization.
DBD is a classical source of nonthermal plasma at atmospheric pressure [1–4]. DBD in general involves filamentary discharges under normal pressure, but the discharge space suffers from the uneven distribution of energy density that limits its application to the industry. Compared with the filamentary discharge, homogeneous dielectric barrier discharge (HDBD) has the advantages of homogeneity and stability. The relative HDBD discussed in this paper refers to a relatively homogenous discharge over long time scales consisting of a large number of microfilaments. Even if the discharge consists of a large number of filamentary discharges, the homogenous treatment of the material surface is possible only if the discharge can be homogenously distributed during contact with the treated surface. HDBD has prospects for use in several industrial applications, such as the modification of the material surface, environmental engineering, and sterilization and disinfection [5–14]. Further research into the phenomenon is thus important.
Current research on the application of HDBD has mainly focused on the structures of the electrodes, flow rates of the carrier gas, and electrical parameters [15–22]. In such medical applications as water decontamination and organic degradation, HDBD is greatly influenced by the rate of gas flow and the air gap [23]. Researchers have attempted to change the structures of the electrode (ball–plate electrode) and used different metallic conductor (stainless steel or aluminum) to achieve HDBD [24]. Most researchers have used nanosecond pulses rather than the typical AC to excite DBD to obtained HDBD at a large volume [25, 26]. The transition from filamentary discharge to homogeneous discharge can be achieved by changing the underlying conditions, but DHV cannot thus be determined. Some researchers have proposed laws of HDBD over a short duration of exposure by using high-speed ICCD cameras to diagnose the homogeneity of DBD, and have analyzed the microscopic evolution of the relevant information [27]. High-speed ICCD cameras have been mainly used to examine the DBD mechanism but this cannot be used to accurately analyze DHV. With developments in digital image processing technology, some researchers have taken advantage of images captured by cameras to analyze the spatial structure of DBD and used this information to characterize HDBD [28–30]. Although the information captured by the camera is used to determine HDBD, it cannot be used to determine the internal electron energy and its vibrational distribution. This renders it necessary to analyze the plasma temperature by using spectral diagnostics technology. Some researchers have calculated the pattern of DBD through spectral diagnosis through emission spectroscopy to distinguish filamentary discharges from homogeneous discharges, and have examined the process of conversion of Townsend discharge into glow discharge [31–33]. However, no report to date has quantitatively analyzed HDBD by using spectral diagnostic techniques.
The diagnostic methods mentioned above are effective but complicated or expensive. Some of them are based on temporal characteristics, such as wavelengths and Lissajous figures. Others focus on spatial characteristics, such as photography, but an overall method of analysis remains elusive. This study proposes a simple diagnostic method to quantitatively analyze DHV. The proposed method can be used to analyze information on the spatial luminosity of the discharge image and the difference in the temperatures of plasma in different areas of discharge. This can be used to quantitatively assess DHV.
The authors designed a DBD device with an adjustable gap to study methods for characterizing DHV. The experimental platform is shown in Figure 1A. The range of the voltage for nanosecond-pulse power supply was 0–20 kV, the range of frequency was 0–20 kHz, the pulse width was adjustable from 0 to 500 ns, and all pulse widths were fixed at 200 ns in the experiment, and the rising edge and falling edge are both 50ns. The voltage and current waveform diagram of the nanosecond pulse power supply under load is shown in Figure 1B below. The adjustable gap DBD experimental device is placed in a glass box, and black cloth is always used to block light, and ensure that the shading is maintained at 90%. The DBD structure contained duralumin electrodes, each with a diameter of 50 mm. The insulating medium consisted of a quartz glass sheet (Si2O3), with dimensions of 110 mm × 110 mm×3 mm. The air gaps were set to 1, 2, and 3 mm.
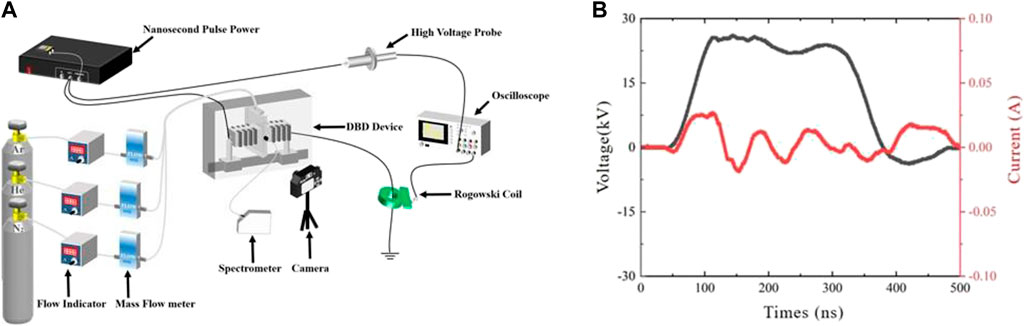
FIGURE 1. Experimental platform for DBD, the schematic diagram of the experimental platform (A), voltage and current waveforms of nanosecond pulse power supply under load (B).
The electrical monitoring system included an oscilloscope, a high-voltage probe, and a current probe. The range of measurement of wavelength of the fiber optic spectrometer was 200–850 nm and the range of its accuracy was ±0.1 nm (full band). Images of the discharge were captured by a camera. The aperture was set to F = 5.6 to avoid pixel saturation in the discharge images, and the sensitivity was set to ISO = 3200 after repeated experiments. The spatial resolution is 40 × 500 pixels. Selecting the pixel of discharge space of 40 × 500 means that the pixel size of the captured plasma image is 40 × 500, and the actual discharge space size is selected as the discharge gap×50 mm; The rest of the parameters were all set to their default values. The experiment was carried out in Ar, N2, and He, and gas flow was controlled by a mass flowmeter. A homogeneous airflow controller was designed to enable air to flow evenly into the discharge gap. The gas pipeline in this paper is connected with a uniform air flow device, which is attached to the discharge gap.The range of control of the mass flow controller was 0–10 L/min and its accuracy was 0.1 L/min. The emission spectra of discharge area is collected by a spectrometer. The time resolution of the measured value is 50 ms, this paper aims to analyze the evaluation method of relatively uniform discharge on a long time scale. Spectral acquisition system is selected by the United States Bwtek (Bwtek) company’s optical fiber spectrometer, the minimum integration time is 1 ms, the data transmission rate is 900 spectrum/second, the measured wavelength range is 200–850 nm, wavelength accuracy is±0.1 nm (full band).
Because the visible light image is the statistical result of multiple discharges under a certain exposure time, the spatiotemporal structure of the discharge image can reflect the state of the discharge [34]. Therefore, we used the dispersion normalization method to present the visible light image in the form of data. This method is used to calculate the degree of deviation between the grayscale value of a given pixel and the average grayscale value of pixels of the DBD image. It uses the statistical results of the dispersion coefficient to characterize the homogeneity of the discharge image. The specific steps are given below in Figure 2. The black bar in Figure 2 represents the discharge gap, which refers to the hollow part between the two electrodes. The high voltage electrode uses a duralumin electrode with a diameter of 50mm, with a smooth chamfer (chamfer 2 mm), which has excellent electrical conductivity and low weight to avoid scratches during the experiment.
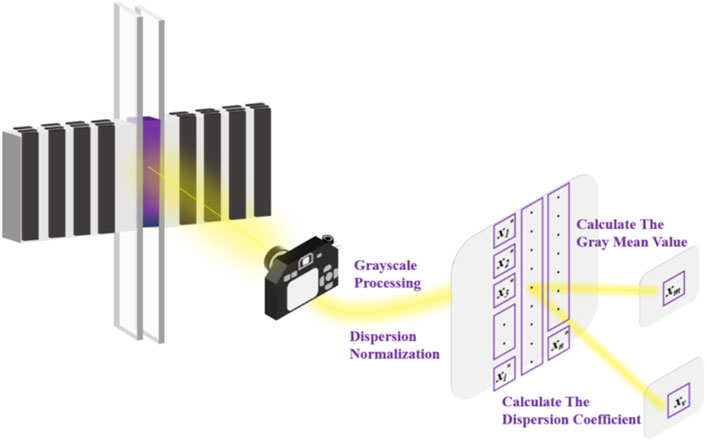
FIGURE 2. Schematic diagram of dispersion normalization method.
First, pixels in a discharge space of 40 × 500 were selected, and grayscale processing was performed on the discharge image L(x,t) within the exposure time Δt. The value of the grayscale pixel is xn, and is calculated as follows:
Second, the pixel value xn is divergently normalized to improve accuracy, and xn* can be obtained by the following formula:
The average value of the pixel xn* after grayscale processing is then used to characterize the intensity of discharge. The grayscale average value (xm) is obtained by:
Finally, xn* is normalized to obtain the dispersion coefficient (xv), which is used to characterize DHV. xv is inversely proportional to DHV, the smaller xv is, the greater the discharge uniformity is. xv is obtained by:
When the discharged particle undergoes a transition in energy levels, an emission spectrum is formed. Furthermore, the excitation temperature of the electron (Ta) and the molecular vibration temperature (Tvib) can be calculated from the spectral data. However, the discharge causes collisions and excitations of electrons that result in molecular vibrations and energy loss, respectively. Moreover, Ta and Tvib are examined to analyze not only the energy distribution of electrons during vibration, but also to study changes in electron energy. We used the local temperature difference method to calculate the plasma temperature in different areas of discharge. This method reflects internal changes in electron energy and the distribution of the vibrational dynamics of the electrons for the quantitative evaluation of DHV. In this method, the discharge area is divided into five parts, and the height of the optical fiber probe is adjusted by the probe height adjustment device. The emission spectrum of the five discharge areas is measured successively from top to bottom with the time interval of 5s. The collected spectral information is used to calculate the electron excitation temperature (Ta) and molecular vibration temperature (Tvib) in different discharge regions, and then the plasma temperature is standardized to obtain the regional temperature difference (ΔT), which is used to characterize the discharge uniformity. 1 is upstream of the discharge area, and 5 is downstream of the discharge area. A schematic diagram of the local temperature difference method is shown in Figure 3.
1) Using temperature difference in electron excitation to characterize homogeneity
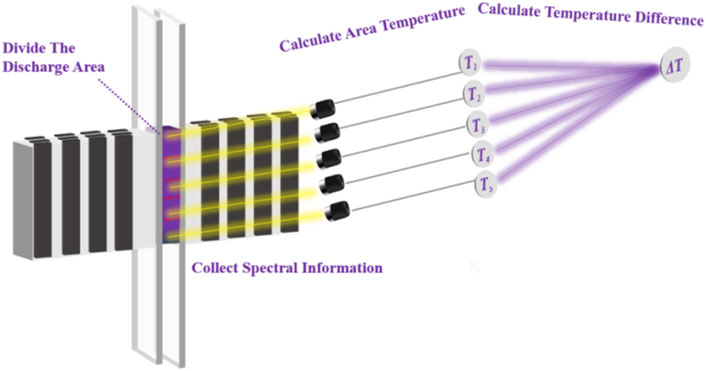
FIGURE 3. Schematic diagram of the local temperature difference method.
The excitation temperature of electrons affects the probability of excitation and the ionization of gas in the system, and is an important part of the parameters of plasma. Ta was calculated by the relative intensity ratio of the Boltzmann slope to examine the difference in excitation temperature of electrons (ΔTa) in different discharge regions.
When the plasma was in thermodynamic equilibrium or local thermodynamic equilibrium, the distribution of atom-bound electron energy levels followed the Boltzmann distribution:
In the above formula, n is the density of the particles, k is the Boltzmann constant, g is the statistical weight of the particle, and E is particle energy.
In the radiation spectrum of plasma, a pair of spectral lines belonging to the same atom and its ions were selected, and the distribution of their intensity can then be expressed as:
In the formula, h is Planck’s constant, f is the frequency of emission of the electrons during spontaneous transition, and A is the probability of transition.
By combining Equations (5) and (6), the ratio of the intensities of the spectral lines can be obtained as:
In the above, λ is the wavelength of the emission spectrum.
In the experiment conducted in the presence of Ar, the emission spectrum was measured in the range of 680 nm–800 nm, and two spectral lines belonging to the same level of ionization of the Ar atom, at 763.5 nm and 772.4 nm, were selected to calculate Ta [35, 36].
2) Using differences in molecular vibrations to characterize homogeneity
The vibration temperature is one of the important parameters of plasma in DBD. The vibration-induced excitation is mainly caused by the loss of electron energy, which makes it closely related to the electron temperature. We used the Boltzmann slope method to measure the vibration temperature in plasma discharge.
In theory, the band intensity formula in the band emission spectrum of diatomic molecules is:
v’, v’’ is the up and down state vibration quantum number, h is Planck’s constant, c is the speed of light, Av’,v’’ is the transition probability, Nv’ is the number of molecules in the upper state.
Under the condition of local heat equilibrium, the upper state molecular number distribution satisfies the Boltzmann distribution, namely:
The vibration energy at a given level is:
Because the vibrational distribution satisfies the Boltzmann distribution, Tvib can be obtained by the following formula:
Ev is the vibrational energy and C is a constant. Eq 10 was linearly fitted to obtain Tvib.
Three groups of sequential bands were used to reduce the fitting error: Δv = -1 (0-1,1-2,2-3), Δv = -2 (0-2,1-3,2-4), and Δv = -3 (0-3,1-4,2-5).
Because electron collision and excitation will cause molecular vibration and electron energy loss respectively when DBD occurs, studying molecular vibration temperature and electron excitation temperature can not only judge the distribution of electron energy on vibration dynamics, but also judge the change of electron energy. The fixed voltage is 20 kV, the frequency is 1 kHz, the air flow is fixed at 1 L/min, the pulse width in the experiment is fixed at 200 ns, and the rising edge and falling edge are both 50 ns. In order to study DBD emission spectra of argon and helium at atmospheric pressure, spectral measurements were carried out in the range of 300–800 nm, of which argon atomic spectra were mainly concentrated in the range of 700–800 nm, the emission spectra of argon, helium and nitrogen were shown in Figure 4. Since there is no argon ion spectral line found in the emission spectra, only 480.6 nm argon ion emission spectral line with relatively low intensity can be obtained. Therefore, in order to obtain the electron temperature, it is impossible to use the argon ion spectral line for calculation, and only the electron excitation temperature can be used to estimate the electron temperature. Because the DBD discharge produces electrons and ions, and the electrons are accelerated to form high-energy electrons, and react with argon atoms. When an electron with an energy greater than 13 eV collided with an argon atom, the argon atom obtained a large amount of energy and transited to an excited state, and the excited state argon atom then transited to a metastable particle Ar*(3P2,3P0). However, the first negative band isoline of N2 (391.4 nm) is not observed in the emission spectrum of argon gas, which shows that the metastable energy level of argon atom is low, resulting in weak Penning ionization. However, the first negative band N2 (391.4 nm) was found in the DBD discharge of atmospheric pressure helium and argon mixed, and it can be seen that Penning ionization also occurred in He. Experiments show that Penning ionization occurs in He, and a homogenous discharge can be obtained. The reaction is a He atomic line with a wavelength of 706.5 nm.
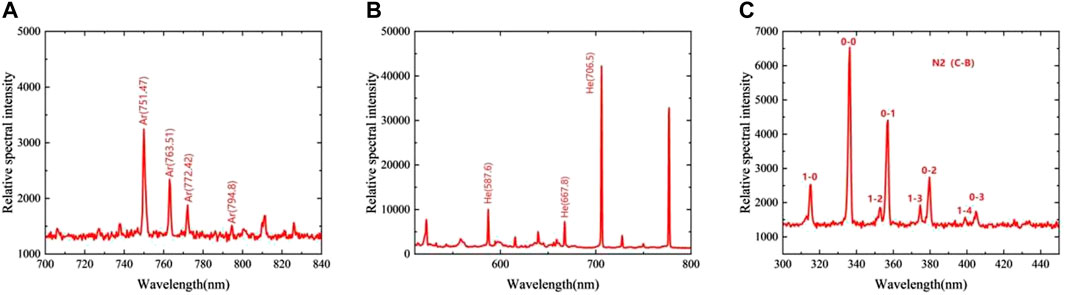
FIGURE 4. Spectrum Diagram in different gas atmospheres: (A) in Ar, (B) in He, (C) in N2.
A stable HDBD can be easily generated owing to the low strength of the average breakdown field in He. We consider a mixture of He and air as an example to verify the generality of the dispersion normalization method by using different parameters.
The specific contents of the experimental method are as follows: first, a camera is used to shoot DBD images, pixels in the image discharge space of 40 × 500 are selected, and the image is processed in gray scale within the exposure time; secondly, the pixel value xn is normalized by divergence to improve the accuracy. Matlab software is used to calculate the gray value of the image, and then the average value of the pixels after gray processing is used to characterize the intensity of discharge. The average gray value is normalized and the dispersion coefficient is obtained, which can be used to characterize the discharge uniformity. For example, when the normalized pixel xn* is equal to 0.07, 0.12, 0.15,
Changes in the electrical parameters have an impact on DHV. We thus examined the feasibility of the dispersion normalization method by considering the effects of voltage and frequency on DHV in a mixture of He and air. The air gap was 2 mm, the volumetric flow rate of gas was 1 L/min, and the exposure time was 0.05 s.
The discharge images in He at different voltages are shown in Figure 5, where the frequency was fixed to 1 kHz. The discharge images show that with the increase in voltage, the brightness of the images changed from dark purple to purple, but no prominent discharge filament was observed. Before analyzing DHV, it was necessary to calculate the intensity of the discharge image.
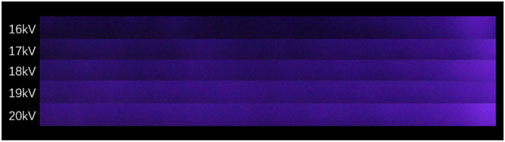
FIGURE 5. Discharge images in He at different voltages (1 kHz, 1 L/min, air gap = 2 mm).
Figure 6 shows that xm in He increased almost linearly with the voltage. The reason for the above phenomenon should be that the charge transfer in the microdischarge channel continues to accelerate. Therefore, the increase in voltage resulted in a higher probability of collision between high-energy electrons and other particles. Furthermore, the increased voltage led to an electron avalanche that increased the intensity of discharge and xm. This suggests that the intensity of discharge was positively correlated with the voltage. Moreover, the intensity of discharge in the discharge image could be characterized by xm.
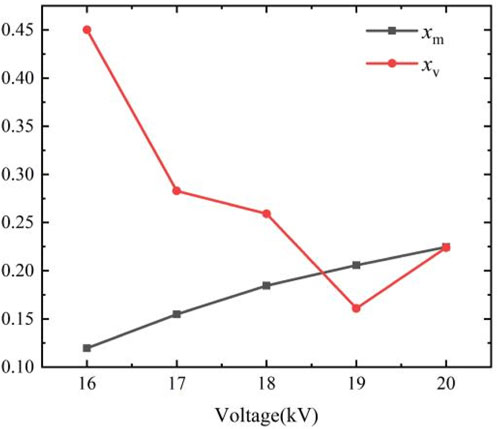
FIGURE 6. The values of xm and xv in He at different voltages (1 kHz, 1 L/min, air gap = 2 mm).
It is impossible to quantitatively analyze DHV by observing the discharge images, and we used the value of xv to this end. Figure 6 shows that xv decreased as the voltage increased. When the voltage had been increased to 19 kV, xv increased instead. This can be mainly attributed to the increase in the voltage. The increased voltage might have led to increases in the accumulated energy in the discharge gap as well as the number of micro-discharge filaments. The increase in voltage also reduced the distance between the excited particles and eventually filled the discharge space, which led to a pseudo-homogeneous discharge phenomenon. As the voltage continued to increase, the discharge space was filled with micro-discharge filaments, which contributed to a slight change in DHV. Overall, this suggests that the variation in voltage influenced DHV. Furthermore, the dispersion normalization method could be used to quantitatively analyze DHV at different voltages.
The discharge images in He at different frequencies are shown in Figure 7 when the voltage was fixed at 20 kV. The brightness of the discharge images changed with the increase in frequency. In addition, the discharge space exhibited bright and dark stripes. This showed that changes in the frequency had a significant effect on the intensity of discharge.
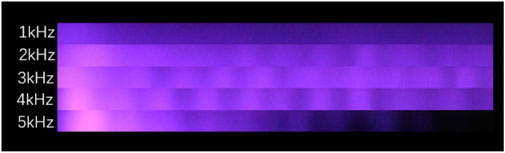
FIGURE 7. Discharge images in He at different frequencies (20 kV, 1 L/min, air gap = 2 mm).
Figure 8 shows that when the frequency was 3 kHz, xm peaked and then began to decrease. It could be attributed to an increase in the number of discharges per unit time, which resulted in more intense collisions between the charged particles. In addition, the change in frequency generated more residual positive ions that were superimposed on the electric field to increase the intensity of discharge. When the discharge frequency was increased to 3 kHz, high-frequency discharges led to the accumulation of more charges on the dielectric layer to form a reverse electric field. This contributed to a decrease in the strength of discharge. The experimental results illustrate that when the discharge frequency was lower than 3 kHz, the increase in frequency increased the intensity of discharge. As the discharge frequency continued to increase, the reverse electric field led to a decrease in the intensity of discharge.
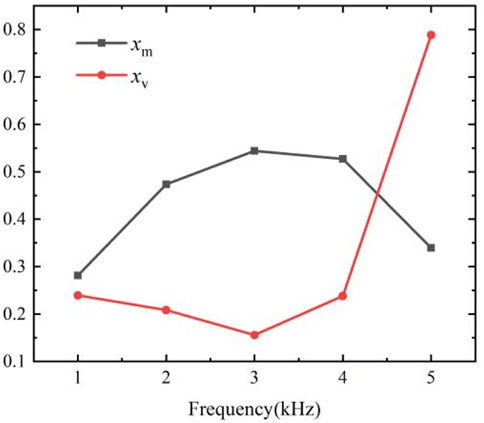
FIGURE 8. The values of xm and xv in He at different frequencies (20 kV, 1 L/min, air gap = 2 mm).
Figure 8 shows that when the frequency was 3 kHz, xv reached its minimum value and then began to increase. The findings indicate that the excited particles became more dispersed with the increase in the number of discharges per unit time. This led to an increase in DHV. When the frequency was increased to 4 kHz, high-voltage and high-frequency discharges caused the discharge area to shrink. Moreover, the increase in frequency not only led to partial discharge as well as light and dark streaks, but also resulted in a decrease in DHV. This result suggests that changes in the discharge frequency had a significant impact on DHV, and that the dispersion normalization method is suitable for quantitatively analyzing DHV at different frequencies.
The variation in the air gap changed the electric field distribution and the initial discharge voltage in the gap. We thus examined the effect of the air gap on DHV to verify the feasibility of the dispersion normalization method.
Figure 9 shows the discharge images in He in case of air gaps of different sizes. The voltage was set to 20 kV and the frequency to 1 kHz. Figure 9 illustrates that the discharge images changed from pink to dark purple with the increase in the air gap. When the air gap was increased to 3 mm, the discharge did not fill the entire gap. Changes in the air gap had a significant impact on the intensity of discharge.
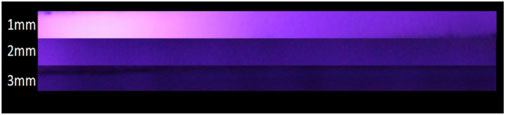
FIGURE 9. Discharge images in He with air gaps of different sizes (20 kV, 1 kHz, 1 L/min).
Figure 10 shows that xm decreased as the air gap increased. When the air gap was increased from 1 mm to 2 mm, xm decreased sharply. This can be attributed to the increase in the air gap, which caused the discharge area to shrink and reduced the rate of electron drift. Furthermore, the increase in the air gap resulted in a decrease in the efficiency of ionization and the intensity of discharge. Overall, the increase in the air gap was not conducive to the occurrence of discharge, and even brought about a significant decrease in the intensity of discharge.

FIGURE 10. The values of xm and xv in He with air gaps of different sizes (20 kV, 1 kHz, 1 L/min).
Figure 10 shows the values of xv in He with air gaps of different sizes. When the air gap was 1 mm, xv was mainly distributed around 0.4. As the air gap was increased, xv decreased to 0.25 because the memory effect was significant under high-frequency pulse discharge. It generated a large number of seed electrons in the discharge gap that overlapped with one another to cause the discharge space to become dispersed. The memory effect decreased in case of a large air gap because the electron avalanche weakened [37–40]. The memory effect refers to the small time interval between adjacent pulses at high frequencies, and when the next pulse arrives, the residual positive ions in space remain in the gap due to their large mass. The discharge no longer filled the gap in this case, and bright and dark streaks appeared. The result indicates that the dispersion normalization method can be used to quantitatively analyze DHV in air gaps of different sizes.
The variation in the flow rate influenced the charge distribution and the intensity of discharge. Its effect on DHV varied in the presence of different gases.
Figure 11 shows the discharge images in He at different flow rates of the gas. The vent was located in the right side of the figure. The figure shows that when the volumetric flow of the carrier gas was less than 2 L/min, discharge occurred upstream and the discharge images were blue-violet. As the flow rate increased, the discharge area gradually moved from upstream to downstream of the flow of gas. When the flow rate was 4 L/min, the discharge images were all pink.
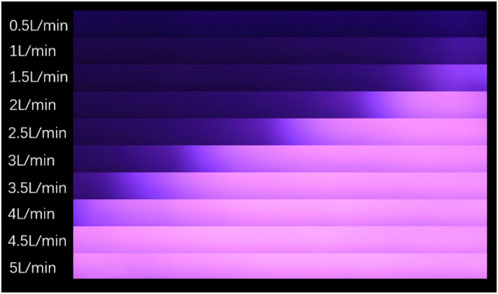
FIGURE 11. Discharge images in He at different flow rates (20 kV, 1 kHz, air gap = 2 mm).
Figure 12 shows that xm was positively correlated with the flow rate of gas. With the increase in the flow rate, the probability of collision between the excited electrons of He and N2 increased. The increase in the flow rate also led to a longer lifespan of He in the next pulse discharge. He atoms provided a large number of seed electrons to increase intensity of discharge. He began to diffuse along the direction of the vent after leaving it. When the volumetric flow of the carrier gas increased, He could travel farther at the same degree of diffusion. Consequently, the concentration of He downstream of flow rose, causing xm to rise. Increasing the flow rate thus led to an increase in the concentration of He in the discharge gap as well as the intensity of discharge. It shows that xv increased to 0.8 at 2 L/min and then decreased to 0.1 at 5 L/min. The variation in xv occurred because high-energy He atoms with a long lifetime could easily generate Penning ionization with the impure gas to form HDBD. As the flow rate increased, the content of impurities in the air gap decreased and the lifetime of the atoms increased [41].
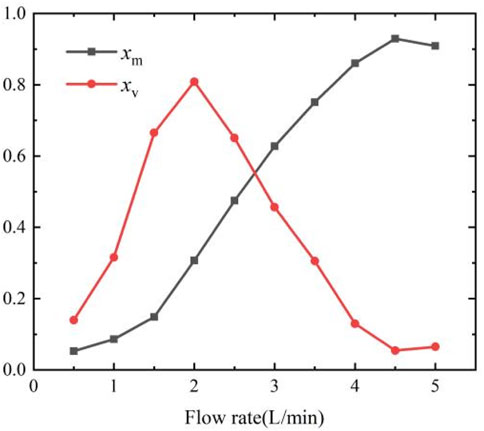
FIGURE 12. The values of xm and xv in He at different flow rates (20 kV, 1 kHz, air gap = 2 mm).
The increase in the flow rate of the gas reduced its pressure in the gap, which led to an increase in the concentration of helium atoms that developed from upstream to downstream. The increase in the flow rate generated more excited He* and increased Penning ionization in the air gap [42]. Overall, the results suggest that DHV at different flow rates can be quantitatively analyzed by the dispersion normalization method.
The dispersion normalization method can be used for the quantitative analysis of DHV by analyzing the spatial luminosity of the discharge images. However, it cannot be used to analyze the internal energy of the electrons and their vibrational distribution. We used the temperature difference method to analyze the plasma temperature in different regions of discharge to more accurately analyze DHV. This can be used to determine the distribution of internal electrons during vibration. We conducted experiments to assess the effects of the amplitude and frequency of the voltage as well as the flow rate of gas on DHV. This was also used to verify the feasibility of the local temperature difference method.
Because variations in voltage and the frequency affect the internal electron energy, we used Ar as an example to study their effects on Ta to verify the local temperature difference method. Figure 13A shows the values of Ta in different regions of discharge. The voltage was set to 17 kV and the frequency to 1 kHz. It shows that Ta was mainly distributed in the range 1500 K–1650 K, and the value of ΔTa was small. The minimum Ta of the second discharge region was 1552 K and the maximum Ta of the fourth discharge region was 1638 K. The electron energy in the discharge area was homogeneous overall.
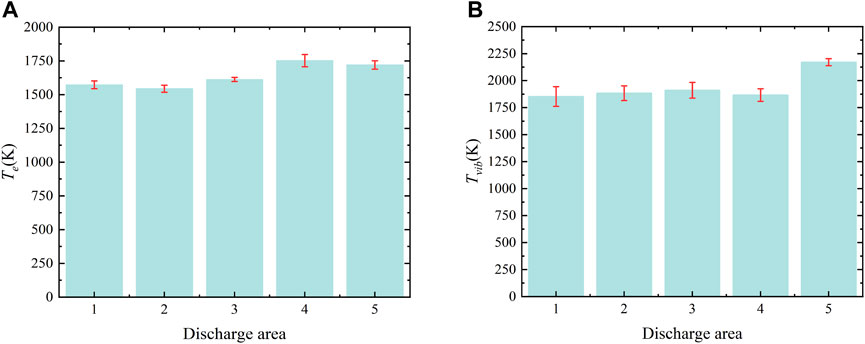
FIGURE 13. Temperature difference between discharge regions in Ar (17 kV, 1 kHz): the values of Ta (A), the values of Tvib (B).
Experiments were carried out in an atmosphere consisting of air mixed with Ar, N2, and He. The emission spectrum of the second positive band system of molecules in N2 (C3Πu→B3Πg) was analyzed, and the difference in the molecular vibrational temperature under different gases was obtained. Figure 13B shows the temperatures of molecular vibrations in different regions of discharge in He. The voltage was 17 kV and the frequency was 1 kHz. The difference in temperature ΔTvib between areas of discharge was small and electrons in the discharge area were evenly distributed.
Figure 14A shows the variations in ΔTa at different voltages. When the discharge frequency was 2 kHz, ΔTe was distributed in the range 100–300 K as the voltage was increased. Ar undergoes Penning ionization and generates seed electrons for ionization [43, 44], which in turn leads to the simultaneous rise of electron energy and Te in the five discharge regions, thus causing the difference in ΔTa. The experimental results show that the variation in voltage influenced the homogeneity of discharge. To accurately analyze DHV, the results of the local temperature difference method were compared with those of the dispersion normalization method and were found to be consistent.
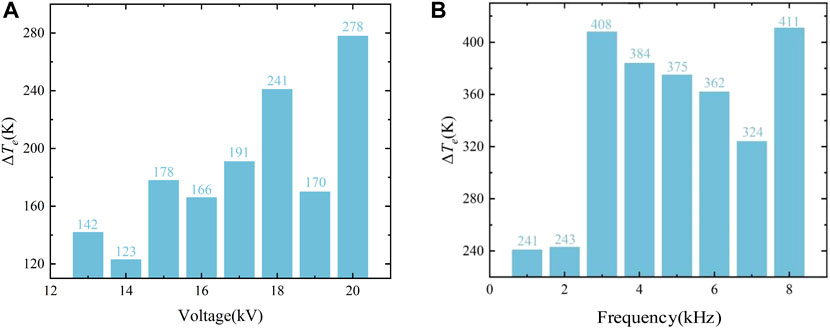
FIGURE 14. The values of ΔTa at different voltages and frequencies: at different voltages (A), at different frequencies (B).
Figure 14B shows the variation in ΔTa at different frequencies at a voltage of 18 kV ΔTa was positively correlated with the frequency of discharge. Moreover, the randomness of each position of discharge resulted in an uneven distribution of electron energy. By comparing the xv and ΔTa in He at different voltages, it is found that the ΔTa obtained by the area temperature difference method decreases with the increase of voltage, and its value decreases from 207 to 38. However, adopting the method of dispersion normalization, xv also decreases as the voltage increases, and its value decreases from 0.45 to 0.17. Hence, it can be seen that the results are consistent. Therefore, ΔTa can be used to quantitatively analyze DHV.
Figure 15A shows the differences in the temperatures of molecular vibrations at different voltages. As the voltage was increased, ΔTvib decreased linearly, where N2 recorded the sharpest drop. Values of ΔTvib in Ar and He were much smaller than in N2. The variation in ΔTvib can be attributed to the increase in the frequency of electron collision with the increase in voltage. In addition, the increase in voltage results in stronger collisional relaxation of molecules at vibrational excitation levels in N2 [45]. The higher electron energies are existed in Ar and He, which excite electrons with high vibrational dynamics easily. The increase in voltage led to a decrease in the molecular vibrational energy in different discharge regions, and the reduction in range remained the same. Therefore, the variation in voltage had a significant effect on ΔTvib in only N2 and He with a low DHV, and had little effect on ΔTvib in Ar with a high DHV. These results are roughly the same as those of the dispersion normalization method under different gases.
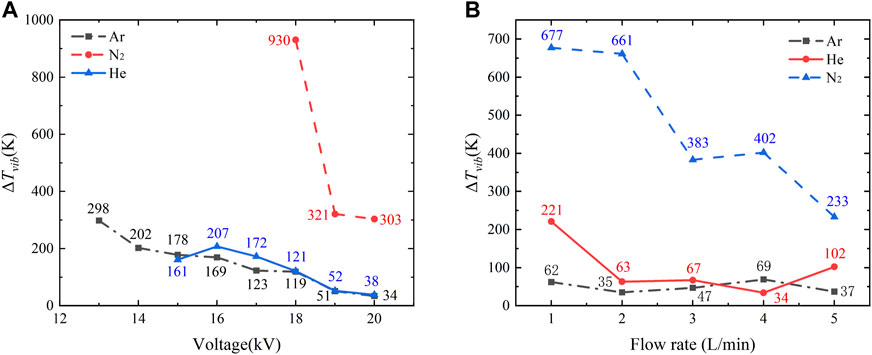
FIGURE 15. Differences in the ΔTvib temperature at different voltages and flow rates: at different voltages (A), at different flow rates (B).
Figure 15B shows that changes in the flow rate had a significant effect on ΔTvib in N2 and He but had little effect on ΔTvib in Ar. The change in ΔTvib was caused by the different intensities of Penning ionization in different gases. Therefore, different gases contributed to the velocity of flow in different gases to varying degrees. These results are consistent with the effects of flow velocity on the dispersion coefficient xv. This shows that changing the velocity of flow did not change the electron energy and the distribution of electron vibrations in Ar. A comparison of the values of xv and ΔT between the methods of characterization shows a certain deviation but their overall trend was the same. Thus, the local temperature difference method can also be used to quantitatively assess the homogeneity of discharge.
This study proposed a method for quantitatively analyzing DHV based on the dispersion normalization and the local temperature difference methods. Its stability and universality in different voltages and frequencies as well as air gaps of different sizes were verified. The following conclusions can be drawn:
(1) We used the dispersion normalization method to analyze the spatial luminosity of the discharge images under different values of voltage, frequency, air gap, velocity of flow, and exposure time as well as in different gases. The dispersion coefficient was used to characterize DHV. The results showed that that the proposed method is suitable for the quantitatively analysis of DHV at different conditions.
(2) Discharge experiments were conducted at different voltages, frequencies, and flow rates to verify the local temperature difference method. The regional differences between the excitation temperature of the electrons and molecular vibrational temperature in different discharge regions were calculated. The results proved that the proposed method is suitable for the quantitative evaluation of the DHV in different conditions.
(3) Two methods of characterization were used to assess DHV. Information from images was used to analyze the state of the discharge, and the internal distribution of the plasma temperature was obtained to accurately assess DHV.
The original contributions presented in the study are included in the article/Supplementary material, further inquiries can be directed to the corresponding author.
HY: conceptualization, methodology, software, investigation, formal Analysis; MC: data curation, writing–original draft; HZ: visualization, investigation; FZ: resources, supervision; LZ: software, validation; FS: visualization, writing, review and editing; XW: reviewing and editing. All authors contributed to the article and approved the submitted version.
Author LZ was employed by State Grid Shaanxi Electric Power Co., Ltd.
The remaining authors declare that the research was conducted in the absence of any commercial or financial relationships that could be construed as a potential conflict of interest.
All claims expressed in this article are solely those of the authors and do not necessarily represent those of their affiliated organizations, or those of the publisher, the editors and the reviewers. Any product that may be evaluated in this article, or claim that may be made by its manufacturer, is not guaranteed or endorsed by the publisher.
1. Shao T, Liu F, Hai B, Ma Y, Wang R, Ren CY Surface modification of epoxy using an atmospheric pressure dielectric barrier discharge to accelerate surface charge dissipation. IEEE Trans Dielectrics Electr Insul (2017) 24(3):1557–65. doi:10.1109/tdei.2017.006321
2. Engelhardt M, Kogelheide F, Stapelmann K, Bibinov N, Peter A. Micro-plasmoids in self organized filamentary dielectric barrier discharges. Plasma Process Polym (2017) 14(7):1600095. doi:10.1002/ppap.201600095
3. Mei DH, Fang Z, Shao T Recent progress on characteristics and applications of atmospheric pressure low temperature plasmas. Proc CSEE (2020) 40(4):1339–58. doi:10.13334/j.0258-8013.pcsee.191615
4. Laroussi M, Lu M, Keidar M Perspective: the physics, diagnostics, and applications of atmospheric pressure low temperature plasma sources used in plasma medicine. J Appl Phys (2017) 122:020901. doi:10.1063/1.4993710
5. Ambrico PF, Šimek M, Rotolo C, Morano M, Minafra A, Ambrico M, et al. Surface dielectric barrier discharge plasma: a suitable measure against fungal plant pathogens. Scientific Rep (2020) 10:3673. doi:10.1038/s41598-020-60461-0
6. Choudhury B, Portugal S, Mastanaiah N, Johnson J, Roy S. Inactivation of Pseudomonas aeruginosa and Methicillin-resistant Staphylococcus aureus in an open water system with ozone generated by a compact, atmospheric DBD plasma reactor. Scientific Rep (2018) 8:17573. doi:10.1038/s41598-018-36003-0
7. Alexander S, Lara-Ortega FJ, David Klute F, Brandt S, Schilling M, Michels A, et al. Soft argon–propane dielectric barrier discharge ionization. Anal Chem (2018) 90(5):3537–42. doi:10.1021/acs.analchem.7b05390
8. Baldus S, Kogelheide F, Bibinov N, Stapelmann K, Peter A. Phase resolved analysis of the homogeneity of a diffuse dielectric barrier discharge. J Phys D: Appl Phys (2015) 48(37):375202. doi:10.1088/0022-3727/48/37/375202
9. Du YJ, Nayak G, Oinuma G, Peng ZM, Bruggeman PJ Effect of water vapor on plasma morphology, OH and H2O2 production in He and Ar atmospheric pressure dielectric barrier discharges. J Phys D: Appl Phys (2017) 50(14):145201–1. doi:10.1088/1361-6463/aa5e7d
10. Kogelschatz U Dielectric-barrier discharges: their history, discharge physics, and industrial applications. Plasma Chem Plasma Process (2003) 23(1):l–46. doi:10.1023/A:1022470901385
11. Fang Z, Xie X, Li J, Yang H, Qiu Y, Kuffel E. Comparison of surface modification of polypropylene film by filamentary DBD at atmospheric pressure and homogeneous DBD at medium pressure in air. J Phys D: Appl Phys (2009) 42(8):085204. doi:10.1088/0022-3727/42/8/085204
12. Fang Z, Ding ZF, Shao T, Zhang C Hydrophobic surface modification of epoxy resin using an atmospheric pressure plasma jet array. IEEE Trans Dielectrics Electr Insul (2016) 23(4):2288–93. doi:10.1109/tdei.2016.7556505
13. Fang Z, Wang XJ, Shao T, Zhang C Influence of oxygen content on argon/oxygen dielectric barrier discharge plasma treatment of polyethylene terephthalate film. IEEE Trans Plasma Sci (2017) 45(2):310–7. doi:10.1109/tps.2016.2633063
14. Ayan H, Fridman A.F, Gutsol V.N., Vasilets A, Fridman G, Friedman G Nanosecond-Pulsed uniform dielectric-barrier discharge. IEEE Trans Plasma Sci (2008) 36(2):504–8. doi:10.1109/tps.2008.917947
15. Luo HY, Ran JX, Wang XX Atmospheric pressure dielectric barrier discharge for siloxane reformation. J Phys D: Appl Phys (2019) 53(01):5202. doi:10.1088/1361-6463/ab4689
16. Liu Y, Yan H, Fan Z, Guo H, Ren C. Influence of residual charge on repetitively nanosecond pulsed dielectric barrier discharges in atmospheric air. Phys Plasmas (2017) 24(11):3514. doi:10.1063/1.4986390
17. Fan X, Zhu TL, Sun TF, Yan X. The roles of various plasma species in the plasma and plasma-catalytic removal of low-concentration formaldehyde in air. J Hazard Mater (2011) 196:380–5. doi:10.1016/j.jhazmat.2011.09.044
18. Fan R, Wang YG, Liu Y, Zhang XN, Tu ZT, Zhang J The exploration of discharge efficiency and uniformity improvement with pre-ionized bipolar pulse method in DBD device. Phys Plasmas (2020) 27(8):083508. doi:10.1063/5.0007662
19. Guo HF, Yan HJ, Liu YD, Fan ZH, Wang YY, Ren CS Experimental study on uniformity of dielectric barrier discharge generated by nanosecond pulse in atmospheric air. Phys Plasmas (2018) 25(9):093505. doi:10.1063/1.5038943
20. Kundu SK, Kennedy EM, Gaikwad VV, Molloy TS, Dlugogorski BZ Experimental investigation of alumina and quartz as dielectrics for a cylindrical double dielectric barrier discharge reactor in argon diluted methane plasma. Chem Eng J (2012) 80:178–89. doi:10.1016/j.cej.2011.11.039
21. Du Y, Wu K, Meng YP, Yang X The transition of partial discharge to homogeneous discharge in nitrogen at low pressure. In: Proceedings of the 2017 International Symposium on Electrical Insulating Materials (ISEIM); September 2017; Toyohashi, Japan (2017). p. 636–9.
22. Pang L, Zhang QG, Ren BZ, He K Effects of high-speed airflows on a unipolar repetitive nanosecond surface discharge. IEEE Trans Plasma Sci (2011) 39(11):2922–3. doi:10.1109/tps.2011.2127496
23. Liu F, Fang Z, Mei DH The effect of dielectric materials on the discharge charactersitics of a coaxial dielectric barrier discharge driven by nanosecond power supply. IEEE Int Conf Plasma Sci (Icops) (2018) 1.
24. Pang L, He K, Di DX Effect of pulse polarity on nanosecond surface dielectric barrier discharge. IEEE Trans Plasma Sci (2014) 42(10):2340–1. doi:10.1109/tps.2014.2320278
25. Yang X, Wu K, Du Y, Ma XZ The influence of pulse repetition rate on the behavior of nanosecond pulsed dielectric barrier discharges. Int Conf Electr Mater Power Equipment (Icempe) (2019) 187–90.
26. NisolWatson BS, Lerouge S, Wertheimer MR Energetics of reactions in a dielectric barrier discharge with argon carrier gas: II mixtures with different molecules. Plasma Process Polym (2016) 13(5):557–64. doi:10.1002/ppap.201500161
27. Wu YF, Ye QZ, Li XW Classification of the discharge modes of dielectric barrier discharge using gray level histogram of discharge images under different exposure times. High Voltage Eng (2012) 38(05):1120–5. doi:10.3969/j.issn.1003-6520.2012.05.015
28. Wu Y.F, Ye Q.Z., Li X.W, Tan D. Classification of dielectric barrier discharges using digital image processing technology. IEEE Trans Plasma Sci (2012) 40(5):1371–9. doi:10.1109/tps.2012.2187802
29. Ye QZ, Yu DH, Yang F. Application of the gray-level standard deviation in the analysis of the uniformity of DBD caused by the rotary electrode. IEEE Trans Plasma Sci (2013) 41(3):540–4. doi:10.1109/tps.2013.2243472
30. Du WJ, Zhu WC, Guo ZQ Uniformity analysis of dielectric barrier discharge based on spatial structure of visible light image. Electromechanical Inf (2019) 36:6–7. doi:10.19514/j.cnki.cn32-1628/tm.2019.36.003
31. Zhang S, Wang W-C, Yang D-Z, Yuan H, Zhao Z-L, Sun H, et al. Nanosecond pulsed uniform dielectric barrier discharge in atmospheric air: a brief spectroscopic analysis. Spectrochimica Acta A: Mol Biomol Spectrosc (2019) 207:294–300. doi:10.1016/j.saa.2018.09.004
32. Zeniou A, Puač N, Škoro N, Selaković N, Dimitrakellis P, Gogolides E, et al. Electrical and optical characterization of an atmospheric pressure, uniform, large-area processing, dielectric barrier discharge. J Phys D: Appl Phys (2017) 50(13):5204. doi:10.1088/1361-6463/aa5d69
33. Massines F, Segur P, Gherardi N, Khamphan C, Ricard A Physics and chemistry in a glow dielectric barrier discharge at atmospheric pressure: diagnostics and modelling. Surf Coat Tech (2003) 174:8–14. doi:10.1016/s0257-8972(03)00540-1
34. Ye QZ, Yun DH, Yang FL, Tan D Application of the gray-level standard deviation in the analysis of the uniformity of DBD caused by the rotary electrode. IEEE Trans Plasma Sci (2013) 41(3):540–4. doi:10.1109/tps.2013.2243472
35. Park S, Choe W, Moon SY, Yoo SJ. Electron characterization in weakly ionized collisional plasmas: from principles to techniques. Adv Phys X (2019) 4(01):1526114. doi:10.1080/23746149.2018.1526114
36. Gangwar RK, Levasseur O, Naud N, Gherardi N, Massines F, Margot J, et al. Determination of the electron temperature in plane-to-plane He dielectric barrier discharges at atmospheric pressure. Plasma Sourc Sci Tech (2015) 25(01):5011. doi:10.1088/0963-0252/25/1/015011
37. Shao T, Sun GS, Yan P, Wang J, Yuan WQ, Sun YH, et al. An experimental investigation of repetitive nanosecond-pulse breakdown in air. J Phys D: Appl Phys (2006) 39(10):2192–7. doi:10.1088/0022-3727/39/10/030
38. Eliasson B, Kogelschatz U Modeling and applications of silent discharge plasmas. IEEE Trans Plasma Sci (1991) 19(2):309–23. doi:10.1109/27.106829
39. Ren CH, He XR, Jia PY, Wu K, Li X Influence of asymmetric degree on the characteristics of a homogeneous barrier discharge excited by an asymmetric sine. Phys Plasmas (2020) 27(11):113507. doi:10.1063/5.0024907
40. Cui W, Lin Q, LiZhao HBS, Zhang Y, Huang Y, Fan S, et al. Influence of Ti3C2T x (MXene) on the generation of dielectric barrier discharge in air. Plasma Sci Tech (2021) 23(11):115403. doi:10.1088/2058-6272/ac1e77
41. Moravej M, Yang X, Nowling GR, Chang JP, Hicks RF, Babayan SE Physics of high-pressure helium and argon radio-frequency plasmas. J Appl Phys (2004) 96(12):7011–7. doi:10.1063/1.1815047
42. Huang Y, Meng YP, Mei L, Ma YH, Wu K Influence of gas flow on the characteristics of dielectric barrier discharge in helium at atmospheric pressure. High Voltage Eng (2022) 48(07):2737–2746. doi:10.13336/j.1003-6520.hve.20211395
43. Liu F, Zhuang Y, Zhao YL, Chen J, Fang Z. Effects of O2 addition on the plasma uniformity and reactivity of Ar DBD excited by ns pulsed and AC power supplies. Plasma Sci Tech (2022) 24(5):054004. doi:10.1088/2058-6272/ac41c1
44. Liu SW, Jiang N, Wang QS, Guo YF, Li J, Wu Y Discharge characteristic of dielectric barrier discharge with low flow rate under atmosphere pressure with argon. High Voltage Eng (2018) 44(06):1988–95. doi:10.13336/j.1003-6520.hve.20180529035
Keywords: dielectric barrier discharge, uniform discharge, dispersion normalization method, local temperature difference method, discharge uniformity
Citation: Yang H, Chen MM, Zhang HT, Zhou FS, Zhang L, Sun F and Wang X (2023) Examining homogeneity of dielectric barrier discharge using dispersion normalization and local temperature difference methods. Front. Phys. 11:1189371. doi: 10.3389/fphy.2023.1189371
Received: 19 March 2023; Accepted: 20 November 2023;
Published: 05 December 2023.
Edited by:
Li Lin, George Washington University, United StatesReviewed by:
Carles Corbella Roca, George Washington University, United StatesCopyright © 2023 Yang, Chen, Zhang, Zhou, Zhang, Sun and Wang. This is an open-access article distributed under the terms of the Creative Commons Attribution License (CC BY). The use, distribution or reproduction in other forums is permitted, provided the original author(s) and the copyright owner(s) are credited and that the original publication in this journal is cited, in accordance with accepted academic practice. No use, distribution or reproduction is permitted which does not comply with these terms.
*Correspondence: H. Yang, eWFuZ2hhb0B4cHUuZWR1LmNu
Disclaimer: All claims expressed in this article are solely those of the authors and do not necessarily represent those of their affiliated organizations, or those of the publisher, the editors and the reviewers. Any product that may be evaluated in this article or claim that may be made by its manufacturer is not guaranteed or endorsed by the publisher.
Research integrity at Frontiers
Learn more about the work of our research integrity team to safeguard the quality of each article we publish.