 Dingkun Ma1
 Hao Li1*Ruixue Wu1Yinan Li1Rongchuan Lü1Yan Ma1Yi Ding1Xiaojiao Yang1Tong Jiang1Xumin Yu2
- 1China Academy of Space Technology (Xi’an), Xi’an, China
- 2China Academy of Space Technology, Beijing, China
Interference has recently become a critical factor in communication satellite performance, and the interference source location is one of the most important factors in resolving this issue. The article proposes an innovative method of interference source direction-finding suitable for communication satellites with an existing single antenna beam and single radio frequency (RF) channel, which utilizes the symmetry of the antenna pattern to search for interference sources. Compared to traditional position methods with time-frequency-synchronized multi-satellites or a directing antenna array in a single satellite, the method does not require any particular direction-finding payload in communication satellites and shares existing antennas and RF channels with communication systems in satellites. The ability to find the direction of the interference source is a software-defined function in the communication processor. The proposed method provides a novel way to solve the problems of interference source direction-finding with the least engineering complexity, and it has excellent coexistence with other existing systems in communication satellites. The computer simulation and out-field experiment results in this article show that the method has excellent performance with high direction-finding resolution within extensive coverage, offering significant value and bright prospects for resolving the growing interference issues in communication satellites.
1 Introduction
Communication satellites are crucial to space and terrestrial integrated systems since they provide ubiquitous connectivity in all-terrain, all-weather, and full-scenes [1, 2]. Compared to terrestrial wireless communication networks, satellite-based communications are more susceptible to intentional or unintentional jamming, and interference trouble has become an essential factor in reducing the performance of communication satellites [3]. In the global effort to address the issues of interference in military and commercial satellites, interference source direction-finding [4–10] is one of the most crucial components that can help subsequent interference suppression in the spatial domain.
Currently [11, 12], traditional systems use dual-satellite positioning structures to find the direction of satellite jamming locations with good performance. The satID of Kratos in the United States, which is one of the most famous dual-satellite positioning structures, has a maximum positioning resolution of 5 km. The dual-satellite structure is a research hotspot in the interference source-directing domain [13–16]. However, the system structure of dual-satellite interference source-directing is complicated, and the engineering scale is enormous. Another way to find the direction of satellite jamming positioning is based on a single satellite, and the methods include multiple signal classification (MUSIC), estimation of signal parameters via rotational invariance techniques (ESPRIT), amplitude comparison, and interferometry [17–20]. Among them, the amplitude-comparison direction-finding method has a straightforward implementation but a limited resolution. However, it is still a challenging problem to address the unique application requirements of interference source direction-finding in communication satellites with the least engineering complexity, since they still require an antenna array and multiple RF channels.
This article focuses on the interference problems in communication satellites and proposes a novel method of jamming positioning with existing antennas and RF receivers. The technique utilizes the symmetry of the antenna beam, which can be applied on many occasions when a phased array antenna or mechanical scanning antenna exists.
The contributions of the method are as follows:
A: The method utilizes the symmetry of the antenna pattern, rather than the antenna gain, to find the direction of the interference source, resulting in a high direction-finding resolution of less than 0.1°.
B: A particular structure is adopted in the process, and it has an instantaneous extensive area with high direction-finding resolution.
C: Without utilizing any particular direction-finding payload, the ability of the interference source direction-finding is a function, that is, software defined in communication processors, and it has good coexistence with other systems in communication satellites.
2 Interference source direction-finding methods
The method has two stages of directing interference sources: cross-searching direction-finding (CSD) and equal field searching direction-finding (EFSD). The result of the CSD method would be adopted as the initial position of the interference source for the EFSD method to minimize the searching range.
2.1 CSD method
The antenna beam scans the interference source in both horizontal and vertical directions to create a received power sequence. Then, the interference source position (ISP) is searched for via the symmetry of the antenna gain sequence, which is modulated by the ISP in the antenna scanning process.
To explain the principle of the CSD method more clearly, this article defines the horizontal direction and vertical direction as the X direction and Y direction, respectively. The principles of the CSD method in the X direction and Y direction are similar. To simplify the explanation, the article focuses on the CSD principle in the X direction, which is depicted in Figure 1.
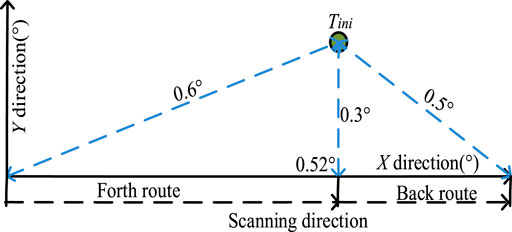
FIGURE 1. Geometric diagram of the back-and-forth route.
Assume that the interference source is located at 0.52° in the X direction and 0.3° in the Y direction. In the scanning process of the X direction, the angle between the interference source and communication satellite varies from 0.6° to 0.3° and 0.5°. As a result, the gain route of the communication antenna corresponds to the ISP, as shown in Figure 2.
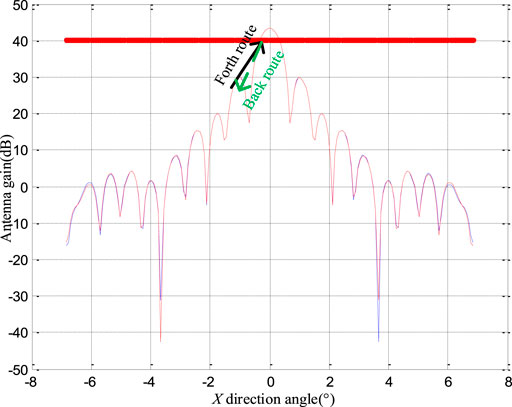
FIGURE 2. Diagram of the round-trip in the antenna pattern.
Since the ISP is not cooperative, the corresponding position of the antenna gain has significant uncertainty in that it may be located in the local maximum or minimum sidelobe of the antenna pattern. However, another significant feature is that the corresponding position of the antenna gain has excellent symmetry in the round-trip, which can be utilized to search the ISP ingeniously.
The corresponding gain curve is obtained by scanning the ISP in the X direction, which has three cases according to the different ISP locations. Case 1: the ISP is located in the middle of the scanning route, as shown in Figure 3A. Case 2: the ISP is located at the beginning of the scanning route, as shown in Figure 3B. Case 3: the ISP is located at the end of the scanning route, as shown in Figure 3C.
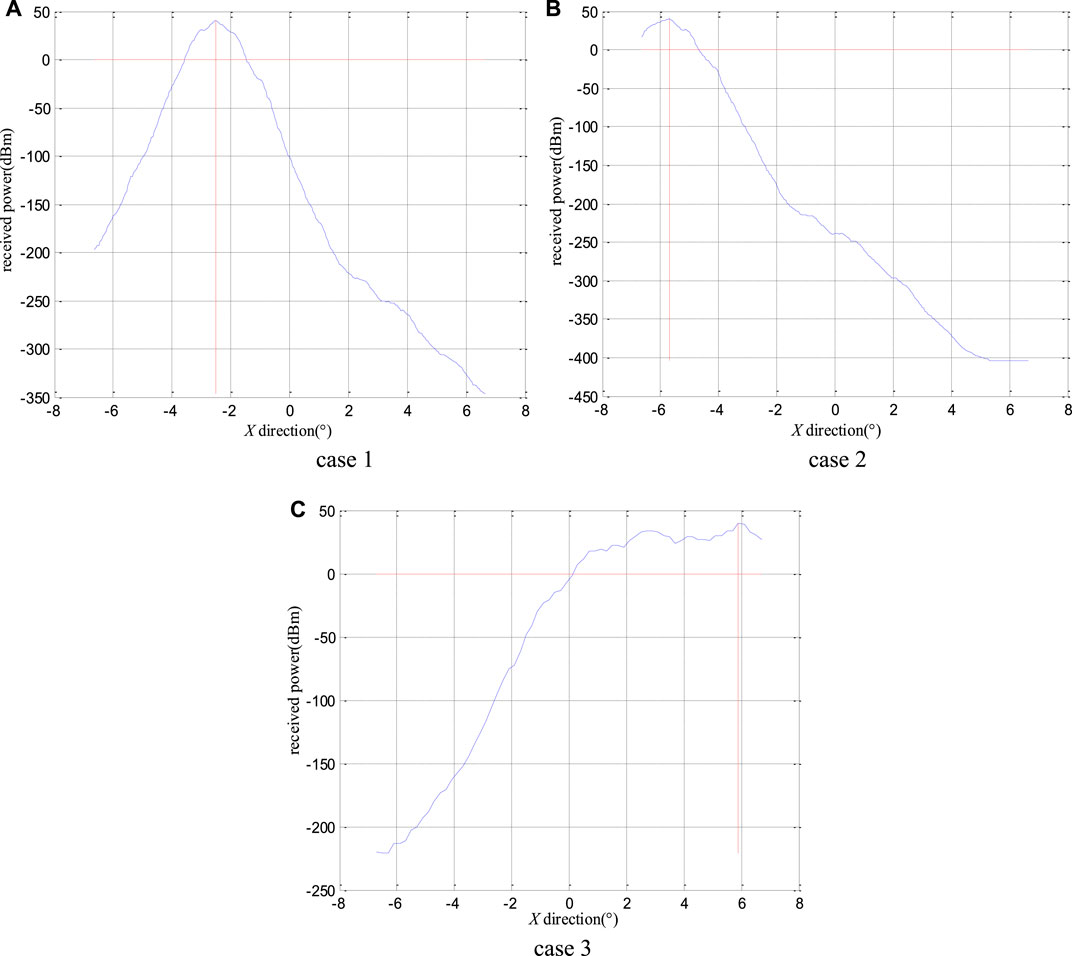
FIGURE 3. Corresponding gain curve obtained by scanning different ISP locations. (A) case 1: the middle of the scanning route. (B) case 2: the beginning of the scanning route. (C) case 3: the end of the scanning route.
When the ISP is located in the middle of the scanning route, the symmetric center of the scanning curve is in the direction of the ISP, as shown in Figure 3A. When the interference source is located at the beginning or end of the scanning route, the gain scanning curve does not satisfy the symmetry, as shown in Figures 3B, C, and the angle corresponding to the maximum point is the estimation of the ISP in the X direction. It can be observed that the direction-finding accuracy is higher when the interference source is located in the middle of the scanning route than when the interference source is located at the beginning or end of the scanning route.
Similarly, the ISP in the Y direction can also be found. Finally, the two-dimensional directions of the target can be obtained by scanning the ISP in both X and Y directions. Furthermore, multiple iterations of scanning can increase the direction resolution.
The CSD method is summarized in the following six steps:
Step 1: By scanning the inference position in the horizontal direction, the antenna would receive the power sequence corresponding to the ISP. Meanwhile, the antenna scanning angles should be recorded and saved synchronously.
Step 2: In pursuit of higher resolution, a cubic spline interpolation is introduced to refine the step in the power sequence; then, the smoothing technique is utilized to filter the sequence to further enhance the continuity and stability.
Step 3: The automatic threshold, which is adapted to noise, can be brought in with the maximum value of the power sequence. Then, the rising and falling scanning angles in the power sequence should be calculated and recorded simultaneously based on the threshold.
Step 4: The ISP in the horizontal direction can be estimated by the angle, which is the median value of the rising and falling scanning angle.
Step 5: The ISP in the Y direction can be calculated by repeating steps 1–4.
Step 6: The horizontal and vertical positions of the interference source estimated in steps 4 and 5 are the ISP of the CSD method.
2.2 EFSD method
The antenna beam is utilized to conically scan the point Tini outputted by using the CSD method explained in Section 2.1. On this basis, the EFSD method can significantly increase the resolution of the ISP, as shown in Figure 4.
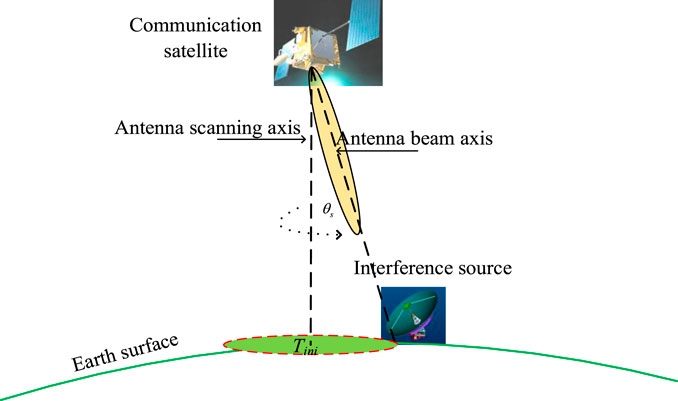
FIGURE 4. Diagram of the EFSD method.
When the ISP does not stand in the center of the circle, the envelope of the received power by antenna scanning would be nearly modulated by the sinusoid model in Figure 5. It can be concluded that the amplitude and phase of the power scanning curve are modulated by the ISP, and this trick can be utilized to design the EFSD method.
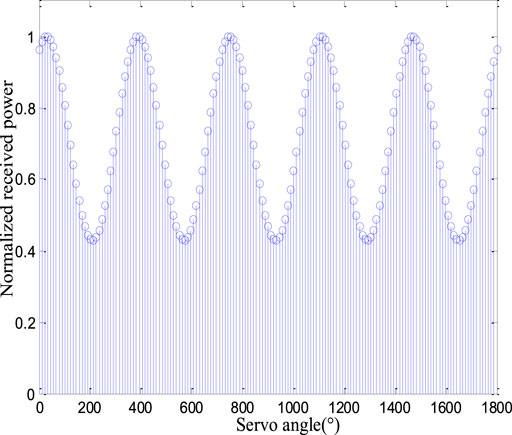
FIGURE 5. Sinusoidal modulation amplitude series that the antenna receives.
As shown in Figures 4, 6, the antenna beam scans the point Tini and draws a cone around the point Tini with a certain angular velocity ωs. Then, the power sequence of the received signal can be obtained. The geometric relationship between the ISP and antenna beam is shown in Figure 6.
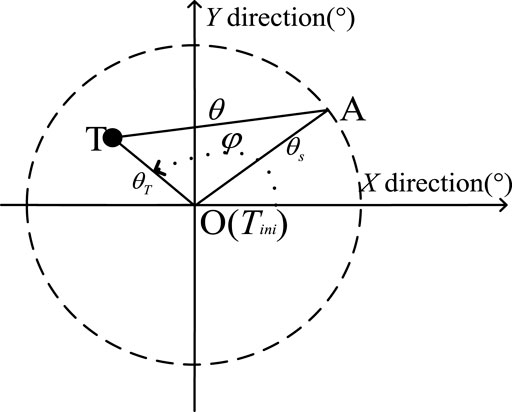
FIGURE 6. Geometric diagram of the ISP and antenna beam axis.
The initial ISP point Tini includes the point TiniX in the X direction and the point TiniY in the Y direction. Because the resolution of direction-finding by cross-searching is limited, the position may inevitably have certain errors. Assuming that the actual ISP is at point T, the point Tini deviates from the antenna scanning axis by θs. The method scans around the point Tini with a fixed angular velocity ωs and draws a cone with a radius of θs. The scanning trajectory is a dashed circle where point A stands as shown in Figure 6. The angle between the points Tini and T is θT, and the angle between points T and A is θ. Finally, the parameter ϕ is the deflection angle between the point T and the X-axis.
Assuming that the antenna scanning angle is ωst, the geometric angle relationship can be expressed as follows:
The distribution of antenna gain is circular symmetry, and the antenna pattern can be approximated by the Gaussian function as follows:
Assume that the amplitude of the interference signal received by the antenna is U and the deviation angle between the interference source and antenna axis is θ. The amplitude of the received power can be expressed as follows:
Then, we obtain
where
In Eq. 4, the first-factor exp (.) does not contain scanning modulation, and the second-factor exp (.) in V includes scanning modulation of the interference source. Then, Eq. 4 is updated as
Here, the parameter
As a result, Eq. 5 can be expressed as
The amplitude of the received power is modulated by the rotary scanning of the beam. The modulation amplitude is 2aθTθs, and it is proportional to the angle θT, implying that the interference source deviates from the scanning axis. The modulation phase is ϕ, which is the deviation of the interference source angle.
According to the amplitude and phase of the received power sequence, this method can adjust the scanning axis of the detection antenna to approximate the ISP. The closer the ISP approaches the antenna rotation axis, the smaller the amplitude of sinusoidal modulation can be received. Due to the antenna scanning axis being aligned with the direction-finding of the interference source, the equation θT = 0 is possible in that case. The signal’s amplitude that the antenna receives appears as a series of fixed pulses, and the direction of the antenna scanning axis is the ISP at this moment. It can be observed that when the amplitude of the received power sequence is larger, it has lower sensitivity to noise. Therefore, to estimate the deviation angle of the interference source more precisely, the parameter θTθs should be set at a larger value, as shown in Figure 7.
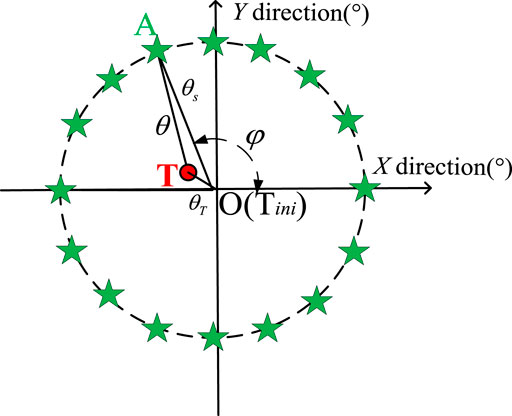
FIGURE 7. Trajectory of equal field searching.
The orthogonal signals cos (wst) and sin (wst) are constructed by the antenna’s scanning rate ws; then, the angular correction from the interference source signal can be expressed as follows:
where
Similarly,
where
In the X and Y directions, the outputs of Eqs 8, 9 are proportional to the deviation angle between the estimated interference position Tini and the actual interference position T. We obtain the correction components of the antenna direction axis in two orthogonal directions, as follows:
The parameter k in Eqs 10, 11 is the direction-finding correction coefficient, and the actual point T can be approximated by Eqs 12, 13:
Several iterations are carried out until ∆X and ∆Y are less than the required direction-finding resolution; then, the place where the point On (Tini Xn, Tini Yn) stands is the ISP, as shown in Figure 8.
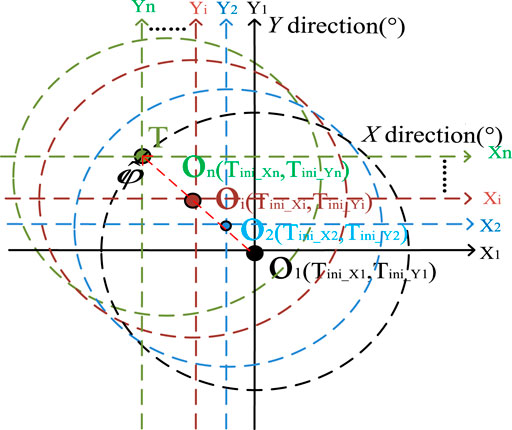
FIGURE 8. Diagram of the iterative approximation.
The process of the EFSD method is summarized in the following four steps:
Step 1: The energy sequence ur (t) is obtained by conical scanning of the point Tini with a radius θs.
Step 2: The orthogonal signals cos (wst) and sin (wst) are constructed to obtain the horizontal offset uX and the vertical offset uY.
Step 3: The horizontal correction ∆X and the vertical correction ∆Y can be obtained by the adjustment factor k.
Step 4: When the sum of the horizontal correction ∆X and the vertical correction ∆Y is less than the preset precision, the point Tini would nearly coincide with the actual point T. Otherwise, the position of the point Tini should be updated again by repeating steps 1–3.
3 Experiment results
First, in this section, computer simulation experiments are implemented to evaluate the performance of the CSD and EFSD methods. Furthermore, out-field experiments are carried out to verify the effectiveness of the proposed methods.
3.1 CSD method experiments
Due to the performance and distribution of direction-finding in the X and Y directions being similar, to facilitate the analysis of performance, this article focuses on analyzing the resolution of direction-finding in the X direction. Taking the geostationary orbit (GEO) communication satellite as an example, the maximum scanning angle corresponding to the whole Earth is ±8.6°. The antenna has a narrow beam with a width of 0.4°. The aptitude measurement errors, which are set at 3 dB, are distributed using the Gaussian model. The axis pointing errors are set at 0.2°.
Within the area of the red dotted line, the resolution of the CSD method is less than 0.1°, as shown in Figure 9. Due to the uniform compensation of error distribution in the cross-searching process, the accuracy in the experiments is excellent, and it is unaffected by the antenna axis pointing errors and antenna beam width. The distribution of this method has the following characteristics:
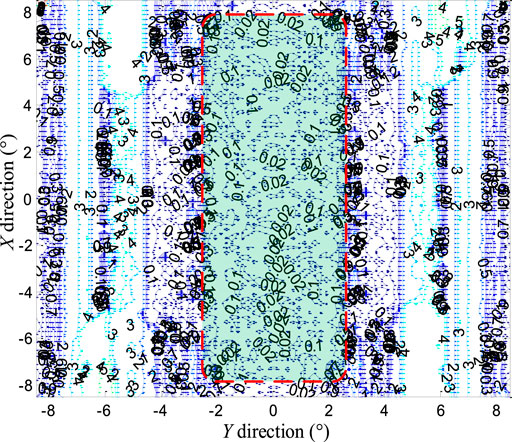
FIGURE 9. Results of the CSD method.
A: The precision of the direction distribution results in the experiments agrees with the principal analysis of the CSD method in Section 2.1. Because the scanning gain curve does not satisfy the symmetry, as shown in Figures 3B, C, the direction accuracy is poor at the scanning boundary.
B: Because the antenna sidelobe gain beyond the main lobe (0.4°) is volatile, direction precision has excellent performance within the middle of the region, which is less than ±2° in the Y direction, and poor performance in the rest of the searching region.
To improve the performance within the global coverage (±8.6°), this article divides the global region into four bands, as shown in Figure 10, and the width of each band is ±2°. The CSD method would be limited to work in this region. After applying the horizontal direction-finding process in the Y direction, the vertical direction-finding process by using the CSD method starts, and the interference source location Tini can be obtained within nearly five iterations, as shown in Figure 10.
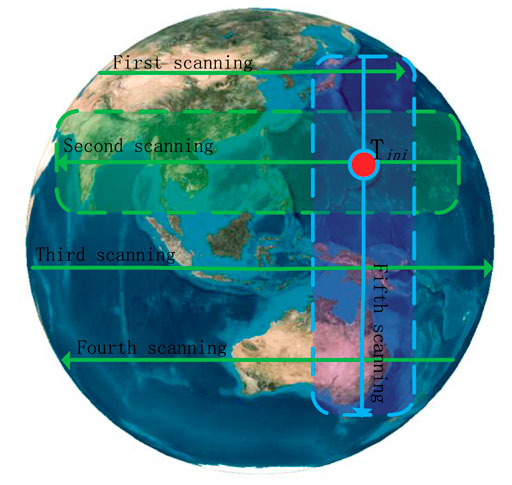
FIGURE 10. Cross-searching to cover the Earth.
3.2 EFSD method experiments
Taking the location Tini as the center, the antenna beam scans point Tini with a radius of 0.5° and obtains 256 points of the received power sequence in a circle. The precision variables ∆X and ∆Y are set at 0.01°. The aptitude measurement errors, which are set at 3 dB, are distributed using the Gaussian model. The axis pointing errors are set at 0.2°. The results of the EFSD method are shown in Figure 11.
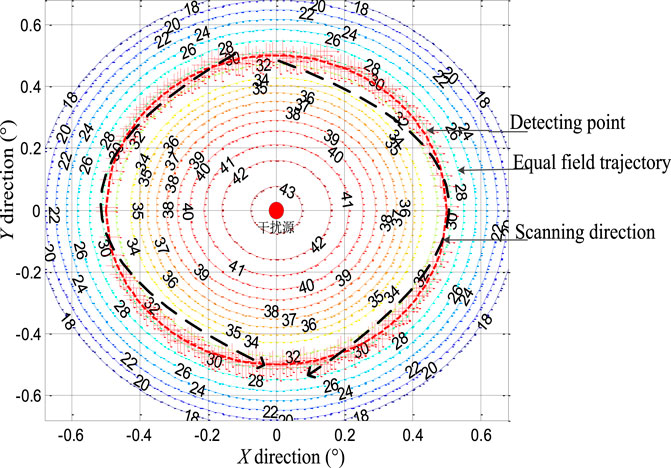
FIGURE 11. Trajectory of equal field searching.
Figure 11 shows that the center of the equal field searching trajectory is the ISP after multiple iterations of equal field searching.
The direction error distribution of the EFSD method is shown in Figure 12. In the area of the red dotted circle with a radius of approximately 2.5°, the direction precision, which is less than 0.01°, is distributed evenly.
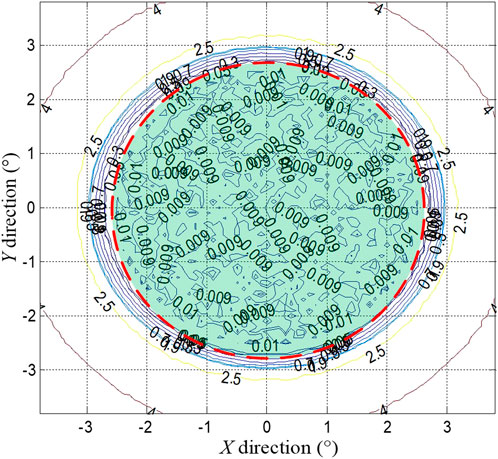
FIGURE 12. Distribution of direction errors.
The effectiveness of the proposed methods has been verified by the aforementioned experiments, and comparative experiments with the most classical methods in engineering are conducted to prove the superiority of the method proposed in this article. The direction-finding method proposed here is based on the power comparing principle, and the comparing techniques should be on the same theme. As a result, the methods, including the mono-pulse amplitude-comparison method [21], the direction-detecting algorithm from synthesis difference beam [22], and the three-beam-direction method [23], have been selected to conduct comparative experiments. The conditions of these experiments are that the antenna beam width is 0.4° and the direction coverage is ±8°. The direction error distributions of the three methods are shown in Figure 13.
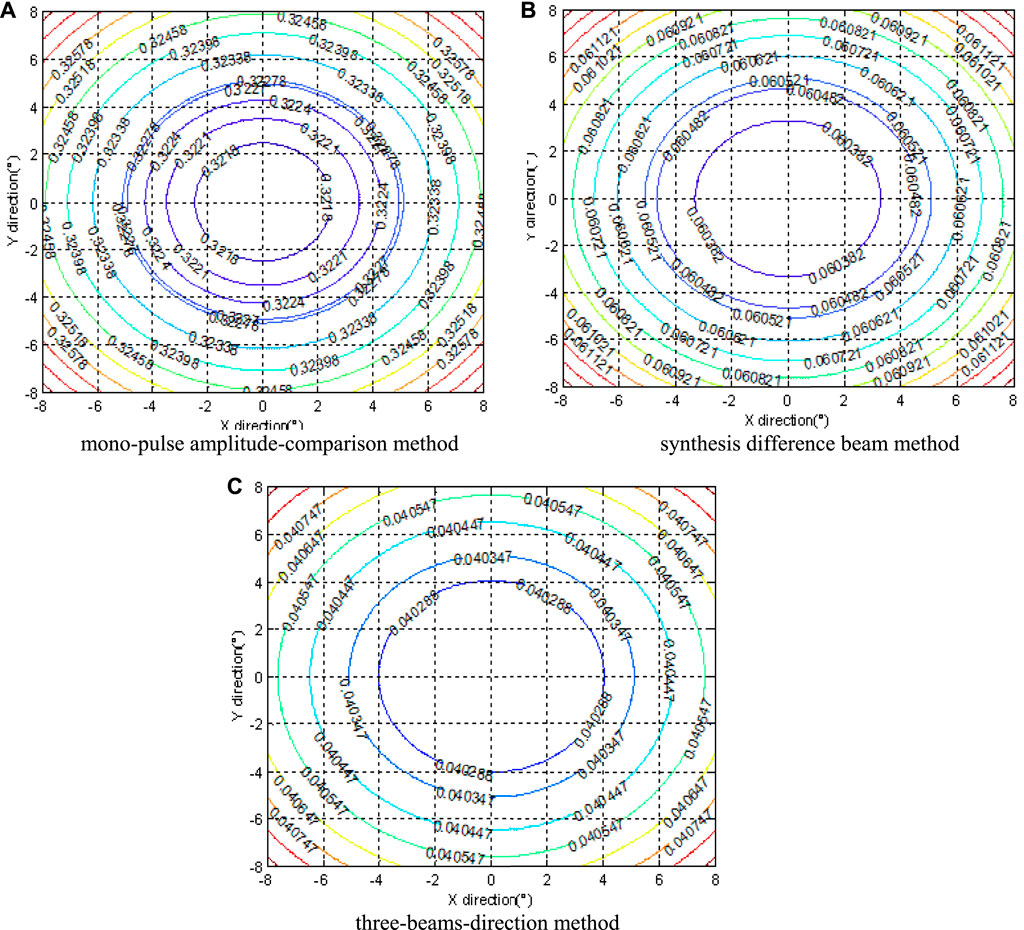
FIGURE 13. Direction error distributions of the most classical methods in engineering. (A) mono-pulse amplitude-comparison method. (B) synthesis difference beam method. (C) three-beams-direction method.
It can be observed that the performance of the three-beam-direction method can achieve 0.04°, which is the best direction precision among these three methods. However, it is still weaker than the performance of 0.01°, calculated through the proposed method. The novel approach in this article utilizes more power trajectory points to search the symmetry center of the antenna beam, and it makes a very positive contribution to increase direction precision.
3.3 Out-field experiments
Out-field experiments are also carried out to verify the proposed method’s effectiveness. There are two interference sources employed in these experiments, whose frequency can be set at 8.7 GHz (no. 1) and 8.72 GHz (no. 2). The diameter of the direction-finding antenna reflector is D = 1.2 m, and the antenna beam width is θ = 2°.
The requirement of the far-field condition is given as follows:
where R is the minimum distance required for the far-field condition and
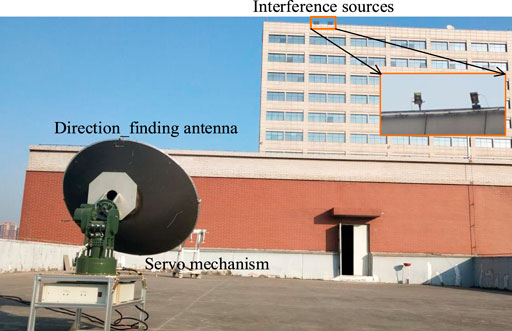
FIGURE 14. Scene of the out-field experiments.
The horizontal angle of the interference source no. 1 relative to the direction-finding antenna is 12.727° and the vertical angle is 58.358°. Meanwhile, the horizontal angle of the interference source no. 2 close to the direction-finding antenna is 13.582° and the vertical angle is 58.361°. The initial condition of the direction-finding antenna is set with a horizontal angle of 51.287° and a vertical angle of 19.798°, which is away from no. 1 by approximately 10°. When the CSD experiments are completed, the direction of the antenna is aimed at the position of no. 1. In the next step, the EFSD method is adopted to increase the direction precision higher. Similar experiments are carried out with the interference source no. 2 and the results are shown in Table 1:
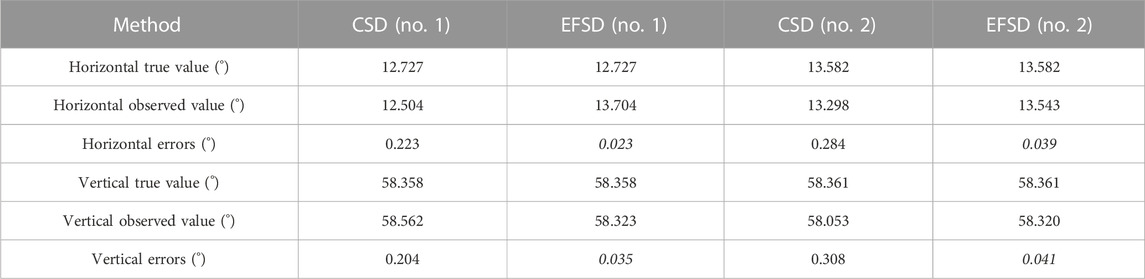
TABLE 1. Resolution of no. 1 and no. 2 in out-field experiments
The out-field experiments show that the CSD method can search an extensive area, and it is up to ±10° away from the actual interference position. The EFSD method scans around the estimated position outputted by the CSD method with a radius of 1.5° and has an excellent direction-finding accuracy of up to 0.02°–0.04°. The results of the experiments validate that the CSD method has the advantage of direction-finding in a more extensive area, and the EFSD method has the advantage of more accurate direction-finding results.
3.4 Conclusion
It can be observed from the results of computer simulation and out-field experiments that the CSD method in the first step has an advantage of an extensive search region of up to ±10° in out-field experiments; however, the direction-finding accuracy is limited. The CSD method can be applied to scenarios requiring extensive search regions and lower direction precision. As for the EFSD method in the second step, the accuracy is excellent, up to 0.04° within a small direction region of ±2.5° in out-field experiments. The two methods would be organically integrated to propose a new method, and it can achieve the advantage of high precision in an extensive search region. One point to be mentioned is that a larger value of the parameter step can be set to meet the requirements of a more extensive area on some occasions.
4 Discussion
This article proposes a novel interference source direction-finding method with the least engineering complexity. Independent of antenna gain, the method utilizes the symmetry of the antenna pattern to search for the ISP, and it has higher direction accuracy. Without any particular direction-finding payload, the method shares the antenna and RF channel with the existing communication systems and is suitable for most communication satellites. By adding a function of direction software, the method brings a new capability to solve interference problems and provides an innovative way to design communication satellites without any interference troubles. The computer simulation and out-field experiment results show that the method has excellent direction-finding performance in the extensive region. Meanwhile, the method shows significant value in engineering practice to mitigate interference problems in communication satellites.
It must be mentioned that the received power of the interference source is not fixed in practical applications because of transmitting antenna scanning, variable power, or other reasons. To eliminate the influences of variable signal power on the direction process, a branch with an omnidirectional antenna can be added, and the different power between direction and omnidirectional antennas would be calculated to create a new power sequence. With this astute correction, the method can be applied to direct variable interference sources as usual.
Data availability statement
The original contributions presented in the study are included in the article/Supplementary Material; further inquiries can be directed to the corresponding author.
Author contributions
Conceptualization: DM and HL; methodology: DM and RW; software: YL, RL, TJ, XJY, and YM; validation: DM, HL, and RW; investigation: RL and YM; resources: YD, YL, and XJY; writing—original draft preparation: DM and HL; writing—review and editing: DM and HL; visualization: DM and HL; supervision: TJ and XMY. All authors listed have made a substantial, direct, and intellectual contribution to the work and approved it for publication.
Funding
This research was funded by the Foundation Strengthen Project under Grant 2022-JCJQ-JJ-0591 and the National Energy Administration under Grant HTKJ2021KL504009.
Conflict of interest
The authors declare that the research was conducted in the absence of any commercial or financial relationships that could be construed as a potential conflict of interest.
Publisher’s note
All claims expressed in this article are solely those of the authors and do not necessarily represent those of their affiliated organizations, or those of the publisher, the editors, and the reviewers. Any product that may be evaluated in this article, or claim that may be made by its manufacturer, is not guaranteed or endorsed by the publisher.
References
1. Mou X, Zhang P, Li Y. The latest development of satellite jamming positioning technology [J]. China Radio (2014) 232(4):58–9.
2. Dong X, Jiang Y, Xuan CB. Research on multi-beam geo communication satellite jamming source location technology[C]. In: Proceedings of the 12th Annual Conference on satellite communications; 13 March 1988 - 17 March 1988; Arlington,VA,U.S.A (2016). p. 149–54.
3. Cao DB, Zhang J, Wen L. Accuracy analysis of single satellite Doppler rate of change passive location[J]. Aerospace Electron countermeasure (2010) 26(4):1–4.
4. Xu Y, Guo FC, Feng DW. A new satellite passive localization method using toa measurement only[J]. J Astronautics (2010) 31(2):502–8.
5. Long W, Chen R, Moretti M, Li J. AoA estimation for OAM communication systems with mode-frequency multi-time ESPRIT method. IEEE Trans Vehicular Tech (2021) 70(5):5094–8. doi:10.1109/tvt.2021.3070358
6. Selva J. Efficient wideband DOA estimation through function evaluation techniques. IEEE Trans Signal Process (2018) 66(12):3112–23. doi:10.1109/tsp.2018.2824256
7. Ikeuchi M, Tanji H, Murakami T, Improvement of the direction-of-arrival estimation method using a single channel microphone by correcting a spectral slope of speech, 2022 asia-pacific signal and information processing association annual summit and conference (Thailand: APSIPA ASC, Chiang Mai) (2022). 386–93.
8. Wu X, Zhu W, Yan J. A high-resolution DOA estimation method with a family of nonconvex penalties. IEEE Trans Signal Process (2018) 67(6):4925–38. doi:10.1109/tvt.2018.2817638
9. Liu Z, Zhang C, Yu P. Direction-of-Arrival estimation based on deep neural networks with robustness to array imperfections. IEEE Trans Antennas Propagation (2018) 66(12):7315–27. doi:10.1109/tap.2018.2874430
10. Xiong J, Cheong JW, Xiong Z. Carrier-phase-based multi-vehicle cooperative positioning using v2v sensors[J]. IEEE Trans Vehicular Tech (2020) 69(9):9258–541.
11. Yang B, Chen R, Li B. Multi-vehicle cooperative positioning based on edge-computed multidimensional scaling. China Commun (2021) 18(6):53–63. doi:10.23919/jcc.2021.06.005
12. Amiri R, Behnia F, Noroozi A. An efficient estimator for TDOA-based source localization with minimum number of sensors. IEEE Commun Lett (2018) 22(12):2499–502. doi:10.1109/lcomm.2018.2876525
13. Jiang T, Wu Y. The satellite ground collaboration reconnaissance and location under low restrained conditions[J]. Electron Inf Warfare Tech (2019) 34(1):1–4.
14. Inoue M, Hayashi K, Mori H, Nabetani T. A DOA estimation method with kronecker subspace for coherent signals. IEEE Commun Lett (2018) 22(11):2306–9. doi:10.1109/lcomm.2018.2870824
15. Raj AG, Mcclellan JH. Single snapshot super-resolution DOA estimation for arbitrary array geometries[J]. IEEE Signal Process. Lett (2019) 26(1):119–23.
16. Qin T, Lu Z, Ba B, Wang D. A decoupled direct positioning algorithm for strictly noncircular sources based on Doppler shifts and angle of arrival. IEEE Access (2018) 38(6):34449–61. doi:10.1109/access.2018.2849574
17. Yang J. Measurement of amplitude and phase differences between two RF signals by using signal power detection. IEEE Microwave Wireless Components Lett (2014) 24(3):206–8. doi:10.1109/lmwc.2013.2293665
18. Garcia N, Wymeersch H, Larsson EG, Haimovich AM, Coulon M. Direct localization for massive MIMO. IEEE Trans Signal Process (2017) 65(10):2475–87. doi:10.1109/tsp.2017.2666779
19. Gao Q, Young Jeon J, Park G, Shen Y. Source localization using beamforming and double L-shape sensors arrays. In: 2021 IEEE International Conference on Prognostics and Health Management (ICPHM); June 7-9, 2021; Detroit (Romulus), MI, USA (2021).
20. Glushankov EI, Tsarik VI. Space-frequency beamforming algorithms comparison with a circular antenna array. In: 2023 systems of signals generating and processing in the field of on board communications. Moscow: Russian Federation (2023). p. 1–5.
21. Fan ZL, Hu YK. Direction finding precision comparison between mono-pulse amplitude comparison and interferometer in array system[J]. Radar Sci Tech (2013) 11(4):434–6.
22. Xu JW, Liao GS, Zhu SQ. Approach of adaptive sum and difference beamforming based on magnitude and phase linear constraint[J]. Acta Electronical Sinica (2013) 41(9):1724–9.
Keywords: communication satellite, interference source direction-finding, single beam, cross-searching, equal field searching
Citation: Ma D, Li H, Wu R, Li Y, Lü R, Ma Y, Ding Y, Yang X, Jiang T and Yu X (2023) A novel method of interference source direction-finding with an existing single antenna beam in communication satellites. Front. Phys. 11:1185023. doi: 10.3389/fphy.2023.1185023
Received: 13 March 2023; Accepted: 09 May 2023;
Published: 01 August 2023.
Edited by:
Jian Dong, Central South University, ChinaReviewed by:
Rong Jin, Huazhong University of Science and Technology, ChinaLiton Chandra Paul, Pabna University of Science and Technology, Bangladesh
Liangbing Chen, Sun Yat-sen University, China
Copyright © 2023 Ma, Li, Wu, Li, Lü, Ma, Ding, Yang, Jiang and Yu. This is an open-access article distributed under the terms of the Creative Commons Attribution License (CC BY). The use, distribution or reproduction in other forums is permitted, provided the original author(s) and the copyright owner(s) are credited and that the original publication in this journal is cited, in accordance with accepted academic practice. No use, distribution or reproduction is permitted which does not comply with these terms.
*Correspondence: Hao Li, a2VybmVsX21hZGt3QDE2My5jb20=