 Wenjun Tang1
 Xiaoming Lin
94% of researchers rate our articles as excellent or good
Learn more about the work of our research integrity team to safeguard the quality of each article we publish.
Find out more
ORIGINAL RESEARCH article
Front. Phys., 25 April 2023
Sec. Interdisciplinary Physics
Volume 11 - 2023 | https://doi.org/10.3389/fphy.2023.1183419
This article is part of the Research TopicAdvances in Nonlinear Systems and Networks, Volume IIView all 11 articles
With the emergence of various high-powered electrical equipment, the demand for electric energy has increased rapidly. Subsequently, it has highlighted some issues of electricity consumption, such as the adjustment of electricity consumption peak. Although many electricity scheduling schemes have been proposed to adjust and control user load of electricity consumption, the current regulation of user load is not accurate and effective because the load regulation of different regional grid users is a complex network system. In this paper, we propose a reputation-based user electricity scheduling scheme for the complex network of user electricity consumption, whose purpose is to accurately adjust the electricity consumption of related users to further improve the adjustment of electricity consumption peak. In our scheme, we first model a complex network of user electricity consumption. Then we construct a reputation calculation method for electricity users, where the calculated reputation of users is one of the basis for assigning scheduling tasks to users and calculating the price subsidy received by users who complete the scheduling tasks. Further, we use the machine learning method to train a computation model to calculate the adjustment coefficients of electricity load, and then the electricity scheduling tasks are adjusted based on the calculated adjustment coefficients. Finally, the corresponding electricity scheduling tasks are assigned to the selected electricity users respectively for adjusting the electricity consumption of these users. Experiment results show the effectiveness of our proposed scheme. Our scheme can effectively calculate the reputation values of users based on their historical data, and the corresponding electricity scheduling tasks are effectively assigned to related users to accurately adjust the electricity consumption of these users according to their reputation values and the real-time adjustment coefficients, so as to efficiently improve the adjustment of electricity consumption peak.
With the continuous innovation of science and technology, various electrical equipment has emerged, which enriches people’s lives and provides greater security for people’s lives. However, the increase of electrical equipment has created greater demands for electricity. People also need to use many high-power electrical appliances in their daily lives. Therefore, huge electricity loads are generated, which can influence the stability of power grid systems and people’s daily life. Figure 1 shows the electricity consumption framework of power grid system. At present, the most common forms of electricity generation in daily life are thermal power generation, hydroelectric power generation, wind power generation and nuclear power generation, etc. Although there are various electricity generation forms and the amount of electricity generated is considerable, all aspects of life need electricity power to drive, leading to the total electricity load of all users is a too large or too small in certain periods, which increases the burden of electricity lines. And it will also increase the maintenance cost of power grid systems.
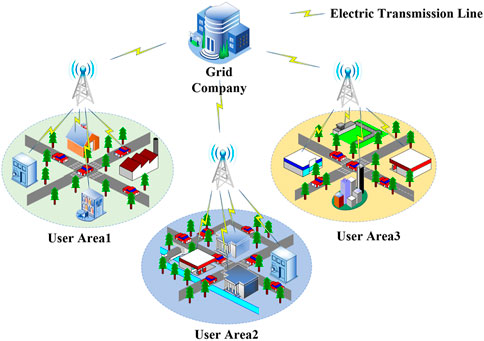
FIGURE 1. Electricity consumption framework of power grid system.
Due to the diversity and uncertainty of electricity demand, the electricity generation capacity set to meet the maximum demand of users is largely idle during the low demand period. Therefore, it not only increases the cost of electricity generation, but also increases the electricity bills burden of users. In order to change this situation, electric power enterprises have embarked on research and taken measures to manage the electricity load. In the early stage, some studies adjusted the production shift or the commuting time by guiding enterprises. And some studies suggest shut down large electrical equipment during peak hours to achieve off-peak electricity consumption. These schemes improve the load rate of the power grid. Subsequently, some new studies introduce economic incentives linked to the interests of users, and it further encourages users to voluntarily change the time and modes of their electricity consumption. This could further increase the power grid’s load rate and reduce users’ electricity bills. With the development of science and technology, power enterprises have adopted direct load control technology for some users.
In recent years, many researchers have devoted themselves to reducing the operation cost of electricity systems and improving the quality of electricity consumption in people’s daily life. However, many existing traditional solutions are using energy storage to reduce the occurrence of peak and trough of electricity consumption, which solves the problem of storage and waste of electric energy. But these schemes are all used after the occurrence of peak and valley of electricity consumption periods, which uses additional energy storage resources. The emergence of demand-side response avoids the above problems. In order to achieve the demand-side response, there are many studies suggest that indirectly affect the consumption time of users by adjusting the electricity price in different periods. This is a scheme specified for the consumption behavior of users, which prevents the occurrence of peak and valley of electricity consumption. And it does not need additional equipment to store electric energy.
[1] take into account the uncertainty of user’s response behavior and construct a high-dimensional parameter space that including multiple influencing factors such as participation, response time and net load power. And this scheme quantifies user’s response ability by utilizing the expectation of net load envelope domain before and after response. Then they propose a response capability gradient evaluation index that comprehensively considers power grid incentive cost and user’s response cost. There are also some works on the realization of demand-side response by encouraging users to participate in incentive demand response. The incentive demand response requires a contract signed between the power grid and users. The upregulated and downregulated capacity are directly controlled by the scheduling center, which can effectively suppress real-time electricity deviation. In order to fully improve the enthusiasm of users to participate in the incentive demand response, the real-time electricity deviation of the grid could be better suppressed. [2] propose a new idea of users’ participation in incentive demand response: for the incentive demand response with faster response speed, the power grid adjusts the incentive price of the incentive demand response according to the real-time electricity deviation. And the power grid allows users to re-declare the incentive demand response capacity of the future incentive demand response operating cycle 1 h before each rolling optimization. Therefore, the scheme achieves the goal that the incentive demand response capacity can increase or decrease with the trend of power deviation. But for the incentive demand response with slower response speed, the contract capacity declare before the day is executed.
To prevent the occurrence of electricity consumption peaks and valleys in complex network of user electricity consumption, we propose a reputation-based electricity scheduling scheme for complex network of user electricity consumption. In our scheme, we first model a complex network of user electricity consumption, which reflects the relationship and function of each entity in the network. Then in this model, we construct a reputation calculation method for electricity users, and then the users who participate in the incentive demand response of electricity scheduling are selected according to the calculated reputation of users. Further, we use the machine learning method to train a computation model to calculate the adjustment coefficients, and then the electricity scheduling tasks are adjusted based on the calculated adjustment coefficients. Finally, the corresponding electricity scheduling tasks are assigned to the selected electricity users respectively for realizing electricity peak load shifting. The main contributions of our scheme are summarized as follows.
• We propose a user electricity scheduling task allocation scheme in complex network of user electricity consumption, which can allocate corresponding electricity scheduling tasks for related users according to the calculated reputation of users to improve the reliability of power grid scheduling tasks. A two-layer user selection scheme is constructed to select related users participating in the incentive demand response of electricity scheduling, where these users are filtered based on their historical and real-time electricity consumption data.
• The machine learning method is used to train a computation model to calculate the adjustment coefficients of electricity load, and then the electricity scheduling tasks are adjusted based on the calculated adjustment coefficients.
• Experiment results show our proposed scheme is efficient and effective for adjusting electricity consumption peaks and valleys. Our scheme can effectively calculate the reputation values of users based on their historical data, and the corresponding electricity scheduling tasks are effectively assigned to related users.
The structure of the rest of this paper is as follows: In Section 2, we describe related works about the adjustment of electricity consumption. In Section 3, a reputation-based electricity scheduling scheme for complex network of user electricity consumption is proposed. In Section 4, we make some experiments to test the efficiency and effectiveness of our scheme. In Section 5, we draw our conclusions.
In order to solve the issues of electricity consumption, many scholars have proposed various schemes for efficient electricity scheduling, including the use of energy storage system in the peak discharge and trough of the power grid charging to alleviate the problem of peak and trough of electricity consumption, a scheme that indirectly affects the consumption habits of users through the change of electricity price, and a scheme that adjusts the consumption behavior of users and other schemes based on incentives.
Complex network refers to a network with self-organization, self-similarity, attractor, small world, scale-free, partial or total properties network. Over the years, many researchers have applied complex networks to power systems. In [3], a new methodology for stability assessment of a smart power system was proposed. The key to this assessment was an index called betweenness index which was based on ideas from complex network theory. [4] studied the vulnerability analysis and recognition of key nodes in power grids from a complex network perspective. To effectively analyze the behavior and verify the correctness of node electrical centrality, the net-ability and vulnerability index were introduced to describe the transfer ability and performance under normal operation and assess the vulnerability of the power system under cascading failures, respectively. When a single failure occurs in a vulnerable part of a power system, this may cause a large area cascading event. Therefore, an advanced method that could assess the risks during cascading events is needed. Therefore, [5] proposed an improved complex network model for power system risk assessment. Risk was defined by consequence and probability of the failures in their model, which were affected by both power factors and network structure. Compared with existing risk assessment models, the proposed one can evaluate the risk of the system comprehensively during a cascading event by combining the topological and electrical information. As a promising approach to modeling complex systems, complex networks could provide a sound theoretical framework for developing proper simulation model. [6] proposed a complex network model of the bilateral power transaction market. Unlike other general commodity transactions, both of the financial layer and the physical layer were considered in the model. Through simulation analysis, the feasibility and validity of the model were verified.
To implement effective electricity scheduling, the traditional schemes use the energy storage method to realize peak load shifting. [7] investigated the potential of peak shaving through battery storage. For each user, they studied the peak load reduction achievable by batteries of varying energy capacities (kWh), ranging from 0.1 to 10 times the mean power (kW). The results showed that for 75% of the users, the peak reduction stayed below 44% when the battery capacity was 10 times the mean power. Furthermore, for 75% of the users the battery remained idle for at least 80% of the time. [8] proposed a decision-tree-based peak shaving algorithm for the islanded micro-grid. The proposed algorithm helped an islanded micro-grid to operate its generation units efficiently; [9] tried to summarize the response modeling for different types of demand-side resources by analyzing the characteristics of different demand-side resources. Then they established a scheduling-response mode, which took optimal peak shaving response as its goal and took the power and electricity quantity as the constraint conditions to solve the model; [10] carried out a long-term distribution system (DS) planning model considering the peak shaving of the Energy station (ES), which was achieved by scheduling the input energy of ES. By regarding DS and ES as different stakeholders, a decentralized framework was devised to shave the electric peak loads in the DS planning, where the coupling relationship between the time-of-use (TOU) price and exchanged power (e.g., the input power of ES) was clearly expressed. [11] proposed a novel peak load shaving algorithm for peak shaving application in a hybrid photovoltaic (PV) generation system and Battery Energy Storage System connected isolated micro-grid (IMG) system, which helped an IMG system to operate its generation systems optimally and economically along with a PV generation unit.
Demand-side response refers to that when the wholesale electricity market price rises or the system reliability is threatened, electricity users change their habitual mode of electricity consumption after receiving the direct compensation notice of induced load reduction or the signal of electricity price rise sent by the electricity supplier. Therefore, the electricity supplier reduces or delays the electricity load in a certain period and responds to the electricity supply. Then it ensures the stability of the power grid system and restrains the short-term behavior of electricity price rise [12]. This scheme is a basic platform for communication between the power grid and users. According to different demand response modes of users, demand-side response technology in the smart power grid can be divided into a price-based and an incentive-based demand side response. According to the different response ways of users, demand response can be divided into two categories: price-based demand response and incentive-based demand response. Price-based demand response can be divided into time-of-use electricity price, real-time electricity price and peak electricity price. Price-based demand response adjusts the consumption time of users through the difference of electricity price in different periods. Compared with the period of high electricity price, users are more inclined to use electricity in the period of low electricity price. Incentive-based demand response refers to the demand response implementer making policies to encourage users to reduce the load when the system burden is large or the electricity price is high. Incentive-based demand response can be divided into direct load control, interruptible load, demand-side bidding, emergency demand response and capacity/auxiliary service plan, etc. The existing incentive-based demand response mainly consists of direct load control and interruptible load.
There are many schemes to implement demand-side response. Some studies indirectly regulate users’ electricity consumption behavior through TOU, so as to achieve scheduling goals. [13] derived the optimal capacity investment and pricing decisions for the electricity company. Furthermore, they used real data from a case study to validate the results and derived insights for implementing the TOU tariff. [14] proposed an analytical method that incorporated the TOU strategy into the reliability evaluation of the electricity system. A price-based demand response was modeled to calculate the hourly load using an apportionment method. By using the particle swarm optimization algorithm, a TOU-based optimization model with a penalty was constructed to find the optimal electricity price in their scheme. [15] proposed models of costs to utility companies arising from user demand fluctuations, and models of user satisfaction with the difference between the nominal demand and the actual consumption. They designed utility functions for the company and the users, and obtained a Nash equilibrium using backward induction. Some studies have implemented different measures for different users based on their behaviors, so as to better develop demand response schemes. [16] based on system dynamics, constructed a demand response incentive signal strength analysis model, analyzed the demand response behavior of different users, and calculated demand response incentive subsidies standards for different types of users. [17] decomposed the users’ electricity consumption situation by using the additive model, extracted various influencing factors, and constructed the modulus one vector to describe and analyzed the electricity consumption behavior of different users. [18] based on the research of feature optimization method for the behavior analysis of intelligent electricity users in the early stage proposed a cluster number optimization method for user behavior analysis to effectively improve the data clustering effect of electrical behavior analysis. [19] proposed a Python-based K-means plus clustering algorithm to classify Taiyuan electricity data. The K-means plus clustering algorithm classified the data of electricity consumption and finally got five different kinds of users. [20] discussed the cluster analysis of electricity consumption behavior and the selection of demand target users, and proved that the selection could guide the implementation of demand response projects. A reasonable assessment of demand response potential was of great significance for effectively gathering demand-side resources. [21] took Jiangxi Province as an example to predict the load after the analysis of adjustable load, analyzed the adjustable load of users, and evaluated the demand response potential of different users. There are also some other demand-side response schemes. [22] proposed a new economic scheduling model combined with wind power, which considered incentive-based DR And reliability measures. Compared with the traditional model, this model considered the response of the users’ electricity consumption to the incentive price. The expected cost of unsupplied energy was added to the target in order to strike an optimal balance between the economy and the reliability of electricity system operation. [23] proposed a safe optimal scheduling model of the electricity system considering the demand response of electricity price under the incentive mechanism of the electricity market aiming at the traditional day-ahead scheduling scheme. Based on the peak valley TOU price, the incentive compensation mechanism should be established to encourage users to actively use it. Participating in demand-side resource scheduling, which made the effect of peak load shifting more obvious.
In this section, we propose a reputation-based electricity scheduling scheme for complex network of user electricity consumption. In our scheme, we first construct a complex network model of the user’s electricity consumption, which reflects the relationship and function of each entity in the network. Then in this model, we construct a reputation calculation method for electricity users, and then the users who participate in the incentive demand response of electricity scheduling are selected according to the calculated reputation of users. Further, we use the machine learning method to train a computation model to calculate the adjustment coefficients, and then the electricity scheduling tasks are adjusted based on the calculated adjustment coefficients. Finally, the corresponding electricity scheduling tasks are assigned to the selected electricity users respectively for realizing electricity peak load shifting.
In this section, we show a system framework of user electricity scheduling, which consists of users, user areas (aggregators) and grid company. In our framework, Due to the interconnection of various entities and various interrelationships, the whole power grid system can be regarded as a complex network. In Section 3.2, we introduce the construction of a complex network model for user electricity consumption in detail, which demonstrates the distribution of individual entities in the system and the relationships between individual entities, such as users, aggregators and grid companies.
In the system, various entities cooperate with each other to realize the electricity scheduling. Among them, the electricity data of users is the basis of the whole scheduling scheme. At the same time, the realization of scheduling task also needs the cooperation of electricity users. Due to the big size of the power grid system, interacting directly with area users through the power grid side will incur relatively large resource consumption. Aggregator plays the role of an intermediate agent in the system, the electricity data of users are aggregated and sent to the power grid side through the aggregator. The tasks assigned by the users and the incentives obtained by the users for completing the scheduling tasks are also distributed to the electricity users in the region through the aggregator. Power grid company is the initiator of the data processing center and scheduling tasks. Due to the emergence of the peak will increase power grid company of power circuit operations costs, even cause damage to the power circuit, so the grid company interacts with the user response by publishing power scheduling task to users. In order to mobilize users to complete the scheduling task, the grid side distributes the corresponding subsidies for the users who complete the scheduling task. The framework is shown in Figure 2. The functions of each entity are summarized as follows.
• Users: The users are the object that participate in the incentive demand response. By responding to the task assigned by the power grid, the users can assist the power grid to complete the scheduling tasks. Meanwhile, the users can also obtain the corresponding price subsidies through their own reputation values and the scheduling tasks completed by users.
• User areas (Aggregators): Each area will firstly collect the electricity consumption data of the users in the area, send data to the server, and accept the scheduling tasks assigned by the power grid company for the area. Then the aggregators will assign the corresponding scheduling tasks to users according to the reputation values and adjustable load of users.
• Grid company: The server of grid company calculates the adjustable load of users after receiving the user electricity consumption data sent by various aggregators. In this paper we assume that electricity consumption directly interacts with users, and the reputation value of each user is stored in the server. By calculating the adjustable load of users and the weight of the reputation values of users, the corresponding scheduling tasks are assigned to users.
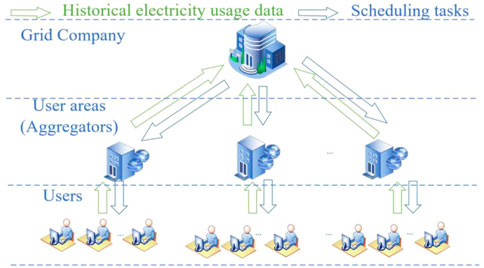
FIGURE 2. System framework.
Because the load control of power grid users in different areas is a complex network system, the current user load control method is not accurate and effective for electricity consumption. Based on the above system framework, we further model the complex network of user load regulation. Since the users in each region have different habits of using electricity, the task allocation for the users in each region is different, even though the users’ electricity consumption data at the same time is the same. Therefore, groups of electricity users are typically complex systems. We regard a single user in each region as a node, and each node will be linked to the aggregation server in each region, where the aggregation server is the intermediate node. When the node interacts with the intermediate node, that is, when the user participates in the incentive demand response, the user’s reputation value will change with the completion of the scheduling task. Therefore, the weight of the connection between this node and the intermediate node is increased, and the user’s reputation value is taken as the weight. Similarly, the aggregation servers in each region and the grid company’s servers can be represented by the network relationship described above. For the convenience of the experiment, in this paper we assume that the power grid directly interacts with users in a certain area. In actual application, aggregators are still used to complete the overall implementation of this scheme. The complex network model of user electricity consumption is shown in Figure 3.
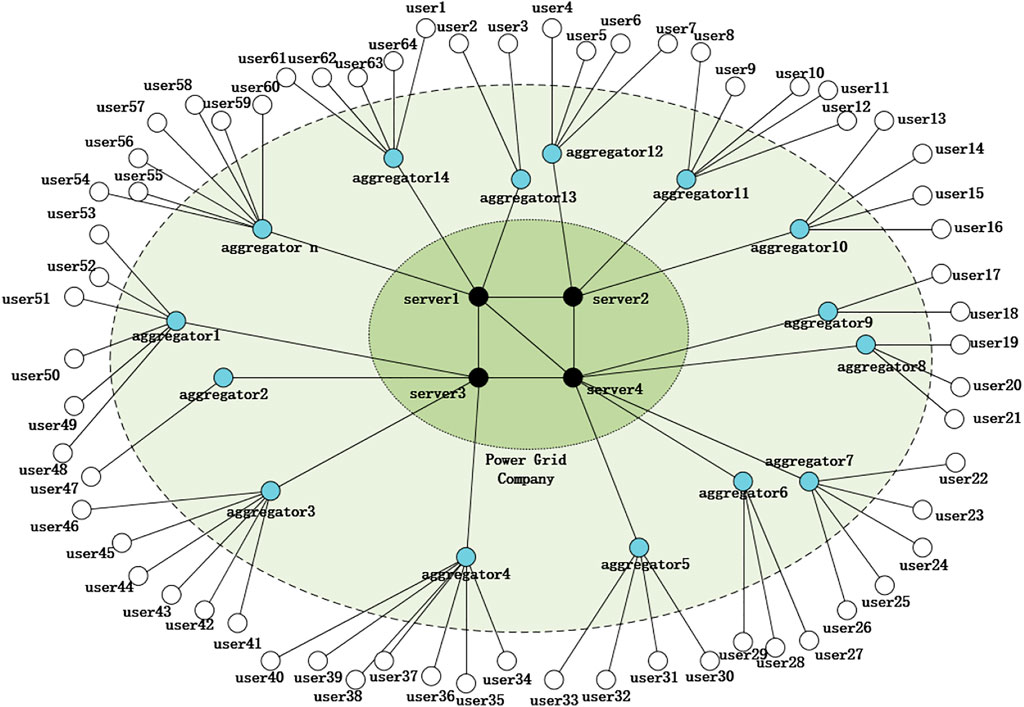
FIGURE 3. Complex network model of user electricity consumption.
In this section, we show the details of our electricity scheduling scheme for the complex network of user electricity consumption in the model. In our scheme, for users in a certain area, their real-time adjustable loads are calculated based on the users’ historical electricity consumption data and real-time electricity consumption data. It is convenient for users that they don’t need to upload their adjustable load before participating in incentive demand response every time. Assigning corresponding scheduling tasks to users based on the users’ reputation values is conducive to improve the reliability of users participating in completing scheduling tasks. While the power grid allocates scheduling tasks to users participating in incentive demand response by combining users’ reputation values with real-time adjustable load of users. We firstly outline the five steps of this scheme, and then introduce the implementation details of each step. The process of implementation of this scheme is shown in Figure 4.
• Initialization: The server of grid company receives the data of users. Subsequently, the power grid company adjusts coefficient s according to total load scheduling announced price subsidies;
• Calculation of Reputation Values: The server calculates the reputation values of users based on the number of times that users accept their scheduling tasks and the number of times they complete their scheduling tasks;
• Filtering of Participating Users: According to the users’ historical electricity consumption data and real-time electricity consumption data, the users’ load elasticity coefficients and adjustable load coefficients are calculated respectively. These coefficients are used as reference for filtering of users;
• Assignment of Tasks: The server sends incentive demand response request to filter users, users can choose whether to participate in the incentive demand response. Then the server assigns the scheduling tasks to the users who finally participate in the incentive demand response according to the users’ reputation values and real-time adjustable load;
• Calculation of Price Subsidies: The server assigns corresponding subsidies to users based on the reduced load and the reputation values of users who completed the scheduling tasks.
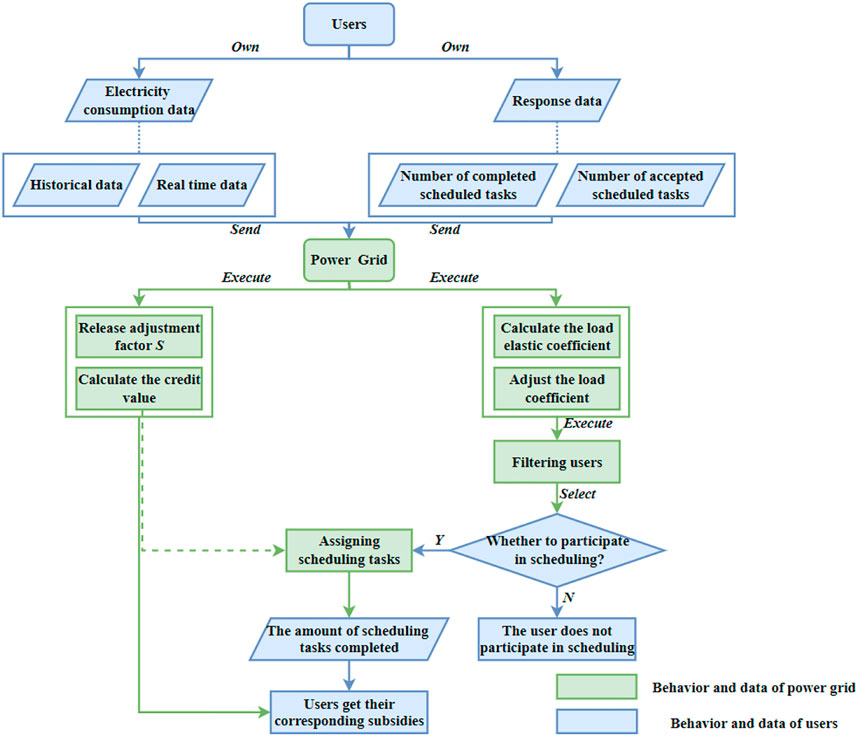
FIGURE 4. The process of user electricity scheduling.
The historical data of electricity consumption of users are stored in the grid company. The server can directly obtain the historical data of users and the situation of users’ participation in incentive demand response and completion of scheduling tasks. However, the power grid company does not have the data of the users’ adjustable load, so the users need to upload the real-time adjustable load
Where
In this section, we propose a method to calculate the reputation values of users. The reputation value is a measurement that reflects the reliability of the users to complete their scheduling tasks. It is calculated by the number of scheduling tasks completed by users and the number of scheduling tasks accepted by users in the scheduling task assigned by the server. Besides, the reputation values of users will be used as the reference for users to obtain the price subsidies after completing their scheduling tasks. However, the reputation value of the users participating in scheduling task in the first time cannot be calculated, so we need to initialize the credit value of the users who have not participated in the scheduling task to ensure the amount of scheduling tasks for users who participate in the scheduling task for the first time. We set the reputation value of the users who participate in the scheduling task for the first time as 0.5.
The calculation process of reputation value is as follows. Firstly, users upload their data to the server, and then the users’ reputation values are calculated according to the incentive demand response data of users. The user’s reputation value is:
where
In this section, we show how users are assigned related electricity scheduling tasks. Due to some users have no adjustable load at a certain period, users involved in the scheduling task need to be filtered. We define the load used by the user in a certain period as follows: There are 60 min in each hour. We take the maximum load value generated by the power user per minute as the load within 1 minute, and the load within each hour is the average of the load within 60 min during that period. Then based on the historical and real-time electricity consumption data of users, users are selected to participate in scheduling. We use a two-layer scheme to select participating users. Firstly, the load elasticity coefficient is calculated according to the users’ historical data, and the users whose load elasticity coefficient meeting the requirements are selected preliminarily. Then, users meeting the requirements are further filtered according to the real-time electricity load of users, and the process of users filtering is shown in Figure 5.
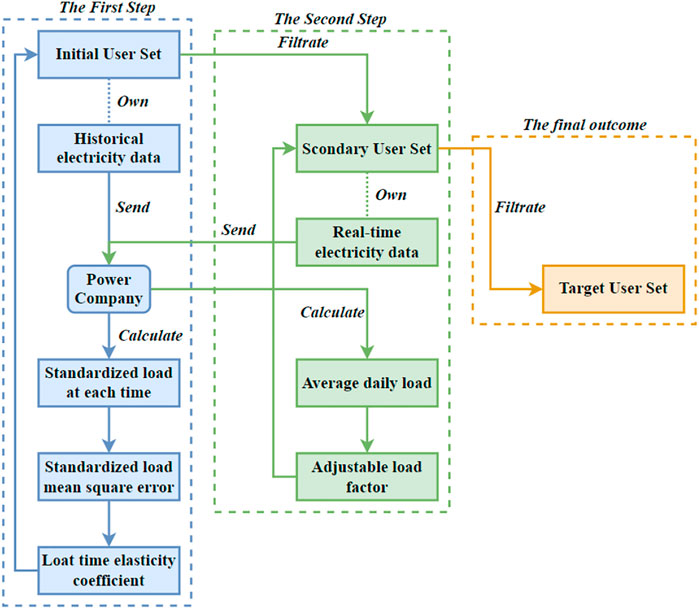
FIGURE 5. Selection frame of participating users.
First of all, the user set meeting the requirements of this scheduling task is preliminarily obtained by processing the users’ electricity usage habits and historical data of electricity consumption. In this scheme, each week is divided into 7 days as a cycle. In each cycle, the electricity consumption of user
Where w represents the statistical period number and it is a natural number greater than or equal to 1. d represents the number of dates within a period and d = 1,2,3, …, 7. t represents t periods of day and t = 0,1,2, …, 23.
In order to analyze the data better, we initially process the data. Firstly, after standardizing the load in each period for user
Where
Firstly, the server calculates the mean square deviation of the standardized load of user on a certain day according to the mean square deviation of the standardized load:
Secondly, according to the mean square deviation of the user’s average standardized load, the user’s load elastic coefficient on that day is obtained:
Then, the server selects the user whose load elastic coefficient is greater than the threshold as the candidate.
Users need to be filtered more accurately after the first layer of filtering for them. According to the user’s real-time electricity load, the real-time adjustable load coefficient is obtained:
where
In this section, we describe how to perform the task assignment in detail. After the server selects the users who meet the requirements, it sends to them an invitation message to participate in the incentive demand response. The users can choose whether to participate in the response or not, and then the server assigns tasks to the users who finally participate in the incentive demand response. Reasonable allocation of scheduling tasks is conducive to solving the problem of electricity consumption in the grid company. The details of the task assignment are as follows:
Firstly, users participating in the response are selected by server according to the period when the power grid publishes scheduling tasks, the reputation values of users and the adjustable load coefficients of users. Then the users choose whether to participate in the incentive demand response. The users with a high reputation value are assigned more scheduling tasks. Finally, the user set
To select high-quality users, users’ adjustable load needs to be ensured. The user’s adjustable load is calculated according to the user’s real-time adjustable load coefficient and the user’s real-time electricity load:
Where the
To determine the parameter
The optimal parameters of the model are obtained by minimizing the objective function through the gradient descent algorithm. Since the parameters of each period are different, we need to train the models for 24 periods. After that, the real-time electricity load of the user and the period are taken as the input of the model to obtain the parameters
After the server calculates the users’ adjustable load, it assigns the corresponding tasks to users according to the users’ reputation values. But the scheduling task should not exceed the range of the user’s adjustable load. Otherwise, most users may fail to complete their scheduling tasks. The following is a detailed description of our task allocation scheme. First of all, according to the users’ reputation values, the server calculates the reputation weight of all users in the
Where
If
If
In this section, we propose a method to calculate the incentive. In order to mobilize the enthusiasm of users to participate in incentive demand response, we need to give certain subsidies to users who have completed scheduling tasks. In this way, users will be more willing to receive scheduling tasks, and help the grid company to achieve peak load shifting and other scheduling tasks. In our scheme, users’ corresponding subsidies are generated according to their reputation values and the values of the scheduled load completed by users. The incentive obtained by the user is directly proportional to the user’s reputation value and the scheduling task completed by the user. If users receive and complete the scheduling task, their reputation values will increase. If users receive a task, but they don't complete it, then their reputation values will decrease. If users don't receive the scheduling task, their reputation values remain unchanged. The users’ original reputation value before updating are used as the basis to calculate the subsidies for the completion of the scheduling task. We divide the reputation value levels into ten levels, from 1 to 10 respectively. The users’ reputation ratings are rounded up to their reputation values, denoted as
where
In this section, the experimental process and results are introduced in detail. The experimental part of this paper is described below. Due to the difficulty in obtaining power grid data and the innovation of the method adopted in this paper, the data set adopted in this experiment is generated based on our daily consumption habits. And then we reasonably generate the data of electricity load of 50 users for 24 h a day within 5 weeks, as well as the times of each user accepting and completing scheduling tasks, so as to obtain the reputation values of each user. In this paper, every week is taken as a cycle, and the electricity consumption of users is different every day in each cycle. Therefore, in the experiment, a certain period from Monday to Sunday should be selected as the target regulation period, and the total regulation load should be input. Then, we calculate the parameter
In this section, we show the calculation results of the parameter. The server uses the electricity data of every moment in one specified day provided by users and adjustable load for the users each moment to combine the adjustable load coefficients calculated at this moment. And the server takes the users’ adjustable load coefficients, real-time electricity loads, real-time adjustable load and parameter
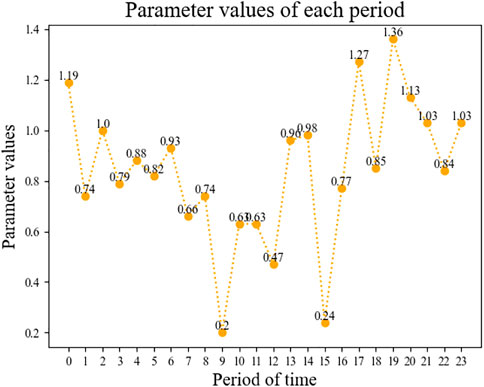
FIGURE 6. Values of
In this section, we show the influence of load elasticity coefficient threshold and reputation threshold on scheduling task allocation and the incentives users can get. The assignment of users’ scheduling tasks is a relatively important link in this scheme. The price subsidies obtained by users participating in incentive demand response are not only related to their own electricity consumption data, but also related to some parameters selected at the grid company side, such as load elastic coefficient threshold and reputation value threshold. The load elasticity coefficient threshold and reputation value threshold are determined according to the range of load elasticity coefficient and reputation value. Because the load elasticity coefficient is small, the load elasticity coefficient threshold is the amplified value for the sake of observation. In practical application, the most appropriate threshold is selected by the grid end to screen users and assign scheduling tasks.
In this section, we discuss the impact of the load elastic coefficient threshold on the scheme performance. After the daily load elastic coefficient within a cycle is calculated according to the historical electricity consumption data of the user, the daily load elastic coefficient of the user compares with the threshold value. The users, whose load elastic coefficient is larger than the threshold value, are preliminarily selected. The selection of different load elastic coefficients will affect the selection of users participating in scheduling tasks. Thus, different scheduling tasks are assigned to users, and the price subsidies users get after completing the scheduling tasks are different. The adjustable load coefficient of the user is obtained through multiple calculations based on the historical electricity consumption data and real-time electricity consumption data of each user. The parameters
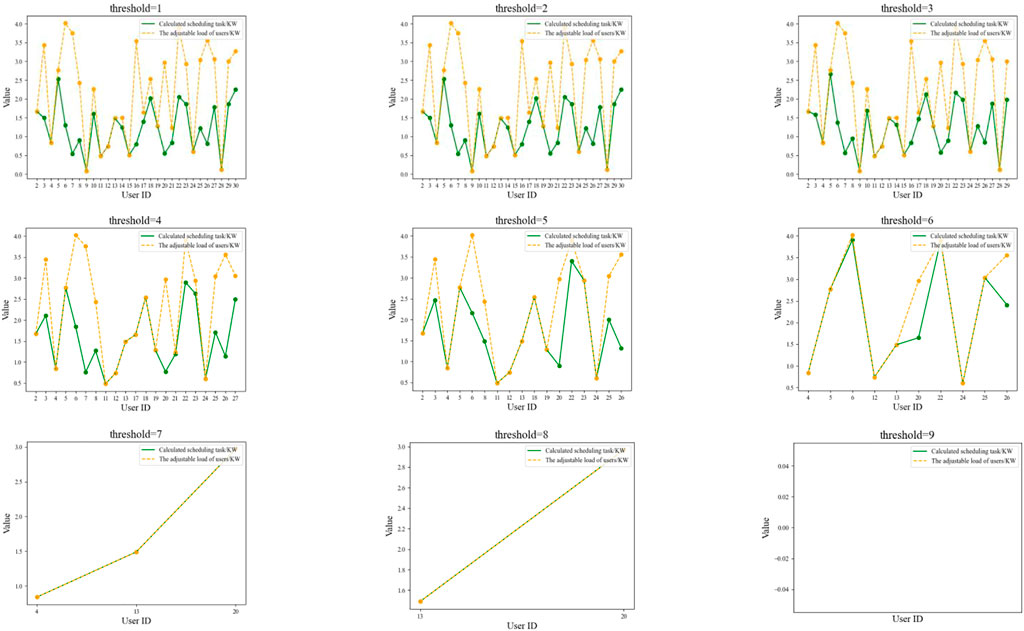
FIGURE 7. Comparison between scheduling tasks and adjustable load of users with different load elastic coefficient threshold (
As can be seen from Figure 7, the load elastic coefficient threshold should not be too large or too small. If the threshold of load elasticity coefficient is too small, many low-quality users will also be selected. Although more users are selected to participate in scheduling tasks, the quality of users participating in scheduling tasks is not high, which will affect the completion of the overall tasks of power grid scheduling. When the load elastic coefficient threshold is too large, users participating in scheduling tasks are over-filtered. When the load elastic coefficient threshold is equal to 9, no users even meet the requirement to participate in scheduling tasks. In the selection of the final scheduling tasks of users, if the values of the calculated scheduling task assigned to the user is smaller than the adjustable load of the user, the calculated scheduling tasks are selected as the final scheduling tasks. If not, the user’s adjustable load is selected as the final scheduling task. The load elastic coefficient threshold will also affect the subsidies obtained by users when they complete scheduling tasks by affecting the assignment of their scheduling task. Figure 8 shows the change of subsidies obtained by users when the load elastic coefficient threshold is different.
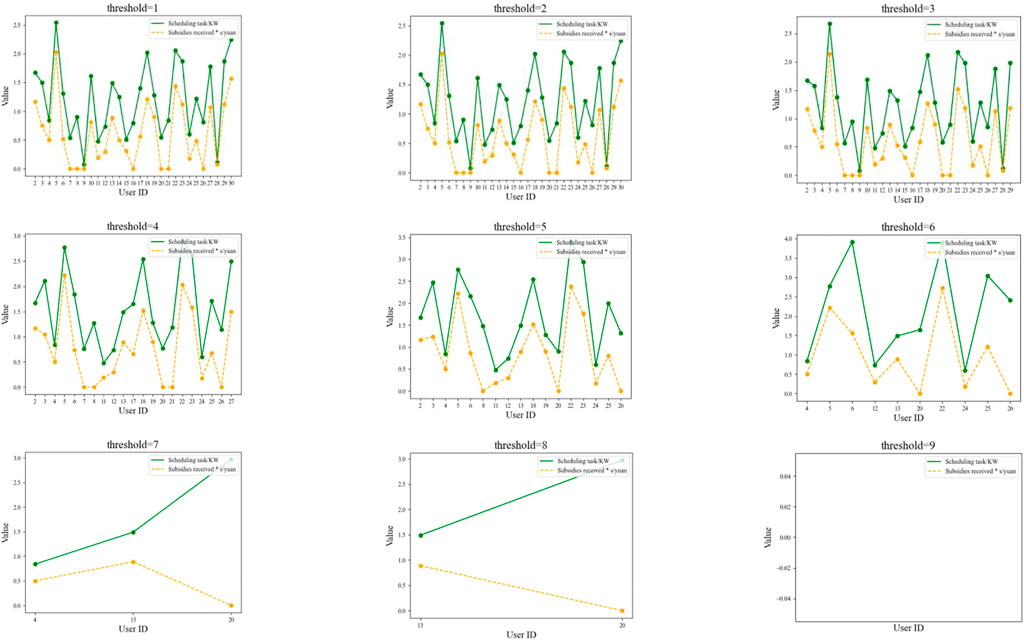
FIGURE 8. Changes of users’ scheduling tasks and subsidies with different load elastic coefficient threshold (
As we can see from Figure 8, the number of users participating in scheduling tasks changes with the change of the load elastic coefficient threshold. When the load elastic coefficient threshold is small, the number of users participating in scheduling tasks is large, and the average scheduling tasks assigned to users are small, so the subsidies obtained by users also decrease. In this case, although there are more users participating in scheduling tasks, there are more users who are not highly likely to complete scheduling tasks. Because the load elastic coefficient is small while the time limit of participating in scheduling tasks is large, then the complete degree of overall scheduling tasks may be low. As the load elastic coefficient threshold increases, the number of users participating in scheduling tasks also decreases. Accordingly, users participating in scheduling tasks are assigned more scheduling tasks and get more price subsidies. However, due to the limitation of users’ adjustable load, the scheduling tasks that users can complete will not exceed their adjustable load. Therefore, too few people participating in the overall scheduling task will lead to a low completion degree of the overall scheduling task. Therefore, the threshold of load elastic coefficient should not be too small or too large.
In this section, we discuss the impact of the reputation threshold on the scheme performance. Firstly, the server calculates the weight of the users participating in this scheduling task among all participating users based on their reputation values. And the server considers them as the weight of the scheduling tasks assigned to users in the total scheduling tasks. Then, the server compares the user’s adjustable load with the scheduling tasks assigned to the user. If the scheduling task of the user is smaller than the adjustable load, the scheduling task is taken as the final scheduling value. Otherwise, the calculated adjustable load of the user is taken as the final scheduling value. After completing the scheduling task, users will get the corresponding subsidies according to their reputation levels and the size of the scheduling tasks completed by users, but the users whose reputation value is less than the reputation value threshold will not get the price subsidies. The difference of the reputation value threshold will affect the users who participate in the incentive demand response to get their subsidies. Figure 9 shows the differences of the users’ subsidies under different reputation value thresholds.

FIGURE 9. Differences of subsidies obtained by users under different reputation thresholds (
As can be seen from Figure 9, when the reputation threshold increases, the number of users who can get price subsidies decreases. When the reputation threshold reaches nine, no user can get price subsidies. If the reputation threshold is too large, it will reduce the enthusiasm of users to participate in scheduling tasks. If the reputation threshold is too small, it will increase the cost of the power grid. Because users with small reputation value are less likely to complete scheduling tasks, it is necessary to set an appropriate reputation threshold, and users with low reputation can get subsidies after reaching the threshold. Then the enthusiasm of low-reputation users to complete their scheduling tasks can be improved.
To solve the issues of user electricity consumption in complex network, we propose a reputation-based electricity scheduling scheme for complex network of user electricity consumption in this paper. We first construct a complex network model of the user’s electricity consumption. Then we construct a reputation calculation method for electricity users, and then we use the machine learning method to train a computation model to calculate the adjustment coefficients of electricity load, which is the basis for adjusting the electricity scheduling tasks. Further, the corresponding electricity scheduling tasks are assigned to the selected electricity users respectively for realize electricity peak load shifting when the total electricity load is too high. Finally, the incentives of users who participate in the incentive demand response of electricity scheduling are calculated according to the calculated reputation and the completed scheduling tasks of users. Experiment results show our scheme can effectively calculate the reputation values of users based on their historical data, and the corresponding electricity scheduling tasks are effectively and efficiently assigned to related users according to the users’ reputation values and the real-time adjustable load.
The raw data supporting the conclusion of this article will be made available by the authors, without undue reservation.
WT, XL, YZ, and MZ contributed to conception and design of the study. ZW organized the database. YZ and JW performed the statistical analysis. WT wrote the first draft of the manuscript. XL, YZ, MZ, and JW wrote sections of the manuscript. All authors contributed to manuscript revision, read, and approved the submitted version.
WT, YZ, ZW, and JW were employed by Shenzhen Power Supply Bureau Co., Ltd.
The remaining authors declare that the research was conducted in the absence of any commercial or financial relationships that could be construed as a potential conflict of interest.
All claims expressed in this article are solely those of the authors and do not necessarily represent those of their affiliated organizations, or those of the publisher, the editors and the reviewers. Any product that may be evaluated in this article, or claim that may be made by its manufacturer, is not guaranteed or endorsed by the publisher.
1. Zheng R, Li Z, Tang Y, Ni C-Y, Li G, Han B. Incentive demand response model and evaluation considering the uncertainty of resident user participation [J]. Automation Electric Power Syst (2022) 46(08):154–62. doi:10.7500/AEPS20210404001
2. Zhenbo W, Zhang H, Pingeucalyptus W, Zheng L, Ma X, Sun Z. Considering dynamic incentive model two phase micro power grid operation optimization of demand response [J]. Power Syst Prot Control (2021) 49(19):1–10. doi:10.19783/j.carolcarrollnkiPSPC.201605
3. Nasiruzzaman ABM, Pota HR. Transient stability assessment of smart power system using complex networks framework. In: 2011 IEEE Power and Energy Society General Meeting; 24-28 July 2011; Detroit, MI, USA (2011). p. 1–7. doi:10.1109/PES.2011.6038970
4. Liu B, Li Z, Chen X, Huang Y, Liu X. Recognition and vulnerability analysis of key nodes in power grid based on complex network centrality. IEEE Trans Circuits Syst Express Briefs (2018) 65(3):346–50. doi:10.1109/TCSII.2017.2705482
5. Wang Z, Hill DJ, Chen G, Dong ZY. Power system cascading risk assessment based on complex network theory. Physica A: Stat Mech its Appl (2017) 482:532–43. doi:10.1016/j.physa.2017.04.031
6. Wu Y, Liu J, Li F, Yan Z, Zhang L. Network model of bilateral power markets based on complex networks. Int J Mod Phys B (2014) 28(22):1450144. doi:10.1142/s0217979214501446
7. Papadopoulos V, Knockaert J, Develder C, Desmet J. Peak shaving through battery storage for low-voltage enterprises with peak demand pricing. Energies (2020) 13:1183. doi:10.3390/en13051183
8. Uddin M, Romlie MF, Abdullah MF, Tan C, Shafiullah GM, Bakar AHA. A novel peak shaving algorithm for islanded microgrid using battery energy storage system. Energy (2020) 196:117084. ISSN0360-5442. doi:10.1016/j.energy.2020.11784
9. Guo W, Liu D, Liu M, Zhang H, Wang G, Fan B, et al. Demand-side resource response characteristics and peak shaving scheduling response model. EnergyReports, (2022) 8(6):586–93. doi:10.1016/j.egyr.2022.03.149
10. He S, Gao H, Liu J, Zhang X, Chen Z. Distribution system planning considering peak shaving of energy station. Appl Energ (2022) 312:118692. ISSN 0306-2619. doi:10.1016/j.apenergy.2022.118692
11. Rana MM, Romlie MF, Abdullah MF, Uddin M, Sarkar MR. A novel peak load shaving algorithm for isolated microgrid using hybrid PV-BESS system. Energy (2021) 234:121157. ISSN0360-5442. doi:10.1016/j.energy.2021.121157
12. Jin H, Qin L, Qian C, Wang Y, Wang L. Discussion on demand side response technology in smart grid [J]. Beijing,China: Electricity Technology Edition (2011). 17–22.
13. Dong C, Ng CT, Cheng TCE. Electricity time-of-use tariff with stochastic demand. Prod Oper Manag (2017) 26:64–79. doi:10.1111/poms.12610
14. Yang H, Wang L, Zhang Y, Tai HM, Ma Y, Zhou M. Reliability evaluation of power system considering time of use electricity pricing. IEEE Trans Power Syst (2019) 34(3):1991–2002. doi:10.1109/TPWRS.2018.2879953
15. Yang P, Tang G, Nehorai A. A game-theoretic approach for optimal time-of-use electricity pricing. IEEE Trans Power Syst (2013) 28(2):884–92. doi:10.1109/TPWRS.2012.2207134
16. Lin J, Sheng M, Wang L, Li Y, Zeng M, Zhang X. Research on incentive subsidy mechanism of demand response based on system dynamics. In: 2021 IEEE 5th Conference on Energy Internet and Energy System Integration (EI2); 22-24 October 2021; Taiyuan, China (2021). p. 2027–31. doi:10.1109/EI252483.2021.9712902
17. Wu Y, Li H. Additive model for user electricity consumption behavior analysis. In: 2019 IEEE 4th Advanced Information Technology, Electronic and Automation Control Conference (IAEAC); 20-22 December 2019; Chengdu, China (2019). p. 1703–7. doi:10.1109/IAEAC47372.2019.8997882
18. Wang Y, Chen Z, Xu Z, Gang G, Lu J. User electricity consumption pattern optimal clustering method for smart gird. In: 2018 14th IEEE International Conference on Signal Processing (ICSP); 12-16 August 2018; Beijing, China (2018). p. 567–70. doi:10.1109/ICSP.2018.8652346
19. Zhao Z, Wang J, Liu Y. User electricity behavior analysis based on K-means plus clustering algorithm. In: 2017 International Conference on Computer Technology, Electronics and Communication (ICCTEC); 19-21 December 2017; Dalian, China (2017). p. 484–7. doi:10.1109/ICCTEC.2017.00111
20. Cheng Q, Min C, Ciwei G, Huixing L, Tugang S. Research on the analysis of user's electricity behavior and the application of demand response based on global energy interconnection. In: 2016 China International Conference on Electricity Distribution (CICED); 10-13 August 2016; Xi'an, China (2016). p. 1–7. doi:10.1109/CICED.2016.7576206
21. Chen H, Xiong N, Zhang H, Wang W, Chen J. Demand response potential measurement based on adjustable load scale. In: 2021 IEEE 5th Conference on Energy Internet and Energy System Integration (EI2); 22-24 October 2021; Taiyuan, China (2021). 831–4. doi:10.1109/EI252483.2021.9713011
22. Xu Q, Ding Y, Zheng A. An optimal dispatch model of wind-integrated power system considering demand response and reliability. Sustainability (2017) 9:758. doi:10.3390/su9050758
Keywords: reputation, complex network, electricity consumption, adjustment coefficients, electricity scheduling
Citation: Tang W, Lin X, Zhao Y, Zhou M, Wang Z, Xiao Y and Wang J (2023) Reputation-based electricity scheduling scheme for complex network of user electricity consumption. Front. Phys. 11:1183419. doi: 10.3389/fphy.2023.1183419
Received: 10 March 2023; Accepted: 10 April 2023;
Published: 25 April 2023.
Edited by:
Fei Yu, Changsha University of Science and Technology, ChinaReviewed by:
Gege Yang, Beijing Information Science and Technology University, ChinaCopyright © 2023 Tang, Lin, Zhao, Zhou, Wang, Xiao and Wang. This is an open-access article distributed under the terms of the Creative Commons Attribution License (CC BY). The use, distribution or reproduction in other forums is permitted, provided the original author(s) and the copyright owner(s) are credited and that the original publication in this journal is cited, in accordance with accepted academic practice. No use, distribution or reproduction is permitted which does not comply with these terms.
*Correspondence: Xiaoming Lin, NDExODMzMjE0QHFxLmNvbQ==
Disclaimer: All claims expressed in this article are solely those of the authors and do not necessarily represent those of their affiliated organizations, or those of the publisher, the editors and the reviewers. Any product that may be evaluated in this article or claim that may be made by its manufacturer is not guaranteed or endorsed by the publisher.
Research integrity at Frontiers
Learn more about the work of our research integrity team to safeguard the quality of each article we publish.