- 1School of Civil Engineering, Chongqing University, Chongqing, China
- 2Department of Civil and Environmental Engineering, The Hong Kong University of Science and Technology, Kowloon, Hong Kong SAR, China
Inclined prismatic structures have grown in popularity in civil engineering due to increased architectural and aesthetic demands, leading to a surging need to study their aerodynamic properties. In this study, an inclined square prism was examined using wind tunnel tests and numerical simulations with an aspect ratio of 6.25:1. The Synchronous Multi-Pressure Sensing System (SMPSS) wind tunnel technique was used to evaluate the aerodynamic characteristics of the structure, including surface pressure distribution, local force spectra, force coefficient, coherence, and the Strouhal number. Moreover, the numerical Large-eddies simulation (LES) were also deployed to investigate the flow field morphology around the structure. Results show that the orientation, direction, and angle of inclination direction significantly affect the prism’s aerodynamic characteristics. Several flow field phenomena were also revealed. Forward inclination enhances the downwash flow, whereas the backward counterpart enhances the upwash flow, and transverse inclination produces a noticeable modification in the vortex morphology near the prism base. These findings can inform structural design and contaminant dispersion efforts.
1 Introduction
With the continuous global advancement of economic development, a multitude of high-quality buildings have arisen, among them being inclined square prism structures. The aerodynamic properties and flow surrounding these inclined building structures are particularly responsive to changes in cross-sectional geometry and boundary conditions. Consequently, researching wind resistance performance has become of paramount importance [1, 2, 3].
The examination of the aerodynamic traits of single cylinders or prisms is fundamental, and in recent years, numerous scholars have conducted research in this field. Gu and Quan [4] investigated the changes in crosswind loads on structures by utilizing the High-frequency Force Balance (HFFB) technique. The investigation considered different wind field categories and the influence of section shapes. The findings indicated that structural crosswind loads are induced by the interaction between the incoming flow and the wake structure, with a complex underlying mechanism. Tanaka et al. [5] investigated the aerodynamic loads on spiral and conical structures using SMPSS and HFFB techniques. The experimental data were analyzed for various aerodynamic parameters, such as wind pressure coefficient, power spectrum density (PSD) of across-wind overturning moment coefficients, Strouhal number, and force coefficient. These findings serve as a foundation for a comprehensive understanding of the aerodynamic characteristics of diverse structural configurations. Carassale et al. [6] explored the effects of wind angle and cross-sectional shape on the aerodynamic properties of rectangular section buildings through wind tunnel tests. The test results improve the understanding of the aerodynamic properties of unconventional constructional building models. Hu et al. [7] investigated the aerodynamic characteristics of an inclined square prism with an 18:1 aspect ratio through wind tunnel experiments, revealing that forward and backward inclination affect pressure distribution and vortex shedding frequency. Chen et al. [8] determined the aerodynamic damping of a slender structure tilted forward and backward through a series of forced vibration wind tunnel tests. The experimental results show that increasing the angle of forward inclination will reduce the aerodynamic damping of the prism, and the aerodynamic damping is favorable for large forward inclination angles; while the aerodynamic damping first decreases and then increases with the angle of backward inclination. Hui et al. [9] conducted a study utilizing SMPSS technology to investigate the impact of various facade attachments on the aerodynamic force of high-rise buildings with vertical rectangular sections. The study analyzed several parameters, including average, fluctuating base moment, power spectrum, and coherence. The findings indicate that an appropriate facade form can aid in organizing airflow and reducing aerodynamic load. Chen, Huang, et al. [10] utilized the hybrid aeroelastic-pressure balance (HAPB) testing technique to compare the aerodynamic forces on a slender prism among the aeroelastic model, forced vibration model, and rigid model. The findings demonstrate that the responses predicted by the aerodynamic forces on the aeroelastic model are in close concurrence with the experimental outcomes, whereas significant inconsistencies are detected in both the forced vibration and rigid models. Chen et al. [1] analyzed the wind pressure distributions and unsteady force coefficients on the tapered model. The results demonstrated that the root mean square lift coefficient increases significantly with amplitudes of oscillation at low wind speeds, while at high wind speeds, the influence of structural oscillation is significantly reduced and the aerodynamic force is in a quasi-static state.
The aerodynamic characteristics of a structure can be explained to some extent by the changes in the flow field around it. Regarding the study of the flow field around a single cylinder, significant progress has been made with the development of computers, leading to numerous achievements. Li et al. [11] utilized the Dynamic Mode Decomposition (DMD) technique in their research on a prototypical wind engineering problem of flow past a square prism. The findings demonstrated that, in reconstructing the original pressure field obtained by Large-eddies simulation (LES), a full-order DMD model achieves exceptional accuracy within 0.1% mean error. Subsequently, Li et al. [12] introduced a novel data-driven formulation, the Koopman-Linearly Time-Invariant (Koopman-LTI) analysis, with the purpose of establishing direct constitutive relations between the phenomenology of fluid and structure. The findings demonstrated that, in the presence of random and anisotropic turbulence, the Koopman-LTI produced frequency-wise identical modes for the response of the structure and the excitation of the fluid. Chen et al. [13] proposed a method that utilizes ensemble empirical mode decomposition (EEMD) and long short-term memory networks (LSTM) to fill in missing pressure sensor data. The results indicated that EEMD-LSTM outperformed traditional deep learning methods in terms of complementary performance. Furthermore, Li et al. [14] continued to advance the Koopman-LTI architecture, establishing fluid-structure correspondences that investigate fluid-structure interactions (FSIs) from new perspectives. The analysis uncovered the marginal role of z-velocity in convection-dominated free-shear flow, the spectral description of Reynolds stresses for cascading eddies, the sensitivity of wake vortices to dilation and indifference to distortion, and the origin of structure responses in vortex activities. Li et al. [15] conducted a Large Eddy Simulation of a vertical prism at 2.5D using DMD. Their study demonstrated that the steady state provides optimal modal convergence, resulting in DMD output that is independent of the sampling range. Additionally, the researchers found that the initialised state is accurate enough for most system reconstruction tasks. Li, Chen, Tse, et al. [16] conducted a numerical simulation of the flow using dynamic-stress Large-eddies simulation with Near-Wall Resolution. The results showed that the stabilization state was the optimal state for modal convergence, where the output of the Dynamic Mode Decomposition (DMD) becomes independent of the sampling range. The initialization state was also found to provide sufficient accuracy for most system reconstruction tasks. Contrary to popular beliefs, over-sampling was found to cause algorithmic instability. Following this, Li et al. [17, 18] presented a detailed algorithm and theoretical significance of applying Dynamic Mode Decomposition (DMD) for Koopman analysis, indicating the potential of DMD analysis in wind engineering flow field analysis. Chen et al. [19] proposed a new modular framework known as the Deep Neural Network-Genetic Algorithm (DNN-GA) to predict the aerodynamic damping of structures using surface pressure measurements. This represents the first application of reference genetic algorithm in the prediction of aerodynamic damping. Chen, Bai, et al. [20] investigated the flow phenomenology and aerodynamic characteristics of a transversely inclined cantilever prism. Their findings revealed significant deviations from the vertical prism, indicating that many classical observations on the prism wake are not transferable to the inclined cases. Fu et al. [21] devised a data analysis procedure known as the Proper Orthogonal Decomposition-Dynamic Mode Decomposition (POD-DMD) augmented analysis to isolate the most dominant energy- and evolution-wise features of the flow field in a street canyon. The results indicated that the extracted modes could be classified into three distinct types: energetically and dynamically significant modes, energetically significant but dynamically insignificant modes, and energetically insignificant yet dynamically significant modes.
Based on the discoveries of the aforementioned scholars, it is apparent that most investigations are confined to vertical columns, with a considerable number of scholars focusing on cylinders. Although Chen, Bai, et al. [20] and Hu et al. [7] have conducted a study of tilted square columns with an aspect ratio of 18:1 (width D = 5.08 cm and height H = 91.44 cm), it is unclear whether the findings can be extrapolated to other structures with small aspect ratios. This article concentrates on a structural form that is frequently encountered in architecture and employs an aspect ratio of 6.25:1 as an exemplar to scrutinize its aerodynamic characteristics through wind tunnel tests and LES. Section 2 introduces the wind tunnel experiments and experimental models, whereas Section 3 examines the aerodynamic properties of the structure in terms of its surface wind pressure distribution, local force spectra, local force coefficients, coherence, and Strohal number. Large-eddies simulation are carried out for chosen operating conditions to analyze the alteration of the surrounding flow field in Section 4. Finally, Section 5 presents the conclusion.
2 Methodology
2.1 Introduction of wind tunnel experiment
The pressure experiment utilizing the rigid model was executed in the Direct Current Boundary-Layer Wind Tunnel Facility at Chongqing University. The test section measures 15 m (length) x 2.4 m (width) x 1.8 m (height) with a blockage ratio of 2.6%, which is less than the conventional threshold of 5%, avoiding undesired disruptions from the walls and roof to the flow field in the vicinity of the model [22]. The wind profiles and turbulence intensities measured are in accordance with the load specification for Terrain Category B (GB50009-2012). In the target wind field to be simulated, the average wind speed profile follows a power-law distribution with an exponent of 0.15. Notably, the reference point was positioned 1 m ahead of the structure at a height of 600 mm, which corresponds to the height of the experimental square column (refer to Figure 2). The height of the measurement point is represented by z. The normalized velocity is represented by U/Ur, where Ur is the velocity at the reference point. Turbulence intensity is represented by Iu. The mean wind speed was normalized by the corresponding value at the vertical prism top and the Reynolds number at the top reference point is
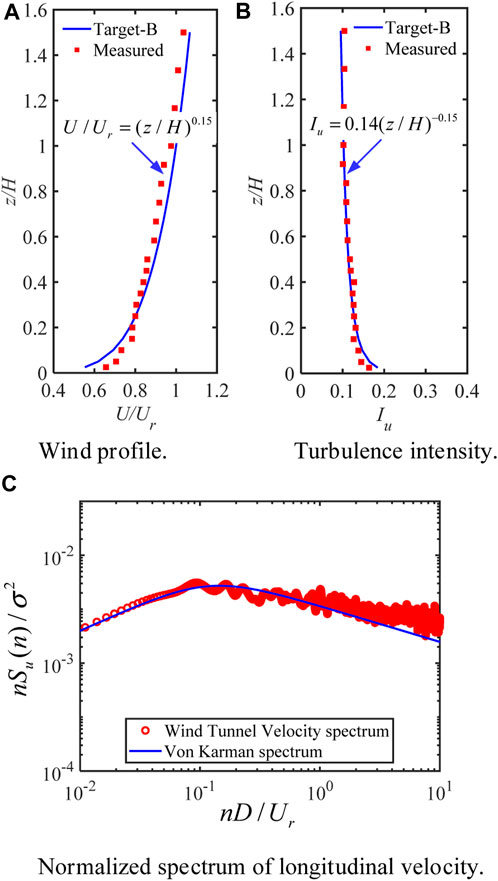
FIGURE 1. Comparison with the terrain category II of code GB50009-2012: (A) Wind profile; (B) Turbulence intensity; (C) Normalized spectrum of longitudinal velocity.
To investigate the aerodynamic properties of an inclined structure, a hollow polymer prism with a square cross-section was constructed with a width of 96 mm (D = 96 mm) and a height of 600 mm (H = 600 mm). The square column was inclined at various angles as specified in Table 1. In subsequent discussions, the side facing the wind is referred to as the near-wind side (as shown in Figure 2A), while the opposite side is the far-wind side. When facing windward, leftward inclination is considered. A static Synchronous Multi-Pressure Sensing System (SMPSS) was employed to collect pressure readings on the rigid model surface. The system consisted of 224 pressure measurement points distributed across 7 levels, with 4 points on each side of every level (refer to Figure 2B for a detailed layout of the measurement points). Figure 2B illustrates the distribution of the measurement points on one side, and the distribution is consistent across all four sides. The equipment used miniature electronic pressure scanning valves (PSI ESP-64) and DTC Initium network electronic pressure scanners to record the pressure data. Each scanning valve could simultaneously collect 64 pressure measurements at a sampling frequency and duration of 330 Hz and 90 s, respectively. The reference point was set at a distance of 1 m in front of the structure and a height of 600 mm, which matched the structure’s height.
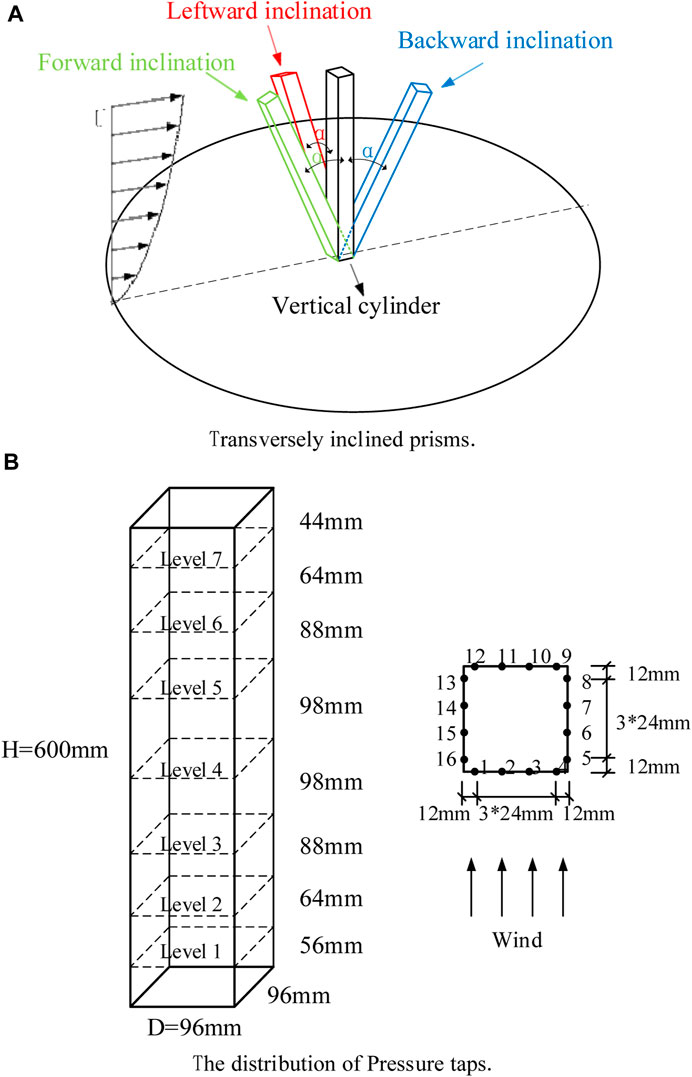
FIGURE 2. Test layout diagram: (A) Transversely inclined prisms; (B) The distribution of pressure taps.
2.2 Introduction of Large-eddies simulation
Large-eddies simulation (LES) is a numerical method proposed by Smagorinsky [23]. Its fundamental idea is to separate large-scale vortices from small-scale vortices using a filtering function. Large-scale vortices are directly simulated while small-scale vortices are closed using a turbulence model. The filtered Navier-Stokes (N-S) equations result in an additional unknown term, namely, the subgrid-scale stress
Where
In this paper, the Dynamic Smagorinsky-Lilly Model is used with a value of
Supplementary Appendix SC presents a comparison of wind profiles and turbulence versus target curves for each operating condition. At the same time, the Reynolds number at the reference point is guaranteed to be consistent with the wind tunnel test. It is evident that the simulated wind field properties are generally consistent with the target wind field, which demonstrates the effectiveness of the NSRFG method for generating inlet turbulence, as well as the reasonableness of the results since the simulated wind field satisfies the research requirements.
Furthermore, the effectiveness of LES simulations was verified using the LESIQ metric. The LESIQ index was adopted to quantify the resonlution of the LES grid. It is an advanced, authoritative method to validate LES, proving the complete resolution of the energy-containing range. For this reason, RANS-based grid convergence can be sared. Celik et al. [26] proposed the LESIQ index as:
where,
3 Result of wind tunnel tests
3.1 Mean pressure distribution on the prism face
Mean pressure coefficients (
where
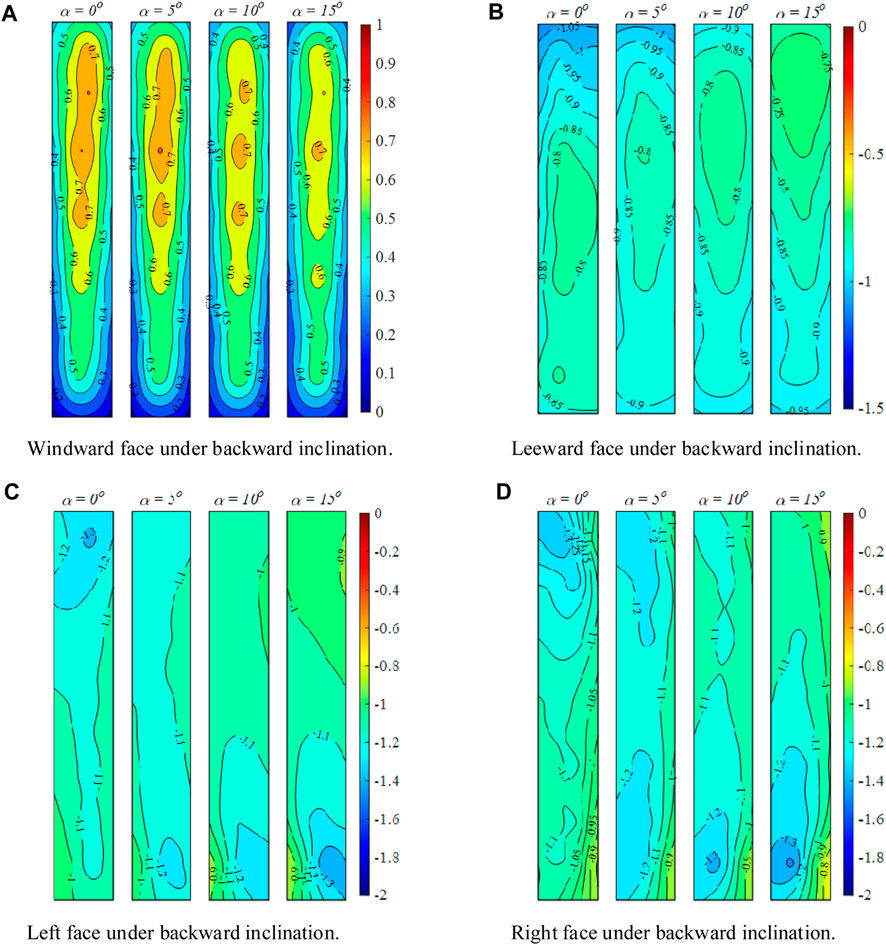
FIGURE 3. Pressure coefficients at different inclinations under backward inclined condition: (A) Windward face; (B) Leeward face; (C) Left face; (D) Right face.
Comparing the wind pressure distribution contour on the windward side at different inclination angles under the backward tilt condition (Figure 3A), it is obvious that with the increase of the angle of backward inclination, the stagnation region gradually moves down and the stagnation region gradually shrinks. The velocity of the wind at the stagnation point is zero and the pressure is at its maximum. As shown in the streamline diagram in Figure 13A in Section 4.1, when the angle of inclination is tilted backwards, the stagnation point is located at a lower position compared to when the angle is vertical. Therefore, the center position of the stagnation region will decrease as the angle of inclination tilts backwards. Additionally, the maximum value of wind pressure coefficient on the windward surface decreases slowly. In Figure 3B, the wind pressure distribution contour on the leeward side under the backward-inclined condition shows that the height of the center of the near two-dimensional region behind the mid-span is gradually shifting upwards. Moreover, the suction at the free end is slowly decreasing. In Figure 13A of Section 4.1, it can be observed that the top vortex has clearly shifted backward, and the curvature of the shear layer has decreased. It is precisely this change in the top vortex that leads to a weakening of the suction force at the free end. As for the backward-inclined structure’s side face, increasing the backward angle leads to a decrease in the suction at the free-end, while simultaneously creating a negative pressure zone at the bottom, which gradually expands as the backward angle increases. This is due to an increase in the angle of backward inclination, which enhances the bottom horseshoe vortex (as shown in Figure 14 of Section 4.2), leading to this phenomenon at the base.
In the case of a forward-inclined column, as the inclination angle increases, a gradual upward shift of the stagnation region on the windward side can be observed, accompanied by an increase in the average pressure coefficient (Figure 4A). Based on the streamline diagram in Figure 13B of Section 4.1, the stagnation point is positioned higher compared to the vertical orientation when tilted forward. Consequently, the center position of the stagnation region will increase as the angle of forward inclination increases. Conversely, on the leeward side (Figure 4B), the height of the near two-dimensional region center shifts downward as the inclination angle increases. At the free end, there is very high suction, which increases further with the inclination angle, and the region expands due to the enhancement of the vortex pairs. For the left and right faces, the pressure distribution near the free end is somewhat similar to that at the bottom of the backward-inclined faces in the above section. This type of pressure distribution, where the low-pressure region is followed by relatively high pressure, is referred to by [29] as a reattachment type pressure distribution.
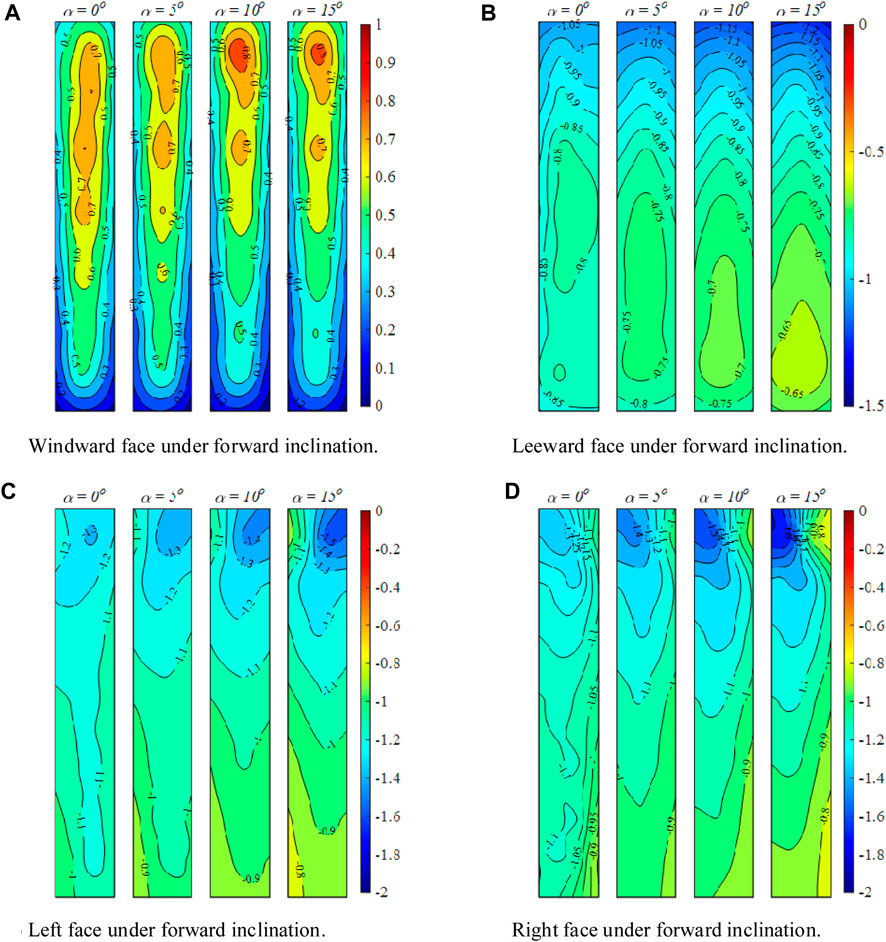
FIGURE 4. Pressure coefficients at different inclinations under forward inclined condition: (A) Windward face; (B) Leeward face; (C) Left face; (D) Right face.
In previous studies of slender structures with 18:1 inclined prisms, a high suction region in the middle of the near two-dimensional region was observed on the sides when in the backward tilting condition. However, this phenomenon was not observed in this experiment. It is tentatively assumed that the lack of this phenomenon may be related to the aspect ratio, as the top and base vortices may appear attenuated in the middle of slender structures, leading to differences in the observed phenomenon.
In the case of a leftward inclined column (Figure 5), the wind pressure distributions are similar to those of a vertical structure, and the mean wind pressure coefficient value is also not significantly different. This is likely because a small angle of lateral inclination has a minimal impact on the surrounding flow field. Therefore, the flow field around a small angle of lateral inclination is comparable to the vertical condition. The flow field characteristics under lateral inclination are discussed in Section 4.
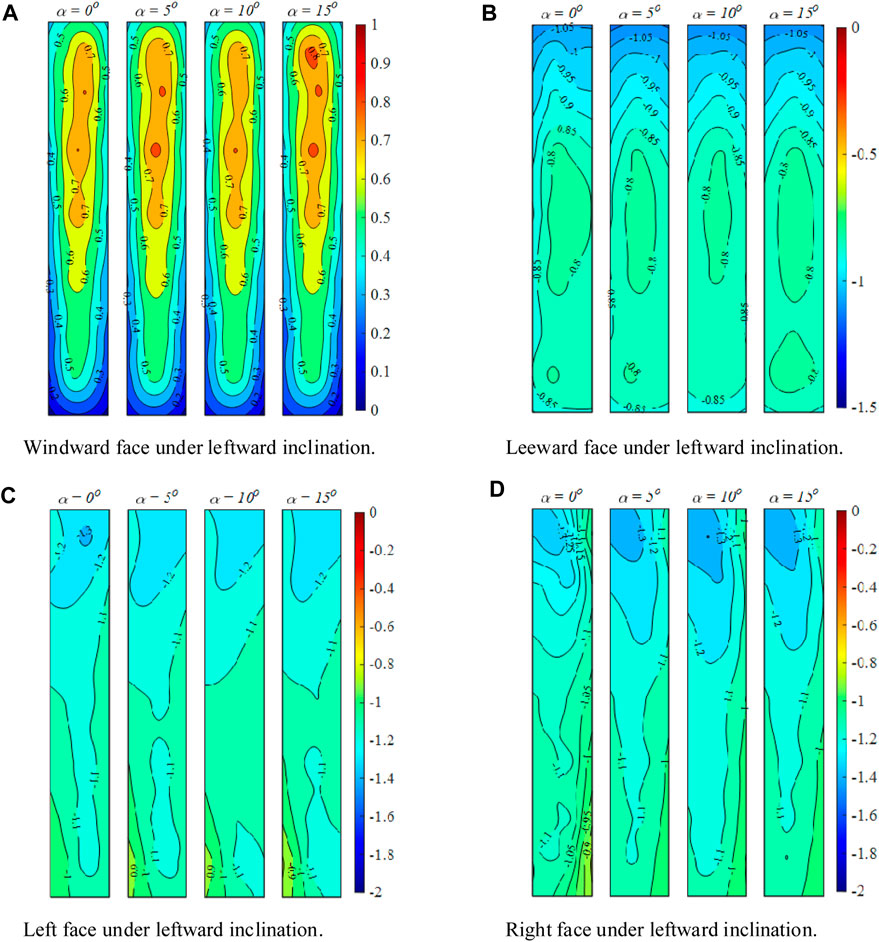
FIGURE 5. Pressure coefficients at different inclinations under leftward inclined condition: (A) Windward face; (B) Leeward face; (C) Left face; (D) Right face.
3.2 Local force spectra
Spectral analysis facilitates further investigation of the overall and local shedding of vortices in the inclined structure. Figure 6 shows the generalized crosswind force spectra of the structure at level 1, 4 and 7 (see Figure 2B) for different inclination directions and angles. The vertical axis
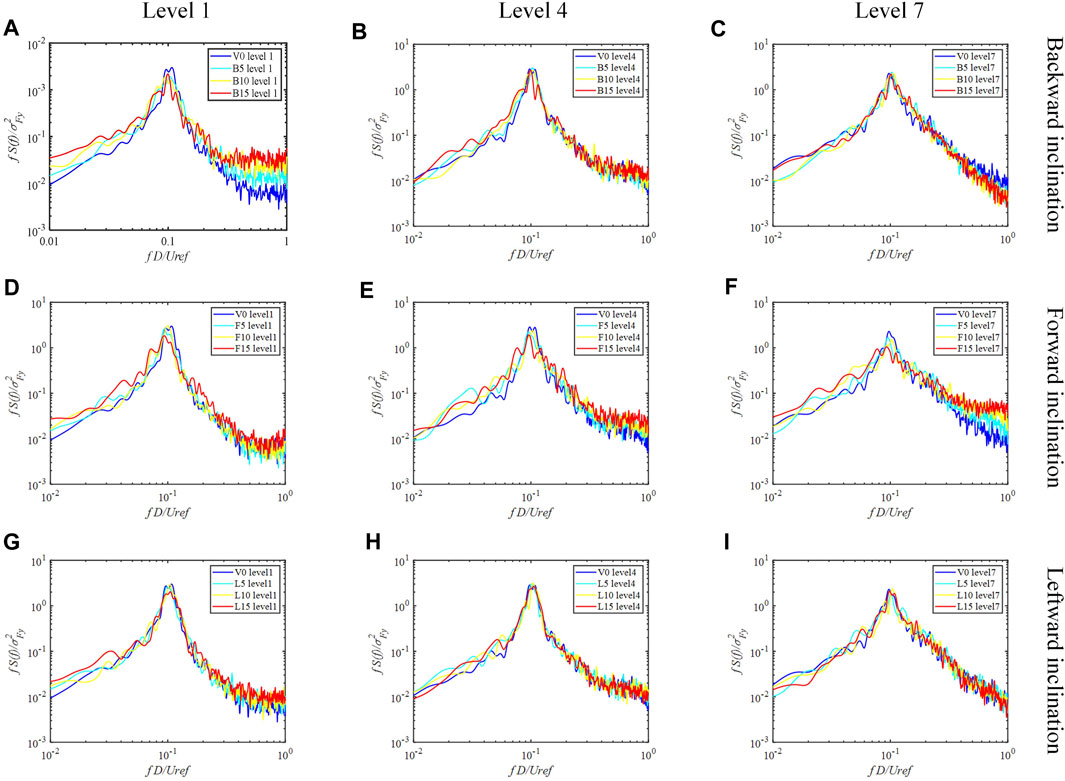
FIGURE 6. Spectra of generalized cross-wind force: (A–C) Backward inclination condition; (D–F) Forward inclination condition; (G–I) Leftward inclination condition.
Under the backward inclination condition, the generalized crosswind force spectra at the bottom and top of the structure are more sensitive to the inclination angle, especially in the high-frequency portion. The high-frequency component of the backward inclination decreases with height, and this phenomenon becomes more pronounced with larger backward inclination angles. As the backward inclination angle increases, the high-frequency portion of the crosswind force spectrum increases at the bottom of the structure. This phenomenon is caused by the interaction between the “extended base vortex pair” [31] and the Karman vortex shedding. The interaction delays the development of Karman vortex shedding and reduces the corresponding energy. Moreover, the suppression of Karman vortex shedding near the base of the backward-inclined column is more significant than near the free end due to the generation of cellular vortexes with lower shedding frequencies. As a result, the frequency of vortex shedding is reduced.
In the forward inclination condition, the generalized crosswind force spectra are more affected at the bottom and top of the structure (Figures 6D, F). Unlike the backward inclination, the high-frequency component of the forward inclination increases with height, and this phenomenon becomes more pronounced with larger forward inclination angles. The high-frequency part of the spectrum increases with increasing forward inclination angle for the top of the structure. The peak of the spectrum at column height decreases with increasing forward inclination, particularly near the free end. Karman vortex shedding near the free end of the front inclined column is significantly suppressed by the “extended free end vortex pair”, which interferes with Karman vortex shedding and produces a cell-shedding structure. This contributes to the reduction in shedding frequency in the forward inclination case. Further details will be provided in Section 4.2 that follows.
The impact of the inclination angle on the lift spectrum for the leftward inclination structure is predominantly observed at the bottom, as depicted in Figure 6G. In contrast, for the middle and top sections of the structure, the effect of the inclination angle on the spectrum is negligible. This phenomenon can be attributed to changes in the horseshoe vortex near the bottom of the structure, which limit the distance between the structure and the ground on the windward side, compress the available space for airflow, impinge on the fixed-end horseshoe vortex, and result in an asymmetric separation of fluid on both sides of the fixed-end. As a consequence, the frequency of Karman vortex shedding decreases.
The impact of inclination direction and angle on the spectra of generalized along-wind force is relatively low (see Supplementary Appendix SB). The vertical axis
3.3 Local force coefficient
For the three-dimensional prism model, the aerodynamic coefficients vary along the height, and changing the angle of inclination causes a change in the downwash and upwash flows, resulting in a change in the local force coefficients. The local force coefficients are defined as follows:
where,
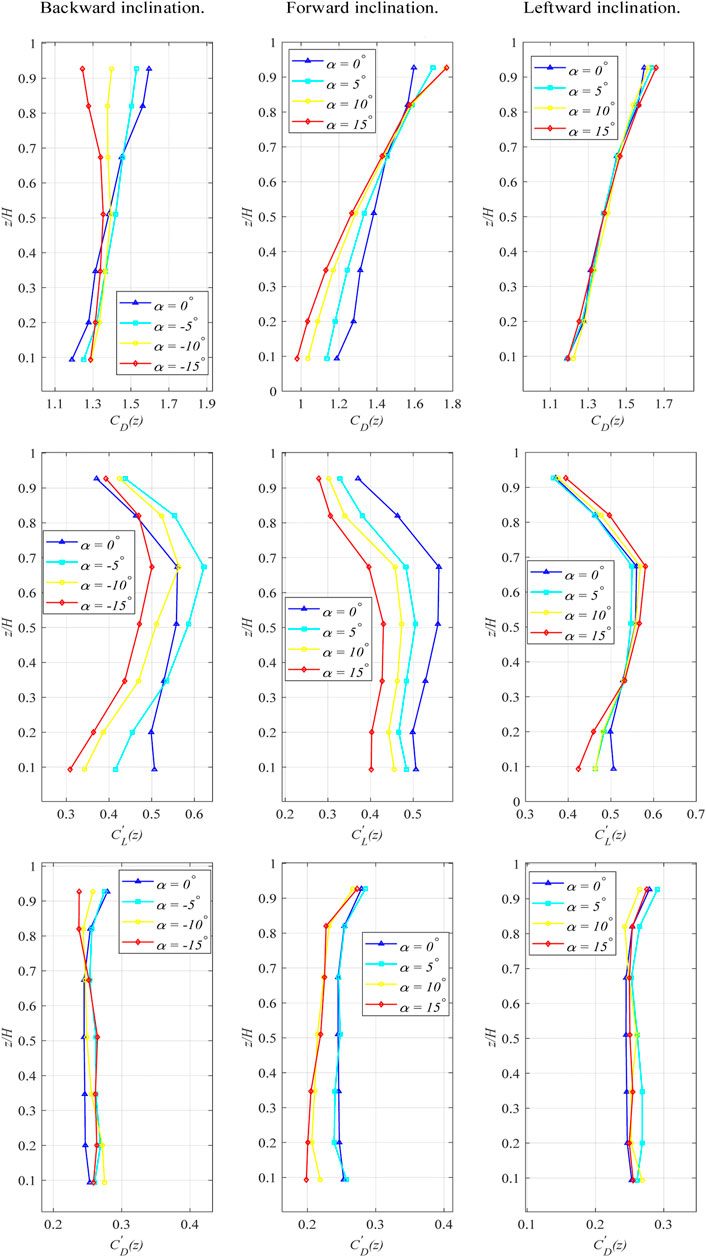
In the case of backward inclination, as shown in the first line of Figure 7, the
The second line of Figure 7 exhibits the local RMS lift coefficient variation along the height for different angles. As height increases, there is a discernible pattern of
The third line of Figure 7 depicts the variation of the local Root Mean Square (RMS) drag coefficient with respect to height under different conditions. In the case of forward inclination, there is a notable rise in
3.4 Coherences of pressures on two side faces
A coherence function is usually utilized to evaluate the effect of turbulence on spatial distribution of aerodynamic forces and to explain the flow separation around a bluff body [32,33]. In this study, it is employed to elucidate the impact of inclination on the aerodynamic forces acting on the structure. Figures 8–10 show the coherence of the surface pressure at the corresponding positions on the left and right sides. The coherence is calculated separately for layers 1, 4 and 7 at different inclination angles and orientations. The coherence is defined by the following equation:
where
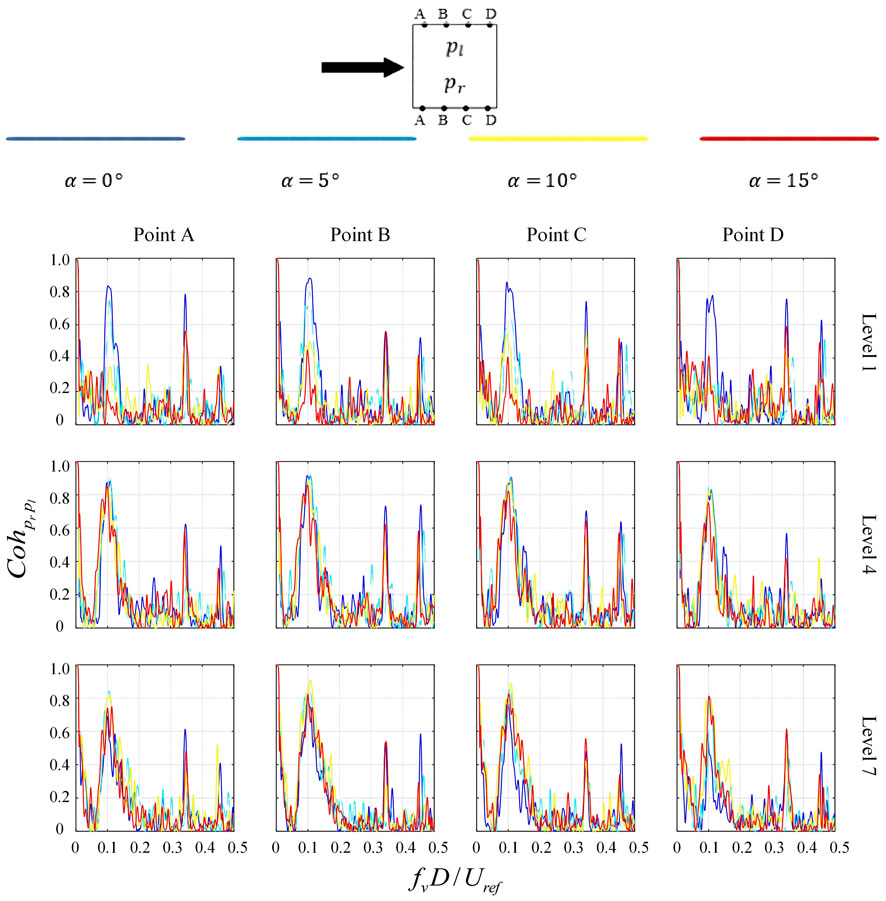
FIGURE 8. Coherences between surface pressures taken at the corresponding positions on two side faces of backward inclined prisms compared with vertical prism.
In the case of vertical structures (
In the case of forward-inclined structures, the opposite trend to that of the backward-inclined case is observed, as shown in Figure 9. Here, coherence decreases as height increases. The reduction in coherence can be attributed to the interaction of the shear layers on both sides, caused by the presence of significant downward axial flow in the near wake of the forward-inclined prism near the free end (Figure 13B). As the height decreases, coherence around the Strouhal frequency gradually returns to a high level, though still remaining below the level of coherence observed at the vertical operating frequency. Notably, a significant peak is observed at 3.5 times the Strouhal number. The generation of this high-frequency component in fluctuating pressures is still a subject for discovery.
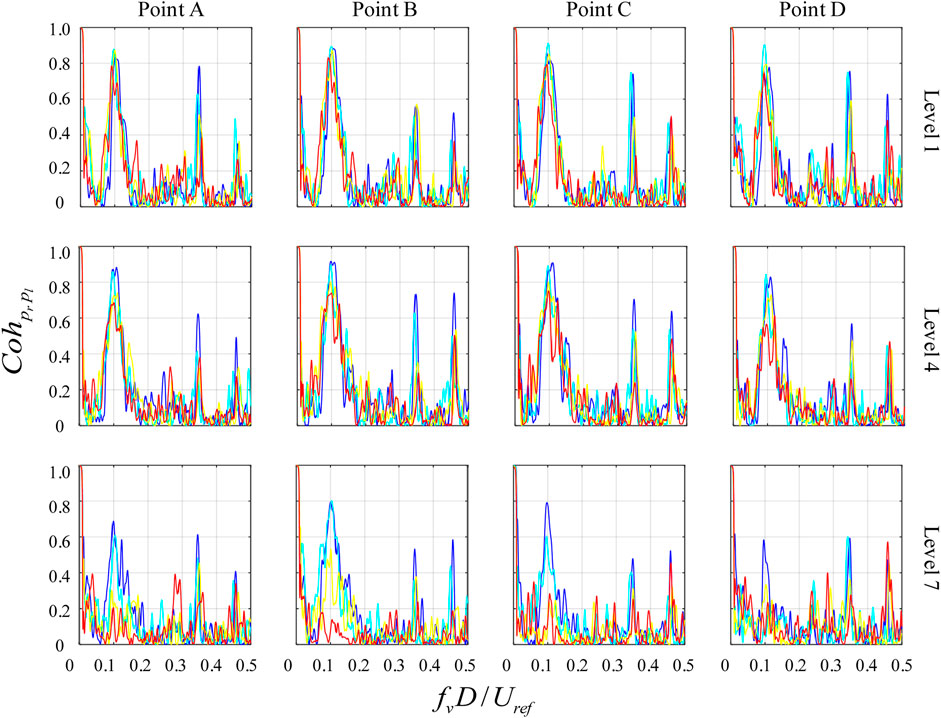
FIGURE 9. Coherences between surface pressures taken at the corresponding positions on two side faces of forward inclined prisms compared with vertical prism.
Figure 10 illustrates the pressure coherence of the leftward-inclined prism. The results show that coherence between the leftward-inclined and vertical conditions is similar in the middle and free end of the structure, while at the bottom of the structure, the coherence between the leftward-inclined and vertical conditions is different. Specifically, the frequencies corresponding to the coherence peaks exhibit a decreasing trend with increasing leftward-inclined angle. This observation may also be attributed to the alteration of the horseshoe vortex near the bottom of the structure (as shown in Figures 14G, I, K), which restricts the distance between the windward side and the ground, squeezing the available space for airflow and impinging on the fixed-end horseshoe vortex, resulting in asymmetric separation of the fluid on both sides of the fixed-end and hence changes in the coherences at the bottom of the leftward-inclined structure.
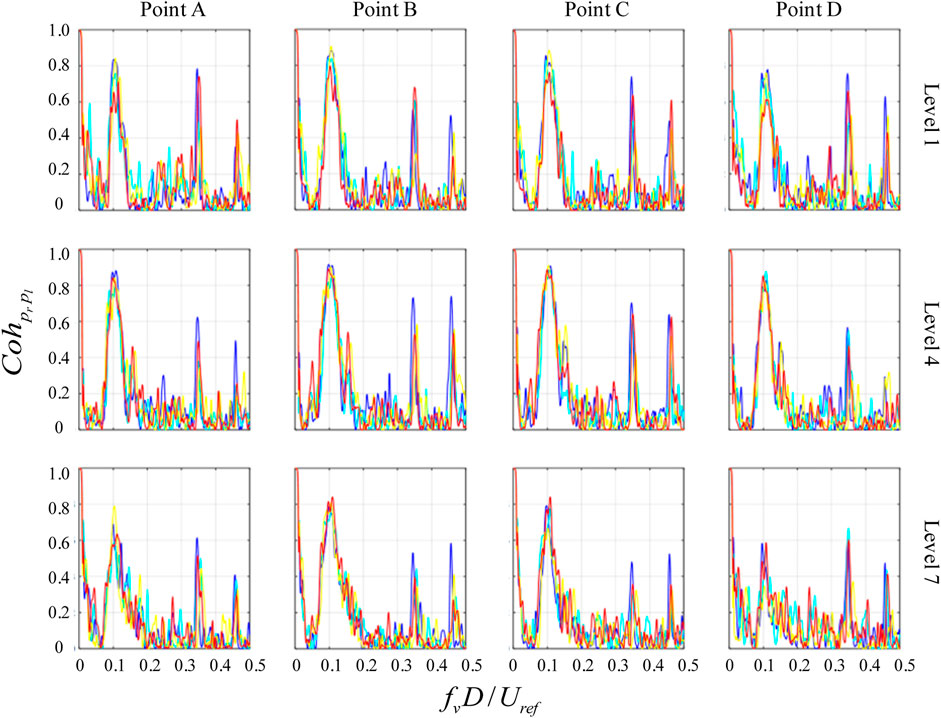
FIGURE 10. Coherences between surface pressures taken at the corresponding positions on two side faces of leftward inclined prisms compared with vertical prism.
3.5 Strouhal number
The global Strouhal number (St), which is the mean value of the local Strouhal number over the whole span of the prism with different inclinations, is presented in Figure 11. It can be observed that the three inclined directions have distinct effects on the global Strouhal number (St). In the backward-inclined condition, St first increases and then decreases as the angle of backward inclination increases. This is due to the fact that the backward inclination enhances the upwash of the prismatic near wake flow, which interacts with the Karman vortex and alters its shedding. For forward inclination, as the angle of forward inclination increases, the global Strouhal number decreases. This is because forward inclination strengthens the downwash, and the downwash flow strongly suppresses vortex shedding. It is believed that the forward inclination disrupts the vortex shedding and hence reduces the associated energy adjacent to the Strouhal frequency. The Strouhal number under the leftward-inclined condition always maintains a high value, indicating that leftward inclination accelerates vortex shedding, and the vortex shedding frequency increases with the increase of the leftward-inclined angle.
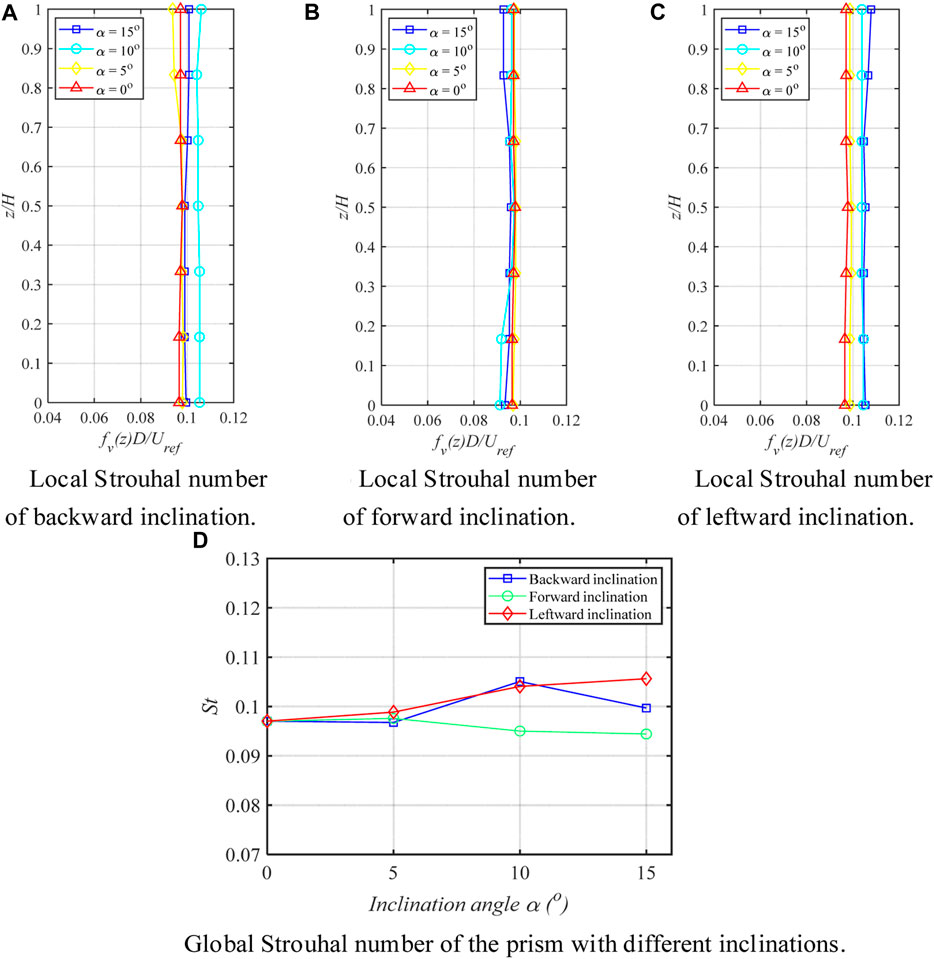
FIGURE 11. Local Strouhal number of the prism with different inclinations and Global Strouhal number: (A) Backward inclination condition; (B) Forward inclination condition; (C) Leftward inclination condition; (D) Global Strouhal number of the prism with different inclinations.
4 Result of Large-eddies simulation
4.1 Wind field around inclined prism
Figure 12. Depicts the velocity time-averaged and streamlines at different heights, namely, 1/6H, 1/2H, and 5/6H, for varying angles of inclination. It is evident that the crosswind velocity fields and streamlines are distributed symmetrically at different elevations. Upon approaching the structure, separation occurs on the side exposed to the wind, generating relatively small-scale vortices on both sides of the structure, while large-scale vortices are formed in the wake region. For the forward inclination case, larger vortices occur at the apex of the structure, whereas for the backward inclination case, larger vortices appear at the base of the structure. In conjunction with Figure 20(a), for the backward inclination case, the flow characteristics at the 1/6H position are primarily influenced by the upward flow from the lower portion of the structure and the axisymmetric vortex, known as Kármán vortex. In contrast, at the 5/6H position at the top of the structure, the flow characteristics are mainly affected by the downward flow and the axisymmetric vortex, with the downward flow primarily causing the axisymmetric vortex to separate, thus inhibiting the shedding frequency of the vortex. For the forward inclination case, in conjunction with Figure 12B, the 1/6H position at the base is affected by the downward flow, and the 5/6H position at the top of the structure is also influenced by the downward flow and the axisymmetric vortex. Although there is a downward flow, it acts in conjunction with the axisymmetric vortex, resulting in larger vortices in the wake region at the top. For the left inclination case, similar to the vertical case, the vortex length is smaller at the base and free end due to the weakening of the inhibitory effect of the upwash and downwash on the shedding frequency of the Kármán vortex in the mid-span section.
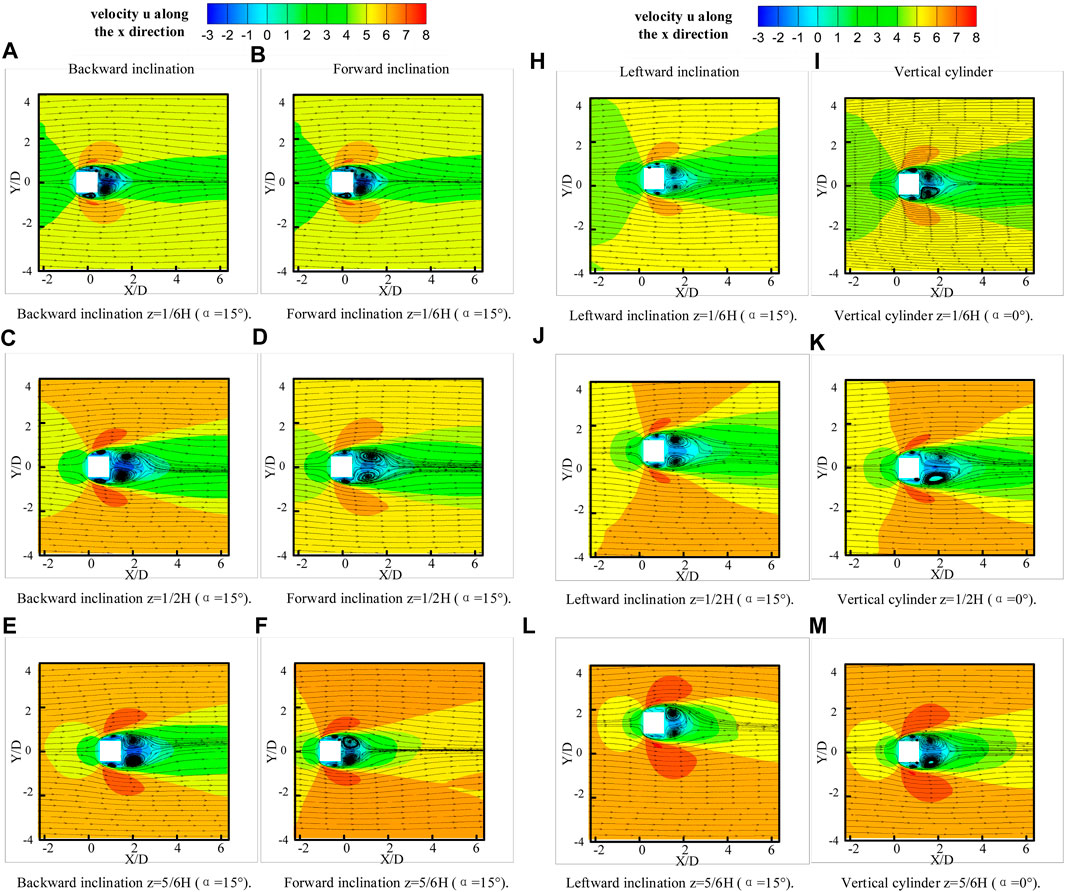
FIGURE 12. Time average velocity and streamline at 1/6H, 1/2H, 5/6H heights in different inclined directions: (A, C, E) Backward inclination condition; (B, D, F) Forward inclination condition; (H, J, L) Leftward inclination condition; (I, K, M) Vertical cylinder.
The time-averaged velocity and streamlines for each operating condition on the x-z plane are shown in Figure 13. For the vertical configuration, as shown in Figure 13D, the stagnation point on the windward face is located approximately one-third of the way down from the top of the structure. At the stagnation point, the airflow separates in the z direction, with the flow traveling upwards over the top of the structure and downwards towards the ground below, where it is forced to circulate and form a horseshoe vortex. As the airflow passes over the structure above the stagnation point, it continues upwards and forms a shear layer, which creates vortices of different scales (top vortices) that can be observed above and behind the structure at the top of the flow region. This is an important reason for the “free end effects " [28]. At the wake, it is possible to observe the downwash flow at the free end and the upwash flow at the bottom, which has also been mentioned in the studies of [34]. Due to their interaction, a standing point is formed around 0.5H, where the velocity is zero [35]. For the backward-leaning operating condition, the stagnation point on the windward face moves downward, while the saddle point moves upward, as shown in Figure 13A. Generally speaking, in addition to a decrease in velocity in the free-end region, the velocity near the wake increases with an increase in the backward-leaning angle. The streamlines indicate that an upward flow exists in the near wake of the inclined column, which strengthens the upwash. For the forward-leaning operating condition, the stagnation point on the windward face moves upward, while the saddle point almost disappears, as shown in Figure 13B. It is noteworthy that there have been significant changes in the top vortex under the forward and aft tilting conditions. In the left tilting condition, a plane is cut along the
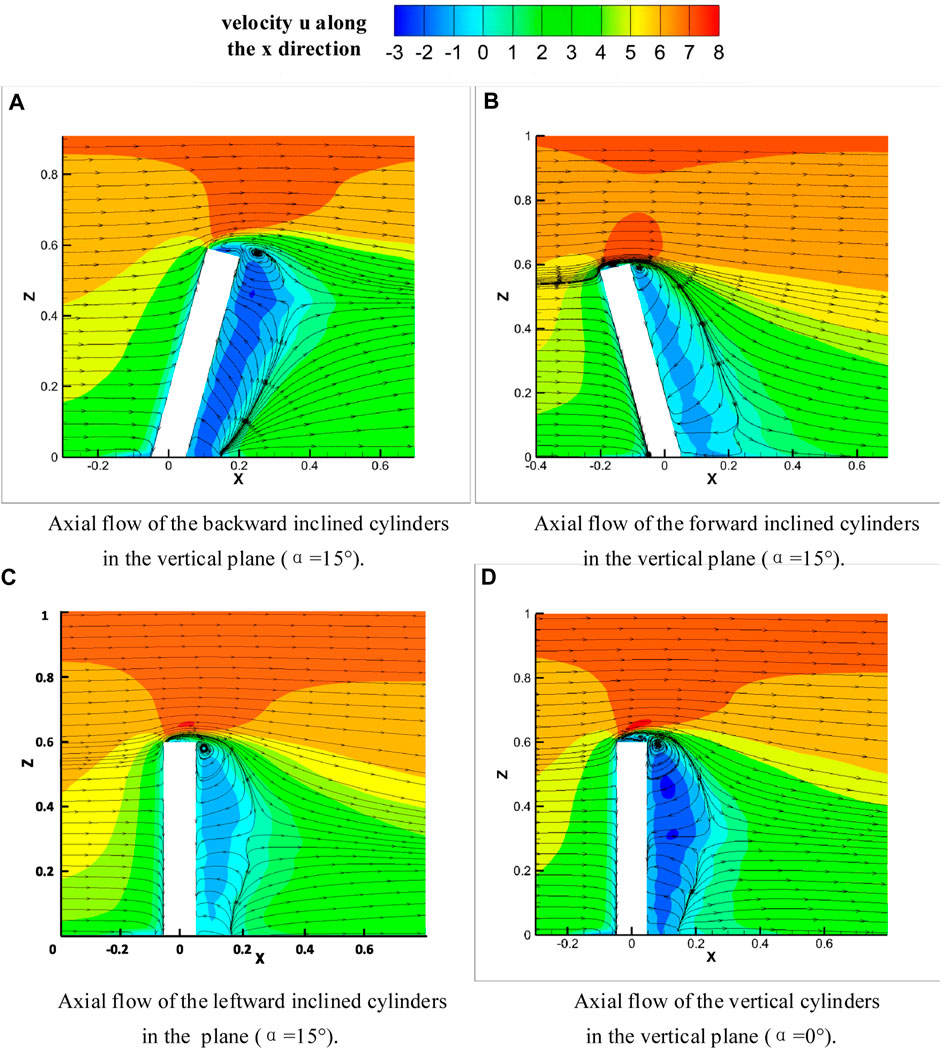
FIGURE 13. Time-averaged streamlines in the x-z plane: (A) Backward inclination condition; (B) Forward inclination condition; (C) Leftward inclination condition; (D) Vertical cylinder.
In the previous experiments involving an aspect ratio of 18:1, it was observed that the upwash and downwash in the forward and backward inclined wake regions were nearly parallel to the structure. However, in the current experiment, the upwash and downwash flow exhibits an arc shape. This deviation can likely be attributed to the significant influence of the upper vortex on the center of the structure, which has a small aspect ratio.
4.2 Time-averaged vortex structures in The wake of cylinders
In order to investigate the structure of the vortex at the wake of a structure, the Q-criterion proposed by Hunt, Wray, and Moin [36] was used to identify the vortex core. The criterion Q is defined as:
where
In this investigation, a value of Q equal to 20 was utilized to achieve the desired flow structure, while disregarding the small-scale vortices that held no interest. For the backward-inclined structure, the wake topology greatly differed from that of the vertical structure. Two sets of vortices, coined “quadrupole wakes” [37], were observed. As depicted in Figure 14A, the free-end vortex pairs ascend along with the base vortex pairs, as a consequence of the intensified upwash. Additionally, the lateral extent of the horseshoe vortex is decreased and thickened relative to the vertical structure. In contrast, for the forward inclined structure, the wake topology exhibited a complete reversal compared to the backward inclined structure. As illustrated in Figure 14B, the free-end vortex pair descends, and the base vortex pair is hindered and forced to ground level, due to the increased downwash. Meanwhile, the horseshoe vortex is elongated and laterally expanded. Regarding the leftward inclined structure, “dipole wakes” [37] similar to the vertical structure were evident, but the “dipole wakes” were larger for the left-sloping structure. Furthermore, there was a change in the horseshoe vortex located at the base of the leftward inclined structure, resulting in a variation of the local force coefficient coherence at the base of the leftward inclined structure. For the vertical structure (Figure 14H), a pair of vortices can be identified in the wake region close to the free end, which is referred to as “dipole wakes”. In addition, a “horseshoe vortex” is observable at the bottom front of the structure.
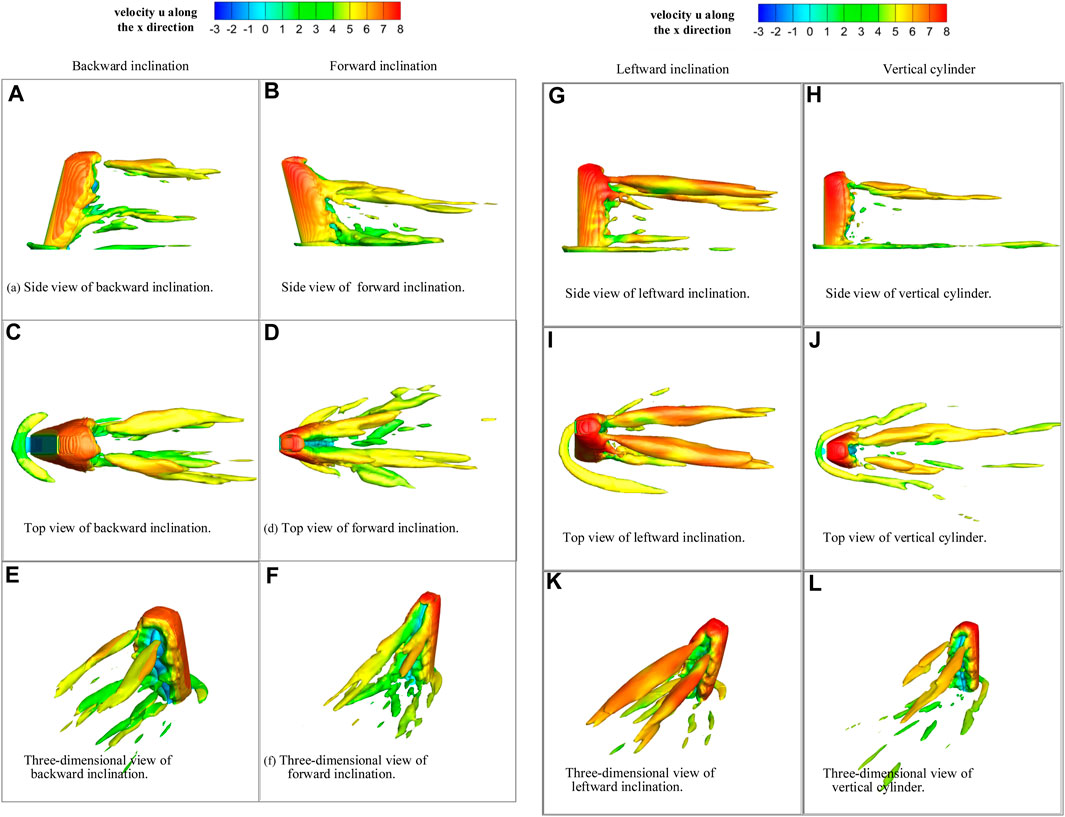
FIGURE 14. Three different views of the time-averaged vortex structure at Q = 20: (A, C, E) Backward inclination condition; (B, D, F) Forward inclination condition; (G, I, K) Leftward inclination condition; (H, J, L) Vertical cylinder.
According to the previous study [7,31] the reduction of the local Strouhal number is attributed to the presence of vortex pairs. In the case of the forward-inclined structure, the free-end vortex pairs, distributed across a majority of the height, obstruct the Carmen vortex shedding on both sides of the structure. The interference of these two vortex structures results in the formation of cellular vortex shedding structures, which operate at a lower shedding frequency as compared to the Karman vortex shedding frequency. This leads to a decline in the Strouhal number in the forward-inclined scenario. In a similar manner, the basal vortex pair behind the backward-inclined column behaves akin to the free-end vortex pair in the forward-inclined structure and interacts with the Karman vortex, resulting in a cellular vortex with a low shedding frequency. This, in turn, leads to a local reduction in the Strouhal number towards the backward-inclined structure.
When compared to earlier investigations involving an aspect ratio of 18:1, the present experiment reveals that in a tall, vertically oriented structure characterized by a significant aspect ratio (18:1), the time-averaged vortex displays “quadrupole wakes”, whereas in a vertically oriented structure with a smaller aspect ratio (6.25:1) as studied in this experiment, the time-averaged vortex exhibits “dipole wakes".
5 Conclusion
Aerodynamic features of a square-sectioned structure with an aspect ratio of 6.25:1, when subjected to an inclined position, have been probed in the present study. The outcomes illustrate that the inclination of the structure has a notable impact on its aerodynamic attributes. Both wind tunnel experiments and numerical simulations have been utilized to explicate the influence of inclination on the aerodynamic traits of the structure. Hereunder, the key findings are outlined:
The aerodynamic properties of the inclined structure are affected by the aspect ratio: In the backward inclination condition, a high suction area emerges in the middle of the side near the two-dimensional region, but this phenomenon was not observed in the present study, and is tentatively attributed to the aspect ratio. For elongated structures, the free-end vortex and the base vortex may exert a diminished impact on the middle, leading to differing effects. Furthermore, the variation in average drag coefficients between the 6.25:1 and 18:1 front-to-back inclination is manifested at the top and base, respectively, presumably owing to the greater control exerted by the free-end vortex and base vortex. Therefore, the aerodynamic characteristics of the inclined slender structure cannot be entirely extrapolated to the small aspect ratio structure. Additionally, there exists a dipole wake in the vertical structure, whereas in the wake area of the forward and backward inclined structure, an arc-shaped upwash and downwash flow is present, which is distinct from that of the slender inclined structure.
The influence of the free-end vortex causes the stagnation region on the windward side to gradually shift downwards as the angle of backward inclination increases in the backward inclined condition. Moreover, the height of the center of the near two-dimensional region behind the middle span of the leeward side shifts gradually upwards, and the reattachment pressure is located at the bottom of the side; the forward inclined condition is just the opposite.
In the backward inclined condition, the spectra of generalized cross-wind force exhibit significant changes at the bottom and a significant reduction in coherence at the free end. Conversely, in the forward inclined condition, the spectra of generalized cross-wind force undergo considerable changes at the top and a significant reduction in coherence at the bottom.
For the leftward-inclined condition, due to the change of the horseshoe vortex, the influence of the tilt angle on the lift spectrum is mainly reflected in the bottom, and the difference between the root mean square lift coefficient and the root mean square drag coefficients is mainly in the top and the middle and lower parts, respectively.
The forward inclined square prism intensifies the downwash flow, while the backward inclined square prism enhances the upwash flow. The left-leaning and vertical structures are quite similar, resulting in minimal differences in the wind pressure distribution on the windward and leeward surfaces when compared to the vertical structure. Additionally, the average wind pressure coefficient is not significantly different.
Data availability statement
The original contributions presented in the study are included in the article/Supplementary Material, further inquiries can be directed to the corresponding authors.
Author contributions
Conceptualization, ZC and LZ; methodology, LZ and GN; software, GN and LZ; validation, ZC, GN, and YX; investigation, GN and SL; resources, ZC and TT; data curation, YL; writing—original draft preparation, GN and LZ; writing—review and editing, ZC, TKT and ZW; visualization, CY and XX; supervision, ZC and YX; project administration, ZC and HW; funding acquisition, ZC and YL. All authors have read and agreed to the published version of the manuscript.
Funding
The work was supported by the National Natural Science Foundation of China (Grant No.: 51908090), the Fundamental Research Funds for the Central Universities (Project No.:2022CDJXY-016), the Natural Science Foundation of Chongqing, China (2022NSCQ-JQX2377), the Key project of Technological Innovation and Application Development in Chongqing (Grant No.: CSTB2022TIAD-KPX0145, CSTB2022TIAD-KPX0142), Research Grants Council of the Hong Kong Special Administrative Region, China (Project No. 16211821). I appreciate the assistance provided by Zitong Wang from Chongqing University in the composition of this text.
Conflict of interest
The authors declare that the research was conducted in the absence of any commercial or financial relationships that could be construed as a potential conflict of interest.
Publisher’s note
All claims expressed in this article are solely those of the authors and do not necessarily represent those of their affiliated organizations, or those of the publisher, the editors and the reviewers. Any product that may be evaluated in this article, or claim that may be made by its manufacturer, is not guaranteed or endorsed by the publisher.
Supplementary material
The Supplementary Material for this article can be found online at: https://www.frontiersin.org/articles/10.3389/fphy.2023.1180778/full#supplementary-material
References
1. Chen Z, Huang H, Xu Y, Tse KT, Kim B, Wang Y. Unsteady aerodynamics on a tapered prism under forced excitation. Eng Structures (2021) 240:112387. doi:10.1016/j.engstruct.2021.112387
2. Chen Z, Huang H, Tse KT, Xu Y, Li CY. Characteristics of unsteady aerodynamic forces on an aeroelastic prism: A comparative study. J Wind Eng Ind Aerodynamics (2020) 205:104325. doi:10.1016/j.jweia.2020.104325
3. Chen Z, Tse KT, Kwok K, Kareem A, Kim B. Measurement of unsteady aerodynamic force on a galloping prism in a turbulent flow: A hybrid aeroelastic-pressure balance. J Fluids Structures (2021) 102:103232. doi:10.1016/j.jfluidstructs.2021.103232
4. Gu M, Quan Y. Across-wind loads and effects of super-tall buildings and structures. Sci China Technol Sci (2011) 54:2531–41. doi:10.1007/s11431-011-4543-5
5. Tanaka H, Tamura Y, Ohtake K, Nakai M, Kim YC. Experimental investigation of aerodynamic forces and wind pressures acting on tall buildings with various unconventional configurations. J Wind Eng Ind Aerodynamics (2012) 107:179–91. doi:10.1016/j.jweia.2012.04.014
6. Carassale L, Freda A, Marre-Brunenghi M. Experimental investigation on the aerodynamic behavior of square cylinders with rounded corners. J Fluids Structures (2014) 44:195–204. doi:10.1016/j.jfluidstructs.2013.10.010
7. Hu G, Tse K-T, Kwok KC, Chen Z. Pressure measurements on inclined square prisms. Wind and Structures (2015) 21(4):383–405. doi:10.12989/was.2015.21.4.383
8 Chen Z, Tse KT, Kwok KCS, Kareem A. Aerodynamic damping of inclined slender prisms. J Wind Eng Ind Aerodynamics (2018) 177:79–91. doi:10.1016/j.jweia.2018.04.016
9. Hui Y, Yuan K, Chen Z, Yang Q. Characteristics of aerodynamic forces on high-rise buildings with various façade appurtenances. J Wind Eng Ind Aerodynamics (2019) 191:76–90. doi:10.1016/j.jweia.2019.06.002
10 Chen Z, Xu Y, Huang H, Tse KT. Wind tunnel measurement systems for unsteady aerodynamic forces on bluff bodies: Review and new perspective. Sensors (2020) 20(16):4633. doi:10.3390/s20164633
11. Li CY, Tim K, Hu G. Dynamic Mode Decomposition on pressure flow field analysis: Flow field reconstruction, accuracy, and practical significance. J Wind Eng Ind Aerodynamics (2020) 205:104278. doi:10.1016/j.jweia.2020.104278
12. Li CY, Chen Z, Tse TKT, Weerasuriya AU, Zhang X, Fu Y, et al. Establishing direct phenomenological connections between fluid and structure by the Koopman-Linearly Time-Invariant analysis. Phys Fluids (2021) 33(12):121707. doi:10.1063/5.0075664
13. Chen Z, Wang Y, Wang S, Huang H, Tse KT, Li CY, et al. Decoupling bi-directional fluid–structure interactions by the Koopman theory: Actualizing one-way subcases and the role of crosswind structure motion. Phys Fluids (2022) 34(9):095103. doi:10.1063/5.0101749
14. Li CY, Chen Z, Lin X, Weerasuriya AU, Zhang X, Fu Y, et al. The linear-time-invariance notion to the Koopman analysis: The architecture, pedagogical rendering, and fluid–structure association. Phys Fluids (2022) 34(12):125136. doi:10.1063/5.0124914
15. Li CY, Chen Z, Tse TKT, Umenga A, Zhang X, Fu Y, et al. The linear-time-invariance notion of the koopman analysis—Part 2: Physical interpretations of invariant koopman modes and phenomenological revelations (2022). Available at: https://arxiv.org/abs/2112.03029 (Accessed December 6, 2021).
16. Li CY, Chen Z, Tse TKT, Weerasuriya AU, Zhang X, Fu Y, et al. A parametric and feasibility study for data sampling of the dynamic mode decomposition: Range, resolution, and universal convergence states. Nonlinear Dyn (2022) 107(4):3683–707. doi:10.1007/s11071-021-07167-8
17. Li CY, Chen Z, Zhang X, Tse TKT, Lin C. Koopman analysis by the dynamic mode decomposition in wind engineering. J Wind Eng Ind Aerodynamics (2023) 232:105295. doi:10.1016/j.jweia.2022.105295
18. Li CY, Chen Z, Tse TKT, Weerasuriya AU, Zhang X, Fu Y, et al. A parametric and feasibility study for data sampling of the dynamic mode decomposition: Spectral insights and further explorations. Phys Fluids (2022) 34(3):035102. doi:10.1063/5.0082640
19. Chen Z, Bai J, Wang S, Xue X, Li K, Tse K, et al. The role of transverse inclination on the flow phenomenology around cantilevered prisms and the tripole wake mode. J Fluids Structures (2023) 118:103837. doi:10.1016/j.jfluidstructs.2023.103837
20. Chen Z, Zhang L, Li K, Xue X, Zhang X, Kim B, et al. Machine-learning prediction of aerodynamic damping for buildings and structures undergoing flow-induced vibrations. J Building Eng (2023) 63:105374. doi:10.1016/j.jobe.2022.105374
21. Fu Y, Lin X, Li L, Chu Q, Liu H, Zheng X, et al. A POD-DMD augmented procedure to isolating dominant flow field features in a street canyon. Phys Fluids (2023) 35(2):025112. doi:10.1063/5.0133375
22. Lin N, Letchford C, Tamura Y, Liang B, Nakamura O. Characteristics of wind forces acting on tall buildings. J Wind Eng Ind Aerodynamics (2005) 93(3):217–42. doi:10.1016/j.jweia.2004.12.001
23. Smagorinsky J. General circulation experiments with the primitive equations: I. The basic experiment. Monthly Weather Rev (1963) 91(3):99–164. doi:10.1175/1520-0493(1963)091<0099:GCEWTP>2.3.CO;2
24. Gousseau P, Blocken B, van Heijst GJF. Quality assessment of Large-Eddy Simulation of wind flow around a high-rise building: Validation and solution verification. Comput Fluids (2013) 79:120–33. doi:10.1016/j.compfluid.2013.03.006
25. Chen Z, Yuan C, Wu H, Zhang L, Li K, Xue X, et al. An improved method based on EEMD-LSTM to predict missing measured data of structural sensors. Appl Sci (2022) 12(18):9027. doi:10.3390/app12189027
26. Celik IB, Cehreli ZN, Yavuz I. Index of resolution quality for large eddy simulations. J Fluids Eng (2005) 127(5):949–58. doi:10.1115/1.1990201
28. Park C-W, Lee S-J. Free end effects on the near wake flow structure behind a finite circular cylinder. J Wind Eng Ind Aerodynamics (2000) 88(2–3):231–46. doi:10.1016/s0167-6105(00)00051-9
29. Nakamura Y, Hirata K, Urabe T. Galloping of rectangular cylinders inthe presence of a splitter plate. J Fluids Structures (1991) 5(5):521–49. doi:10.1016/s0889-9746(05)80004-0
30. Sumner D, Heseltine J, Dansereau O. Wake structure of a finite circular cylinder of small aspect ratio. Experiments in Fluids (2004) 37:720–30. doi:10.1007/s00348-004-0862-7
31. Ayoub A, Karamcheti K. An experiment on the flow past a finite circular cylinder at high subcritical and supercritical Reynolds numbers. J Fluid Mech (1982) 118:1–26. doi:10.1017/s0022112082000937
32. Matsumoto M, Shirato H, Araki K, Haramura T, Hashimoto T. Spanwise coherence characteristics of surface pressure field on 2-D bluff bodies. Fifth Asia-Pacific Conf Wind Eng (2003) 91(1):155–63. doi:10.1016/S0167-6105(02)00342-2
33. Le TH, Tamura Y, Matsumoto M. Spanwise pressure coherence on prisms using wavelet transform and spectral proper orthogonal decomposition based tools. J Wind Eng Ind Aerodynamics (2011) 99(4):499–508. doi:10.1016/j.jweia.2011.01.008
34. Wang HF, Zhou Y. The finite-length square cylinder near wake. J Fluid Mech (2009) 638:453–90. doi:10.1017/s0022112009990693
35. Houghton EL, Carruthers NB. Wind forces on buildings and structures: An introduction. Hoboken, NJ: John Wiley and Sons Incorporated (1976).
36. Hunt JC, Wray AA, Moin P. Eddies, streams, and convergence zones in turbulent flows. In: Studying turbulence using numerical simulation databases, 2. Proceedings of the 1988 summer program (1988).
Keywords: large eddy simulation, aerodynamic characteristic, wind tunnel test, inclined bluff body Structure, mechanism research
Citation: Chen Z, Ning G, Zhang L, Li S, Wang S, Xu Y, Yuan C, Tse TK, Li CY and Xue X (2023) A comprehensive study of the aerodynamic characteristics of an aspect ratio of 6.25:1 inclined square prism. Front. Phys. 11:1180778. doi: 10.3389/fphy.2023.1180778
Received: 06 March 2023; Accepted: 31 May 2023;
Published: 21 June 2023.
Edited by:
Minping Wan, Southern University of Science and Technology, ChinaReviewed by:
Qinmin Zheng, Hong Kong University of Science and Technology, Hong Kong SAR, ChinaYongxiang Huang, Xiamen University, China
Copyright © 2023 Chen, Ning, Zhang, Li, Wang, Xu, Yuan, Tse, Li and Xue. This is an open-access article distributed under the terms of the Creative Commons Attribution License (CC BY). The use, distribution or reproduction in other forums is permitted, provided the original author(s) and the copyright owner(s) are credited and that the original publication in this journal is cited, in accordance with accepted academic practice. No use, distribution or reproduction is permitted which does not comply with these terms.
*Correspondence: Cruz Y. Li, eWxpaHRAY29ubmVjdC51c3QuaGs= Xuanyi Xue, eHVleHVhbnlpQDEyNi5jb20=
 Zengshun Chen
 Guoliang Ning
 Likai Zhang1
 T. K. Tse
 Cruz Y. Li
 Xuanyi Xue
