
95% of researchers rate our articles as excellent or good
Learn more about the work of our research integrity team to safeguard the quality of each article we publish.
Find out more
ORIGINAL RESEARCH article
Front. Phys. , 19 June 2023
Sec. Nuclear Physics
Volume 11 - 2023 | https://doi.org/10.3389/fphy.2023.1177486
This article is part of the Research Topic Advances in Laser-Driven Nuclear Physics View all 19 articles
We numerically show that laser-wakefield accelerated electron beams obtained using a PetaWatt-scale laser system can produce high-flux sources of relativistic muons that are suitable for radiographic applications. Scalings of muon energy and flux with the properties of the wakefield electron beams are presented. Applying these results to the expected performance of the 10-PW class laser at the Extreme Light Infrastructure Nuclear Physics (ELI-NP) demonstrates that ultra-high power laser facilities currently in the commissioning phase can generate ultra-relativistic muon beams with more than 104 muons per shot reaching the detector plane. Simple magnetic beamlines are shown to be effective in separating the muons from noise, allowing for their detection using, for example, silicon-based detectors. It is shown that a laser facility like the one at ELI-NP can produce high-fidelity and spatially resolved muon radiographs of enclosed strategically sensitive materials in a matter of minutes.
Laser-wakefield acceleration (LWFA) is receiving significant attention from the research community, due to its appealing capability of sustaining ultra-high accelerating fields, typically in the range of a few up to tens of GV/m [1]. Numerical and experimental work has already established that electron beams with unique characteristics can be achieved; these include femtosecond-scale duration [2], sub-mrad divergence [3], micron-scale source size [4], and GeV-scale energies from cm-scale acceleration lengths (with the current record above 8 GeV [5]).
LWFA has already been applied to the generation and application of secondary sources such as betatron radiation [6], positron beams [7,8], bremsstrahlung radiation [9], inverse-Compton scattered gamma-ray radiation [10]; [11], THz radiation [12], and neutron sources [13]. The high energy and brightness of these beams poses the natural question as to whether they would be suitable to also drive a muon source of interest for practical applications. Previous numerical studies reported in the literature have shown that this is possible in principle [14], but several issues must still be resolved before laser-driven muon beams can be effectively measured in the laboratory, and used for radiographic and imaging applications.
The possibility of generating muons using high-power lasers is of great interest for the research community, since this could provide a relatively compact and inexpensive source of muons with appealing characteristics not only for radiography, but also for a wide range of fundamental physics applications, such as muon-catalyzed fusion [15] and precision muon physics [16]. Traditionally, muon beams are obtained either from radio-frequency accelerators [17] or naturally, from cosmic rays [18]. While existing muon sources have already been used to produce astonishing results—one of the most widely known of which is arguably the detection of a hidden chamber in the pyramid of Giza [19]—widespread and systematic use of these sources is still hampered by either the large size and cost of proton-driven muon beamlines or by the low flux of cosmic ray sources. For example, natural muon sources can only provide approximately 1 muon/cm2/minute at sea level [18], resulting in typical acquisition times for a meaningful radiography of days, if not weeks. This renders high turn around applications in national security and industry unviable; for instance, the US Domestic Nuclear Detection Office (DNDO) suggests that scanners should be able to detect the equivalent of a few kg of uranium in 1–2 min.
In a nutshell, muon pairs can also be generated from the electromagnetic cascade initiated by an electron beam as it propagates through a high-Z solid target [20] [21]. For sufficiently thick targets [22], the simplest channel of the cascade starts with a relativistic electron generating a high-energy photon via bremsstrahlung, which can then produce a leptonic pair in the presence of the nuclear field. However, the higher muon mass implies that muon generation is significantly less likely than the generation of electron-positron pairs. One would then expect an overwhelming level of noise arising from electron-positron pairs and bremsstrahlung photons, which can easily prevent detectors from providing a clear muon signal. To date, this is arguably one of the main reasons why laser-driven muon generation has only been studied numerically, without an experimental observation.
Here we numerically show that high-flux populations of muons can be generated using state-of-the-art high-power laser facilities and, crucially, that these muons can be effectively discerned from noise using a simple proof-of-principle beamline. As an example, we show here how to apply these results to the 10 PW laser at the Extreme Light Infrastructure Nuclear Pillar (ELI-NP), which has already demonstrated laser peak powers at the 10 PW level [23]. Particle-In-Cell [24] [25] [26] simulations show that a laser of this kind can generate broadband multi-GeV electron beams with an integrated charge of the order of a few nC. FLUKA simulations [27] [28] of the interaction of these electron beams with high-Z solid targets show a relatively high number of relativistic muon pairs, which are seen to be effectively separated from noise using a simple magnetic beamline. Flair [29] is used in combination to tracking diagrams to provide a visual reference of these interactions. These simulations indicate that muons emerging from this setup can be effectively measured above noise and have meaningful radiographic capability, with an example shown of clear detection of uranium enclosed in lead containers obtainable in a matter of minutes.
The paper is organised as follows: Section 2 provides a parametric characterisation of the muon properties as a function of the electron beam parameters and thickness of the converter foil, in order to isolate the ideal configuration that maximises muon flux. Section 3 then shows a proof-of-principle design for a beamline suitable to separate positive muons from noise. Section 4 then details how these muons can be detected, while Section 5 shows how muon beams exiting the experimental setup can be used for radiographic applications. Section 6 then shows how these results can be applied to a laser facility such as the one at ELI-NP. Finally, concluding remarks are given in Section 7.
To identify a thickness of the converter target that provides suitable characteristics of the muon beam as a function of electron beam parameters, initial simulations were carried out using the Monte-Carlo scattering code FLUKA, version 4.2.1 with PRECISIOn settings and the PHOTONUC card enabled for muon pair production. To reduce the simulation run-time, an artificial energy threshold of 10 MeV for the transport of electrons, positrons, and photons within the converter target was introduced using the EMFCUT card. All simulations reported in this section assumed a pencil-like monoenergetic electron beam with 109 primaries and recorded the spectrum, total yield, and emission angle of the muons escaping the rear surface of the converter (assumed to be lead hereafter). While a higher number of primaries would result in a better statistical representation of the phenomena studied here, we note that this number of primaries is sufficient to support the conclusions of this article and is representative of typical electron beam charges obtainable in a laser-wakefield accelerator. Further increasing the number of primaries would result in simulations that would be too intensive from a computational point of view, without adding significant qualitative insight. In this section, when presenting data as muon yield or total muon count, we are referring to both negative and positive muons. Figure 1 shows the energy-integrated muon yield as a function of the thickness of the converter target for an electron energy of 2 (frame a.) and 5 (frame b.) GeV. Within the statistical uncertainties associated with the low probability of muon production, both cases show that the muon yield generally increases as a function of target thickness up to approximately 2 cm; beyond that, the muon yield is seen to depend more weakly on the target thickness. Based on these initial simulations, we will assume a 2 cm lead converter target hereafter, since a thicker target could in principle generate a marginally higher number of muons, but at the cost of an increased divergence. For an electron energy of 2 GeV (7 ± 1) × 10–8 muons per electron are obtained, with this number increasing to (1.85 ± 0.10) × 10–6 muons per electron for a 5 GeV electron beam. As an example, assuming a realistic total charge in the electron beam of 1 nC, this translates to a total of 400 ± 60 muons for a 2 GeV electron beam and (1.16 ± 0.06) × 104 muons for a 5 GeV electron beam.
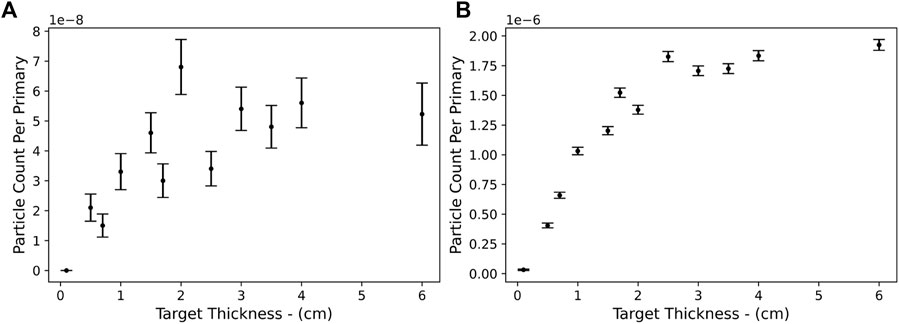
FIGURE 1. Energy-integrated number of muons (negative and positive) per primary electron as a function of converter thickness for (A) a 2GeV and (B) a 5GeV electron beam.
As expected, the number of produced muons is directly proportional to the number of primary electrons. However, the number of muons is observed to scale quadratically with the energy of the primary electron beam, as shown in Figure 2. This can be qualitatively explained by considering that muon production is a two-step process, mediated by the intermediate generation of a high-energy photon. For future laser-driven muon sources, this demonstrates already the importance of giving priority to maximising electron beam energy rather than overall charge in the electron beam.
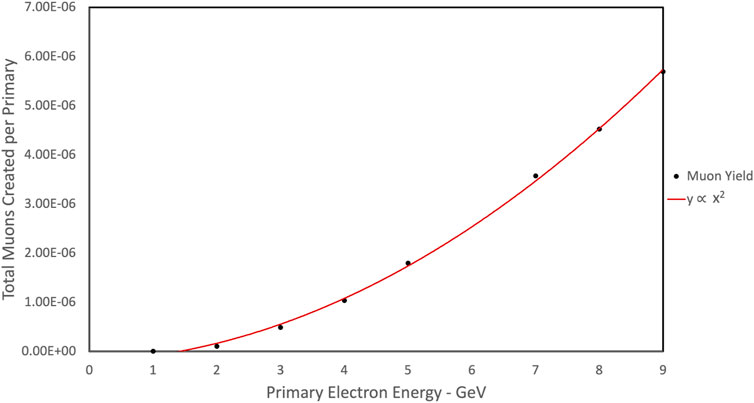
FIGURE 2. Simulated muon yield (black dots) as a function of the energy of the primary electron beam incident on a 2 cm lead target, fitted with a quadratic function (red line). Both positive and negative muons are considered.
Muon energy spectra for 2GeV, 5GeV and 10GeV primary electron beams at the exit of a 2 cm lead target are shown in Figure 3. In all cases, the muon spectrum is well fitted by a relativistic maxwellian distribution peaking at an energy that is approximately between 1/4 and 1/5 of the energy of the primary electron beam. The peak energy of the muon distributions can again be qualitatively explained by considering the two-step nature of the muon generation process within the converter.

FIGURE 3. Muon energy spectra for (A) 2GeV (B) 5GeV (C) 10GeV primary electron energies incident on 2 cm of lead. All simulated data are well fitted by a relativistic Maxwellian distribution (dashed blue lines). Both positive and negative muons are considered.
Another important aspect for the capture and use of these muon beams is their emission cone angle from the solid target. This is shown in Figure 4 for three different energies of the primary electron beam. As expected, lower energy muons tend to be emitted within a larger cone angle. The divergence of the muon is linked to the ratio of the muon’s energy to the primary electron beam energy, as already observed for electron-positron pair production in similar conditions [8].

FIGURE 4. Correlation between the energy of the emitted muons (negative muons in blue and positive muons in red) and their angle of emission with respect to the target normal for different energies of the primary electron beam: (A) 2GeV (B) 5GeV and (C) 10GeV and for a 2 cm lead converter.
As mentioned previously, the main obstacle in muon detection in a laser-driven setup is the noise generated at the converter target, mainly comprising of electrons, positrons, and gamma rays. As an example, the energy distributions of scattered electrons and generated positrons and gamma-rays for a 2GeV primary electron beam interacting with a 2 cm lead target is shown in Figure 5. Assuming a 1 nC primary electron beam, Figure 5 shows that the total amount of secondary electrons, positrons and gamma rays is of the order of 109 which is several orders of magnitude higher than the number of muons. As theoretically expected and numerically observed in similar conditions (see, e.g., [30, 31])), the particle spectra are well approximated by a relativistic Maxwellian distribution. To account for this source of noise, a first proof-of-principle beamline designed to separate this noise from the muon signal is provided in the next section.
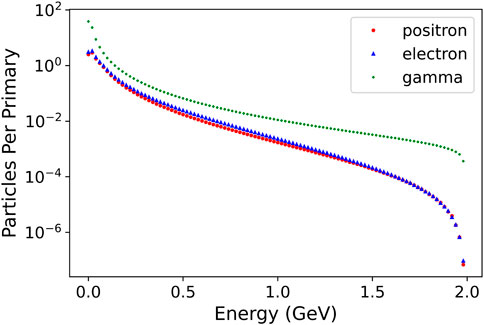
FIGURE 5. Spectrum of electrons (blue), positrons (red) and gamma-rays (green) at the rear surface of a 2 cm lead target irradiated with a 2 GeV electron beam. Statistical error of the data is smaller than the marker size in this figure.
In order to effectively separate the laser-driven muons from noise, a first proof-of-principle beamline has been designed, which comprises two quadrupole magnets and a chicane magnetic dipole arrangement to divert the muon beam around a large attenuating block made of high Z material. The magnetic components are chosen to mainly capture the peak of the muon spectrum and must therefore be adapted to the energy of the primary electron beam. As an example of the feasibility of such a configuration, we show in this section FLUKA simulations of the setup assuming a 2 GeV primary electron beam. Given the symmetry in the muon− and muon+ populations, we will focus here on detecting the muon +, since these will co-travel with positrons generated at the converter target, which are always lower in number compared to the scattered electrons. For a 2 GeV primary electron beam, a series of preliminary simulations indicate that the best configuration in terms of maximising muon signal over background at the detector plane is obtained for two quadrupoles both with strength B/ℓ = 1.4 T/cm and 10 cm in length, four dipole magnets each with a strength of Bℓ = 0.4 Tm and two lead blocks, one placed in between the chicane to attenuate the on-axis gamma-ray beam from bremsstrahlung (75 cm thickness), and one at the end of the chicane (30 cm thickness), to block any residual noise arriving onto the detector plane. A small magnetic dipole (strength Bℓ = 0.1 Tm) is also placed in between the final lead block and the detector plane to deflect away any low-energy electron or positron still emerging from the final lead block.
A side view of the muon trajectories through such a setup is shown in Figure 6A. In this simulation, we assume a 2 GeV electron beam impinging onto a 2 cm target placed at (0,0) in the simulation box. The muon+ particles are effectively guided through the chicane and suffer negligible scattering through the final lead block. A symmetric chicane can in principle be placed on the other side to capture also the negative muons. The spectrum of the positive muons crossing the detector plane is shown in Figure 6B. For a 2 GeV electron beam, up to 100 muons per nC of primary electron beam reach the detector plane, with a kinetic energy of 100–400 MeV, implying a collection efficiency of the beamline of the order of 25%. The efficiency could be readily doubled by mirroring the chicane configuration around the main beam axis, in order to capture the negative muons as well.

FIGURE 6. Side view of muon trajectories (A) and muon spectrum per primary electron (B) at the detector plane for a 2GeV primary electron beam incident on 2 cm lead target. The parameters of the beamline are given in the main text.
For direct comparison, the spatial distribution of positrons, electrons, and photons throughout the same setup is shown in Figure 7. The maps show photons with an energy larger than 100 eV and electrons and positrons with an energy larger than 1 keV. A preliminary set of simulations indicated that 75 cm of lead are sufficient to completely stop the bremsstrahlung radiation generated at the converter. Therefore, in order to reduce the—otherwise excessive—computational cost of these simulations, here the bremsstrahlung photon beam has been artificially stopped at the entrance of the lead block in the middle of the chicane. Nonetheless, approximately 5,000 photons per nC still reach the detector plane. These photons are generated via secondary processes during the interaction of scattered electrons and positrons with the rest of the setup, mainly with the final lead block in front of the detector plane (see Figure 6A, for the position of each element in the setup). The electrons are mainly deflected away by the first dipole magnet, and only electrons arising from the interaction of positrons with the final lead block might reach the detector plane. The maps shown in Figure 6; Figure 7 show side-view particle distributions integrated along the transverse axis over 2 cm, which is assumed to be the typical size of the detector (see next section). When looking at the number of electrons and positrons reaching a detector area of 10 × 2 cm, no positrons are recorded and only a few isolated electrons reach the detector plane (see Figure 7). Since the simulation used 109 primaries, this implies that the number of electrons reaching the detector is thus of the order of 10–9 per primary electron (e.g., of the order of 10 electrons per 1 nC of primary electron beam). Some photons do reach the detector though. The simulations indicate approximately 5,000 photons with an energy per photon of the order of 1–3 MeV, to be compared with approximately 100 muons with an energy of 100–400 MeV (Figure 6B). The spectrum and transverse spatial distribution of the photons at the detector plane are shown in Figure 8, indicating a rather uniform background of photons with MeV-scale energy. As shown in the following, the high-energy muons can be discerned from the low energy photons with a silicon-based detector.
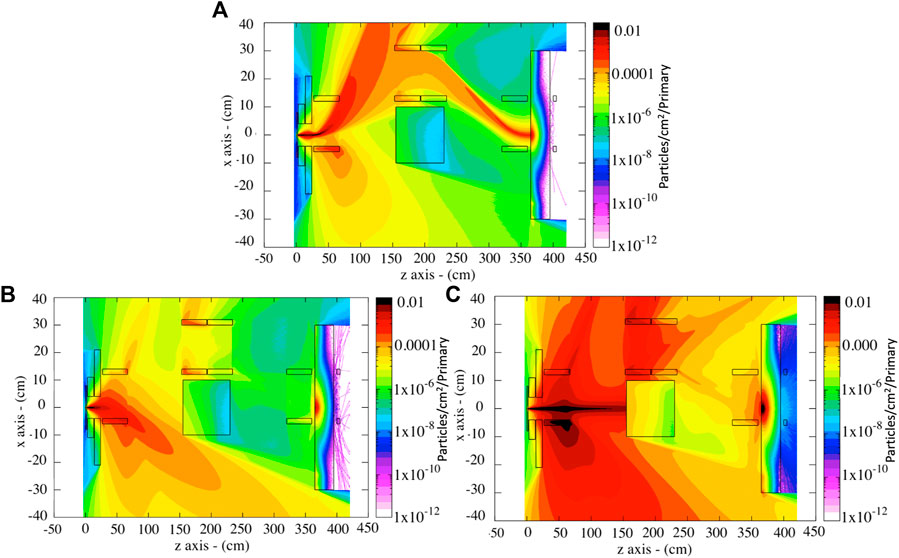
FIGURE 7. Side-view of the spatial distribution of (A) positrons (B) electrons and (C) gamma-rays throughout the same experimental setup shown in Figure 6A.
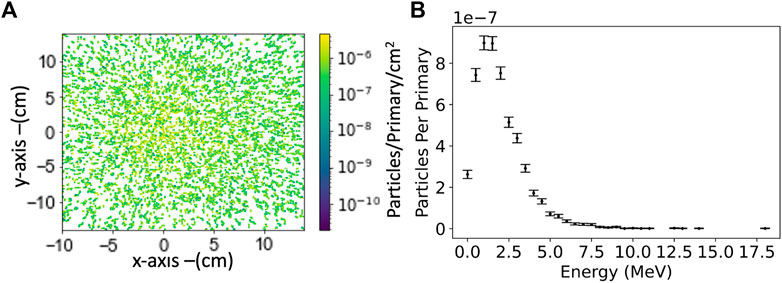
FIGURE 8. (A) 2D distribution of photons at the detector plane at the end of the chicane beamline using a 2GeV 100pC primary electron beam. (B) Corresponding energy distribution of the gamma-rays reaching the detector.
While the beamline has been designed to attenuate most noise particles, the problem of muon detection above noise still remains, with the largest contribution to noise coming from photon signal. Scintillator screens or image plates would produce similar signal for an incident high-energy photon or relativistic muon, making it hard to distinguish muon signal from the photon background. Alternatively, a common muon detection technique is based on using nuclear track detectors such as CR-39 [32] which are insesitive to photons. For example, they have been recently used for muon detection at the ISIS facility at the Rutherford Appleton Laboratory [33]. However, the muons created in our beamline are not expected to deposit enough energy in the CR-39 to break molecular bonds and create tracks for detection. It has been shown that to create tracks in CR-39 a particle must have a linear energy transfer of at least 15 KeV/μm [34]. Muons deposit this much energy per μm only if they have MeV-scale kinetic energy; relativistic muons have a much lower linear energy transfer, effectively ruling out CR39 detectors for the kind of experiments modelled here.
A detector that shows promise for muon detection is the timepix single particle detector [35]. These detectors consist of a silicon chip containing 256 × 256 55 micron pixels. This allows for the measurement of energy deposited on each pixel and the energy spatial distribution to be detected across the chip. FLUKA simulations have been used to investigate the energy deposited by muons, electrons and gamma rays on these detectors. Figure 9 shows the energy deposited for each of these particles plotted against the particle’s kinetic energy. The energy range for these simulations has been chosen according to the expected energies of each particle reaching the detector plane from the simulations in the previous section (e.g., in the region of 1–3 MeV for the photons and in the region of 100–400 MeV for the muons). The simulations recorded the energy deposited by 1 particle incident on a silicon material with bins in a 256 × 256 pixel arrangement across the material’s surface. The particle incident on the chip will deposit energy over multiple pixels and the pixel with the peak energy detected is stored and averaged over 104 simulations to provide an accurate particle energy deposition value. Simulations indicate that a relativistic muon would deposit approximately three times the energy deposited by a 1–5 MeV photon. This, combined with the low photon density (which effectively rules out the possibility of two photons arriving onto the same pixel) and uniform spatial distribution at the detector plane, allows for the muon signal to be separated from noise.

FIGURE 9. FLUKA simulation results showing energy deposited by a single particle on a timepix detector plotted against the particles’ kinetic energy for (A) muon+ (B) electrons and (C) gamma-ray particles. Each data point is a result of an average over 104 simulated events, with the standard deviation reported as a vertical error bar.
To illustrate the feasibility of using this beamline for radiographic applications, further FLUKA simulations were performed using as an input the numerical results for the muon population obtained at the end of the chicane in Section 3 (Figure 6). As a proof-of-principle example, this muon beam was simulated to irradiate 2 Uranium blocks contained within a lead cube 8 cm in length with 2 cm thick walls (see Figures 10A,B).
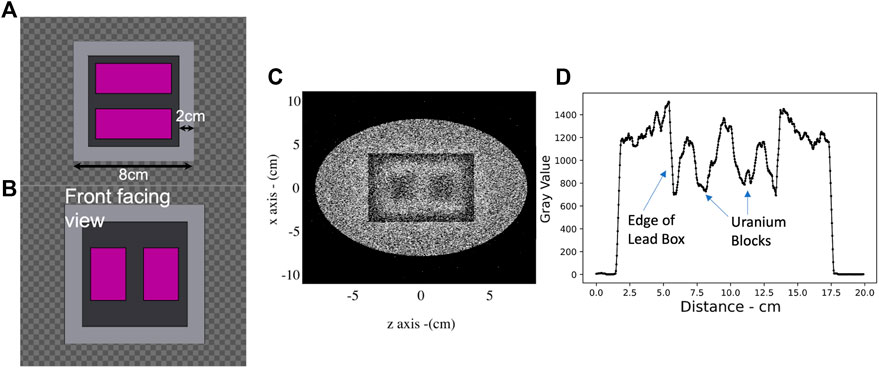
FIGURE 10. FLUKA simulated muon radiography of two uranium blocks concealed within a lead box of 2 cm wall thickness. (A) and (B) in-scale top view and front view of the box (grey) and uranium (purple) inside. (C) Face-on muon distribution at the detector plane after the lead container. Darker regions represent lower muon signal, in linear scale. (D) Lineout of the muon distribution along the z-axis, clearly showing the lead box walls and the position of the uranium blocks. From this simulation, the spatial resolution of the radiography is of the order of 6 mm.
The detector plane was placed after the lead cube and numerous simulations were performed to determine the number of muons required to obtain a clearly resolved image of the uranium blocks.
Figure 10C presents the image obtained using 105 muons. Figure 10D shows a lineout of the muon spatial distribution along the z axis. The lead walls and the regions where the uranium blocks are located are clearly visible with a spatial resolution of the order of 6 mm, even though with a certain level of fluctuation due to the relatively low statistics associated with the low muon yield. Assuming a 1 nC, 2 GeV primary electron beam, this image can thus be obtained by accumulating approximately 1,000 shots. For example, using a 1Hz laser system, this would translate to an acquisition time of approximately 16 min. As shown in the previous section, the strong dependence of muon yield on the energy of the primary electron beam implies that using a higher energy electron beam will result in a much shorter acquisition time, as shown in more detail in Section 6.
As an example of the applicability of these results to modern high-power laser facilities, we have investigated what muon beam parameters will be produced by the 10-PW line at the Extreme Light Infrastructure - Nuclear Physics (ELI-NP) pillar, which has recently demonstrated laser capability at this power [23]. While ELI-NP is expected to produce electron beams with an overall charge well in excess of 1 nC, we will first consider 1 nC as an example primary electron beam, due to the direct proprtionality between muon yield and electron beam charge.
The laser wakefield acceleration process generating the multi-GeV electron bunch was simulated by means of quasi-3D PIC simulations with the FB-PIC code [26]. The laser is modelled as a linearly polarised 24 fs FWHM long pulse (central wavelength λ0 = 0.815 μm) delivering 110 J of encircled energy on target from the initial beam full energy of 240 J. The laser is focused down to a waist of w0 = 50 μm resulting in a peak intensity of I = 1.1 × 10²⁰ W/cm2. The He − N2 target gas mixture was confined in a 4 cm long gas-cell which provided a radially flat density profile within the maximum simulation radius of 4 × w0 and a 4 cm long flat longitudinal profile with up/down ramps with lengths of 1 mm. The optimal target density and composition for maximum charge and energy was found, with the aid of a preliminary set of simulations, to be of 1.1 × 1017 cm−3 for helium and 0.28 × 1017 cm−3 for nitrogen. The resulting background electron plasma density was ne = 5.0 × 1017 cm−3 right before the main pulse arrival, due to the full ionization of helium and the partial ionization up to the fifth level of nitrogen. The simulation cylinder, containing the m = 0, m = 1 and m = 2 rotational modes for the fields was 120 μm long with a radius of 200 μm, with longitudinal and radial resolution of dz = λ0/24 and dr = λ0/4, respectively. The full-3D phase-space for the particles was sampled with Nz × Nr × Nθ = 2 × 2 × 12 = 48 particles per cell. Finally, the laser pulse was injected as the propagation on focus of a supergaussian pulse in the near field with order N = 8, to better mimic the realistic radial distribution of the fluence on the focusing spherical mirror.
Figure 11 shows snapshots of the electric field and electron density after 12.8 mm of propagation through the plasma, revealing the onset of a blowout region behind the laser pulse, typical of the bubble regime [36]. Matched conditions for a stable pulse propagation over several Reyleigh lengths was found to be very close to the prescription in [37] for a bubble of radius R ≃ w0, i.e.,
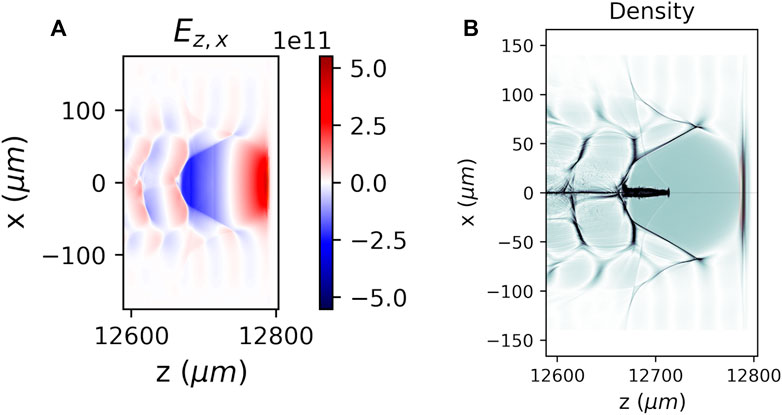
FIGURE 11. Snapshot of the FB-PIC simulation after the propagation of 12.8 mm in the plasma. The laser pulse is propagating from left to right. (A) Cut of the longitudinal electric field (in V/m) on the laser polarization x − z plane. (B) Cut of the charge density (a.u.) on the x − z plane. The trapped and accelerated electron beam is visible inside the blowout structure just behind the laser.
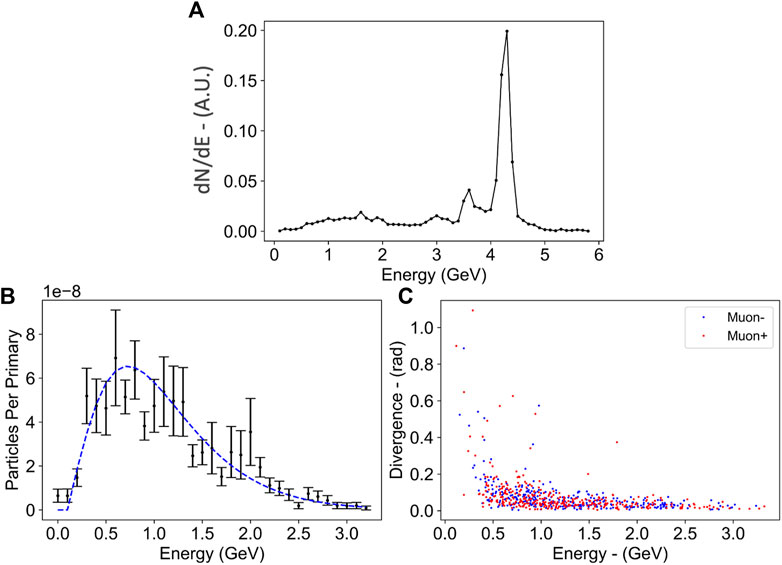
FIGURE 12. (A) Electron spectrum predicted from Particle-In-Cell simulations following LWFA driven by the 10PW laser at ELI-NP. (B) Muon energy spectrum and (C) emission angle versus energy after the electron beam in frame (A) interacts with a 2 cm lead converter.
This electron beam was then directly used as an input for the Monte-Carlo simulations, where the beam interacted with a 2 cm lead target. The characteristics of the generated muons are shown in Figure 12. The muon spectrum is well fitted by a relativistic Maxwellian distribution with a peak energy of 0.7 GeV. The muon beam has an average half-cone angle divergence of 75 mrad (Figure 12C) with low energy muons being more divergent than high energy muons.
The propagation of such a muon source through an experimental setup as the one discussed in Section 3 was then simulated using the Monte-Carlo scattering code FLUKA, using again 109 primaries with the energy spectrum shown in Figure 12A to model the primary electron beam. Given the higher muon energy, the dipole magnets had to be changed and have now a strength of Bℓ = 0.6 Tm with all the other simulation parameters kept the same. Figure 13A presents a side-view of the muon trajectories through the whole setup, similar to the ideal case for 2 GeV shown in Figure 6. The energy distribution of positive muons reaching the detector plane is shown in Figure 13B. The muon energy peaks at approximately 0.6 GeV and a total of 1.49 × 10⁻⁷ muons per primary is recorded. Assuming a 1 nC primary electron beam, this translates to approximately 900 positive muons reaching the detector plane per shot; with a laser operating at 1 Hz, a radiography with the same contrast as the one shown in Figure 10 would then be obtained within 2 min. The 10PW line at ELI-NP is designed to operate at one shot per minute; based on the PIC simulations reported here, a 12 nC electron beam will result in approximately 104 muons per shot, resulting in an acquisition time to produce a radiography similar to the one shown in Figure 10 of the order of 10 min.
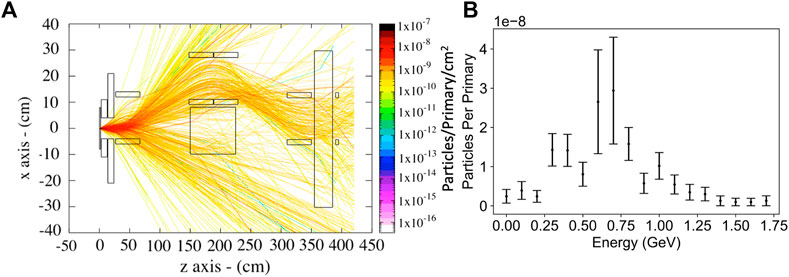
FIGURE 13. Side view of muon trajectories (A) and muon spectrum per primary electron (B) at the detector plane for a primary electron beam as shown in Figure 12A incident on 2 cm lead target. The parameters of the beamline are given in the main text.
While the chicane beamline presented here provides results with a very good signal to noise making the detection of the muons relatively easy, it is at the same time quite expensive and requires a very large area to fit the 4 large dipoles of the chicane along with a quadrupole arrangement. In order to provide a first proof-of-principle detection of laser-driven muons, a much simpler configuration can be designed, where only one dipole magnet is used. In this simpler configuration, we can assume a 10 × 10 cm2 lead block on one side of the converter target and a Bℓ = 1.3 Tm dipole magnet. The silicon detector can then be placed behind a shielding configuration consisting of 10 cm of plastic followed by 30 cm of lead. Results from FLUKA simulations of the setup, still assuming the primary electron beam shown in Figure 12A, are shown in Figure 14. Even a simple configuration as the one assumed here allows for approximately 3 × 10⁻⁸ positive muons per primary electron impinging onto the detection area of a Timepix detector. For a 1 nC electron beam, this translates to approximately 200 muons per shot. The simulations also indicate a similar level of noise at the detector as the cases discussed above, arising from MeV-scale electrons and photons (approximately 140 electrons and 1,200 photons for a 1 nC primary electron beam), which could again in principle be discarded by looking at the different energy deposition onto a silicon-based detector (see Section 4).
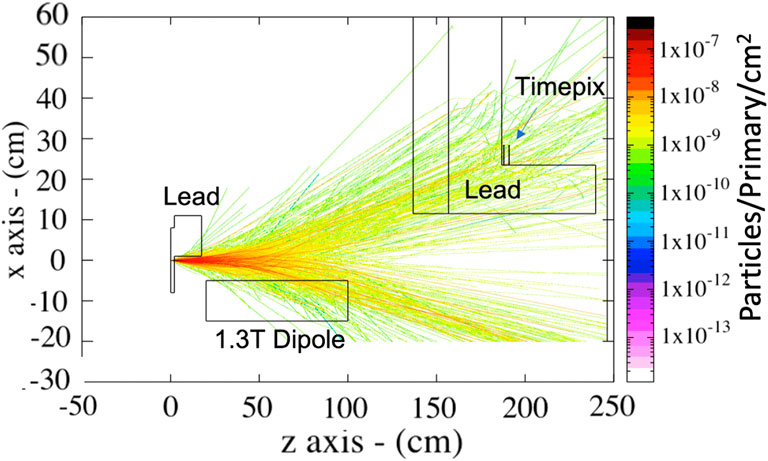
FIGURE 14. (A) Side view of the trajectories of the muons generated after the interaction of an electron beam with a spectrum shown in Figure 12A.
We have presented numerical modelling of muon generation and transport following the interaction of GeV-scale laser-wakefield accelerated electron beams with cm-scale lead targets. The dependence of the muon characteristics on the electron beam and target properties have been shown, identifying 2 cm as a suitable thickness to achieve a high muon yield without an excessive increase in divergence. A proof-of-principle beamline has also been shown, able to effectively separate muon signal from background noise arising from by-products generated inside the lead target. The output muon beam from this beamline has been demonstrated to be suitable for meaningful radiographic applications. As an example of the characteristics of muon beams that can be generated at multi-PW laser facilities, we have shown the expected performance of the 10PW line at the Extreme Light Infrastructure—Nuclear Physics (ELI-NP) laser facility. Numerical modelling indicates that multi-PW laser facilities have the potential to provide radiographies of high-Z materials with relatively high spatial resolution and contrast in a matter of minutes.
The raw data supporting the conclusion of this article will be made available by the authors, without undue reservation.
GS devised the idea and the set of simulations in consultation with RD. The FLUKA simulations were performed and analysed by LC, whereas the FBPIC simulations were performed and analysed by PT. DD and PT provided guidance on the ELI-NP expected performance, whereas DM contributed to the simulations of the detector properties. The manuscript has been written by GS and LC, with input from all the other authors. All authors contributed to the article and approved the submitted version.
GS wishes to acknowledge support from EPSRC (grant Nos.: EP/V049186/1 and EP/V044397/1). LC is funded via an i-CASE PhD studentship partly funded by EPSRC and partly by DSTL. Extreme Light Infrastructure Nuclear Physics (ELI-NP) Phase II, is a project co-financed by the Romanian Government and the European Union through the European Regional Development Fund and the Competitiveness Operational Programme (1/07.07.2016, COP, ID 1334). This work was supported by the contract sponsored by the Ministry of Research and Innovation: PN 23 21 01 05, and the IOSIN funds for research infrastructures of national interest.
The authors declare that the research was conducted in the absence of any commercial or financial relationships that could be construed as a potential conflict of interest.
All claims expressed in this article are solely those of the authors and do not necessarily represent those of their affiliated organizations, or those of the publisher, the editors and the reviewers. Any product that may be evaluated in this article, or claim that may be made by its manufacturer, is not guaranteed or endorsed by the publisher.
1. Esarey E, Schroeder CB, Leemans WP. Physics of laser-driven plasma-based electron accelerators. Rev Mod Phys (2009) 81:1229–85. doi:10.1103/RevModPhys.81.1229
2. Lundh O, Lim J, Rechatin C, Ammoura L, Ben-Ismaïl A, Davoine X, et al. Few femtosecond, few kiloampere electron bunch produced by a laser–plasma accelerator. Nat Phys (2011) 7:219–22. doi:10.1038/nphys1872
3. Wang W, Li W, Liu J, Zhang Z, Qi R, Yu C, et al. High-brightness high-energy electron beams from a laser wakefield accelerator via energy chirp control. Phys Rev Lett (2016) 117:124801. doi:10.1103/PhysRevLett.117.124801
4. Hussein A, Senabulya N, Ma Y, Streeter M, Kettle B, Dann S, et al. Laser-wakefield accelerators for high-resolution x-ray imaging of complex microstructures. Scientific Rep (2019) 9:3249. doi:10.1038/s41598-019-39845-4
5. Gonsalves AJ, Nakamura K, Daniels J, Benedetti C, Pieronek C, de Raadt TCH, et al. Petawatt laser guiding and electron beam acceleration to 8 gev in a laser-heated capillary discharge waveguide. Phys Rev Lett (2019) 122:084801. doi:10.1103/PhysRevLett.122.084801
6. Kneip S, McGuffey C, Martins JL, Martins SF, Bellei C, Chvykov V, et al. Bright spatially coherent synchrotron x-rays from a table-top source. Nat Phys (2011) 6:980–3. doi:10.1038/nphys1789
7. Alejo A, Samarin GM, Warwick JR, Sarri G. Laser-wakefield electron beams as drivers of high-quality positron beams and inverse-compton-scattered photon beams. Front Phys (2019) 7. doi:10.3389/fphy.2019.00049
8. Alejo A, Samarin GM, Warwick J, McCluskey C, Cantono G, Ceccotti T, et al. Non-invasive characterisation of a laser-driven positron beam. Plasma Phys Controlled Fusion (2021) 62:055013. doi:10.1088/1361-6587/ab7e81
9. Underwood CID, Baird CD, Murphy CD, Armstrong CD, Thornton C, Finlay OJ, et al. Development of control mechanisms for a laser wakefield accelerator-driven bremsstrahlung x-ray source for advanced radiographic imaging. Plasma Phys Controlled Fusion (2020) 62:124002. doi:10.1088/1361-6587/abbebe
10. Sarri G, Corvan D, Schumaker W, Cole J, Di Piazza A, Ahmed H, et al. Ultrahigh brilliance multi-mev γ-ray beams from nonlinear relativistic thomson scattering. Phys Rev Lett (2014) 113:224801. doi:10.1103/PhysRevLett.113.224801
11. McAnespie C, Streeter MJV, Rankin M, Chaudhary P, McMahon SJ, Prise KM, et al. High-dose femtosecond-scale gamma-ray beams for radiobiological applications. Phys Med Bioogy (2022) 7:085010. doi:10.1088/1361-6560/ac5bfd
12. Pak T, Rezaei-Pandari M, Kim SB, Lee G, Wi DH, Hojbota CI, et al. Multi-millijoule terahertz emission from laser-wakefield-accelerated electrons. Light: Sci Appl (2023) 12:37. doi:10.1038/s41377-022-01068-0
13. Li Y, Feng J, Wang W, Tan J, Ge X, Liu F, et al. Micro-size picosecond-duration fast neutron source driven by a laser–plasma wakefield electron accelerator. High Power Laser Sci Eng (2022) 10:e33. doi:10.1017/hpl.2022.27
14. Rao BS, Jeon JH, Kim HT, Nam CH. Bright muon source driven by GeV electron beams from a compact laser wakefield accelerator. Plasma Phys Controlled Fusion (2018) 60:095002. doi:10.1088/1361-6587/aacdea
15. Breunlich W, Kammel P, Cohen J, Leon M. Muon-catalyzed fusion. Annu Rev Nucl Part Sci (1989) 39:3–15. doi:10.1016/0375-9474(90)90458-x
16. Gorringe T, Hertzog D. Precision muon physics. Prog Part Nucl Phys (2015) 84:73–123. doi:10.1016/j.ppnp.2015.06.001
17. Doble T, Gatignon L, von Holtey G, Novoskoltsev F. The upgraded muon beam at the sps. Nucl Instrum Methods Phys Res A (1993) 343:351–62. doi:10.1016/0168-9002(94)90212-7
18. Workman RL, Burkert VD, Crede V, Klempt E, Thoma U, Tiator L, et al. Review of particle physics. Prog Theor Exp Phys (2022) 2022:083C01. doi:10.1093/ptep/ptac097
19. Morishima K, Kuno M, Nishio A, Kitagawa N, Manabe Y, Moto M, et al. Discovery of a big void in khufu’s pyramid by observation of cosmic-ray muons. Nature (2017) 552:386–90. doi:10.1038/nature24647
20. Tsai YS. Pair production and bremsstrahlung of charged leptons. Rev Mod Phys (1974) 46:815–51. doi:10.1103/RevModPhys.46.815
21. Nelson W, Kase K. Muon shielding around high-energy electron accelerators: Part i. theory. Nucl Instr Methods (1974) 120:401–11. doi:10.1016/0029-554X(74)90005-6
22. Sarri G, Schumaker W, Di Piazza A, Vargas M, Dromey B, Dieckmann ME, et al. Table-top laser-based source of femtosecond, collimated, ultrarelativistic positron beams. Phys Rev Lett (2013) 110:255002. doi:10.1103/physrevlett.110.255002
23. Gales S, Tanaka K, Balabanski D, Negoita F, Stutman D, Ur C, et al. The extreme light infrastructure—nuclear physics (ELI-NP) facility: New horizons in physics with 10 PW ultra-intense lasers and 20 MeV brilliant gamma beams. Rep Prog Phys (2018) 81:094301. doi:10.1088/1361-6633/aacfe8
24. Fonseca R, Silva L, Tsung F, Decyk V, Lu W, Ren C, et al. (2002). Osiris: A three-dimensional, fully relativistic particle in cell code for modeling plasma based accelerators. International conference on computational science. 342–51. doi:10.1007/3-540-47789-6_36
25. Arber T, Bennett K, Brady C, Lawrence-Douglas A, Ramsay M, Sircombe N, et al. Contemporary particle-in-cell approach to laser-plasma modelling. Plasma Phys Controlled Fusion (2015) 57:113001. doi:10.1088/0741-3335/57/11/113001
26. Lehe R, Kirchen M, Andriyash IA, Godfrey BB, Vay JL. A spectral, quasi-cylindrical and dispersion-free particle-in-cell algorithm. Comp Phys Commun (2016) 203:66–82. doi:10.1016/j.cpc.2016.02.007
27. Ahdida C, Bozzato D, Calzolari D, Cerutti F, Charitonidis N, Cimmino A, et al. New capabilities of the fluka multi-purpose code. Front Phys (2022) 9:788253. doi:10.3389/fphy.2021.788253
28. Battistoni G, Boehlen T, Cerutti F, Chin PW, Esposito LS, Fassò A, et al. Overview of the fluka code. Ann Nucl Energ (2015) 82:10–8. doi:10.1016/j.anucene.2014.11.007
29. Vlachoudis V. Flair: A powerful but user friendly graphical interface for fluka. In: Proc. Int. Conf. on Mathematics, Computational Methods and Reactor Physics (M&C 2009); May 2009; Saratoga Springs, New York (2009). p. 790–800.
30. Sarri G, Calvin L, Streeter M. Plasma-based positron sources at eupraxia. Plasma Phys Control Fusion (2012) 64, 044001.
31. Sarri G, Poder K, Cole JM, Schumaker W, Di Piazza A, Reville B. Generation of neutral and high-density electron–positron pair plasmas in the laboratory. Nat Commun (2015) 6, 6747441.
32. Zhou D. Methods using cr-39 plastic nuclear track detectors in radiation research. Nucl Track Detectors: Des Methods Appl (2010) 1–106.
33. Thomas HSP, Deas RM, Kirkham LN, Dodd PM, Zemaityte E, Hillier AD, et al. Response of nuclear track detector cr-39 to low energy muons. Plasma Phys Control Fusion (2021) 63:124001. IOP. doi:10.1088/1361-6587/ac2558
34. Spurný F, Jadrníčková I. Response of a track-etch-based let-spectrometer to high-energy protons. Radiat Measurements (2005) 40:575–9. Proceedings of the 22nd International Conference on Nuclear Tracks in Solids. doi:10.1016/j.radmeas.2005.03.017
35. Darwish RA, Marcu L, Bezak E. Overview of current applications of the timepix detector in spectroscopy, radiation and medical physics. Appl Spectrosc Rev (2020) 55:243–61. doi:10.1080/05704928.2019.1580202
36. Pukhov A, ter Vehn JM. Laser wake field acceleration: The highly non-linear broken-wave regime. Appl Phys B (2002) 74:355–61. doi:10.1007/s003400200795
Keywords: wakefield acceleration, muon sources, muon radiography, high-power laser, pair production
Citation: Calvin L, Tomassini P, Doria D, Martello D, Deas RM and Sarri G (2023) Laser-driven muon production for material inspection and imaging. Front. Phys. 11:1177486. doi: 10.3389/fphy.2023.1177486
Received: 01 March 2023; Accepted: 06 June 2023;
Published: 19 June 2023.
Edited by:
Changbo Fu, Fudan University, ChinaReviewed by:
Chong Lv, China Institute of Atomic Energy, ChinaCopyright © 2023 Calvin, Tomassini, Doria, Martello, Deas and Sarri. This is an open-access article distributed under the terms of the Creative Commons Attribution License (CC BY). The use, distribution or reproduction in other forums is permitted, provided the original author(s) and the copyright owner(s) are credited and that the original publication in this journal is cited, in accordance with accepted academic practice. No use, distribution or reproduction is permitted which does not comply with these terms.
*Correspondence: Gianluca Sarri, Zy5zYXJyaUBxdWIuYWMudWs=
Disclaimer: All claims expressed in this article are solely those of the authors and do not necessarily represent those of their affiliated organizations, or those of the publisher, the editors and the reviewers. Any product that may be evaluated in this article or claim that may be made by its manufacturer is not guaranteed or endorsed by the publisher.
Research integrity at Frontiers

Learn more about the work of our research integrity team to safeguard the quality of each article we publish.