 Wen-Wei Wang1,2*
 Zhi-Ang Chen1,2Han Zhang1,2Shize Du1,2Rui Wu1,2Chang Qiao1,2
 Shiyin Kuang1,2Xibo Zhang1,2,3,4*
- 1International Center for Quantum Materials, School of Physics, Peking University, Beijing, China
- 2Collaborative Innovation Center of Quantum Matter, Beijing, China
- 3Hefei National Laboratory, Hefei, China
- 4Beijing Academy of Quantum Information Sciences, Beijing, China
Crystalline optical cavities operating at cryogenic temperatures provide a promising route for realizing the next generation of ultrastable lasers with extremely low thermal noise floor. However, it remains challenging to realize a closed-cycle cryostat for cooling a relatively long cavity to very low temperatures. Here we report on the design and experimental realization of a cryostat operating continuously at 3.1 K for an ultrastable 10-cm silicon cavity. Based on a combination of active temperature control and passive thermal damping, we realize at 3.1 K a two-second temperature instability of 6 × 10⁻⁸ K for the cavity. By implementing separate supporting structures for the cryocooler and the sample chamber, we realize vibration control on the 1 × 10⁻⁷g level at one second in each spatial direction, where g is the gravitational acceleration. With all these features, our cryostat can support an ultrastable silicon cavity with instability near its fundamental thermal noise floor at averaging time of 1–50 s. With proper upgrading, our platform holds promise for realizing ultrastable lasers with 3 × 10⁻¹⁷ or better frequency stability, which will in turn enable numerous studies on precision metrology and quantum many-body physics.
Introduction
Ultrastable optical cavities offer a key ingredient for precision measurement science and technology. They have played an important role in fundamental researches such as optical atomic clocks [1–4], gravitational wave detection [5–7], tests of relativistic effects [8, 9] and studies of many-body physics [10, 11]. The thermal noise sets a fundamental limit for the frequency stability of an optical reference cavity and the laser locked onto it [12]. Crystalline optical cavities operating at cryogenic temperatures offer a route for greatly reducing the thermal noise limit, and hold promise for pushing this limit into the 10−18 regime [13–16]. Besides achieving high frequency stability, cryogenic crystalline cavities also exhibit very low frequency drift rate and can be used as optical local oscillators [16–18]. Based on its excellent thermal and mechanical properties at cryogenic temperatures, monocrystalline silicon provides one of the most promising materials for a new generation of ultrastable optical cavities and ultrastable lasers [13–16, 19]. To minimize the frequency instability induced by thermal fluctuation, a silicon cavity should operate either at a zero-crossing temperature (124 K or 17 K) for the coefficient of thermal expansion (CTE) of the silicon material or at very low temperatures near absolute zero where the CTE asymptotically vanishes [20]. Ultrastable lasers locked to 21-cm long silicon cavities operating at 124 K achieved thermal-noise-limited low frequency instability of 4 × 10⁻¹⁷ [14]. Under a much lower operating temperature of 4 K, a relatively short 6-cm silicon cavity also achieved a thermal-noise-limited frequency instability of 6.5 × 10⁻¹⁷ [16], showing the great potential of helium-temperature silicon cavities based on continuously operating closed-cycle cryostats. Such fundamental thermal noise limit can be further improved by making a longer cavity, by operating at even lower temperatures or by developing new coating techniques [21]. However, in order to suppress the technical noise due to thermal fluctuation and vibration [9, 22, 23] to a sufficiently low level, a closed-cycle cryostat with a combination of even lower operating temperature, larger sample space, and sufficiently low thermal fluctuation and vibration has yet to be realized.
In this Letter, we design and experimentally realize a 3-K cryostat for a 10-cm ultrastable silicon cavity. This cryostat aims to simultaneously provide a large sample space, lower-than-4-K working temperature, high thermal stability and low vibrational noise. In the experimental implementation, a 10-cm silicon cavity is cooled down to 3.1 K, supporting a fundamental thermal noise floor of 3 × 10⁻¹⁷ (4 × 10⁻¹⁸) for the cavity based on mirrors with dielectric (crystalline) coating [15, 21, 24]. Based on a combination of active temperature control and passive thermal damping, we realize a high stability for the cavity temperature, with the thermal-fluctuation-induced frequency instability projected to being less than 1 × 10⁻¹⁸ at 2 seconds. Based on a split-support method, we control and measure the vibrational noise near the sample chamber to be on the 1 × 10⁻⁷g level at one second, and estimate that the vibration-induced frequency instability falls below the thermal noise floor (for mirrors with dielectric coating) at 0.6 s, which can be further improved based on the same cryostat and a new cavity geometry. Our work demonstrates a promising platform for realizing ultrastable cryogenic optical cavities with 3 × 10⁻¹⁷ or better frequency stability.
The design
Our customized cryostat presents several innovations with respect to the Montana Instruments standard cryostation with model number s200 [25]. First, we more than double the height of the sample space to provide a sufficiently large volume for accommodating the instrumental assembly for a 10-cm silicon cavity. Second, we design a five-layer cooling structure inside the sample chamber to improve the cooling performance and suppress temperature instability caused by thermal conduction and radiation. Third, we design a multi-layer optical passive shield to simultaneously provide optical access for laser frequency locking and suppress thermal perturbation due to environmental blackbody radiation. These innovations are implemented by Montana Instruments to realize a deeply customized, large-volume, highly stable cryostat with less-than-4-K working temperature.
Figure 1A shows a five-layer cooling structure for the sample chamber. Compared to a standard cryostation s200, here the step-shaped aluminum vacuum shield provides a substantially larger sample space without pressing against the nearby cryocooler (see also Figure 5A). Inside this room-temperature vacuum shield, there are two layers of “active shields”, as well as a three-stage passive structure that consists of two “passive shields” and an innermost cup-shaped supporting structure for the silicon cavity. Each active shield is cooled by a separate cryocooler stage and has independent feedback temperature control. The passive shields are thermal low-pass filters that further damp the temperature fluctuation transferred during the thermal conduction. The cooling of the whole assembly is built on a two-stage Gifford-McMahon closed-cycle cryocooler cold head, which uses helium as the working medium and corresponds to the smallest-capacity 4-K cold head (SHI Cryogenics Group, RDK-101D) with about 160 mW second-stage cooling power at 4.2 K. Accordingly, two active shields are cooled to several tens of Kelvins and a few Kelvins respectively.
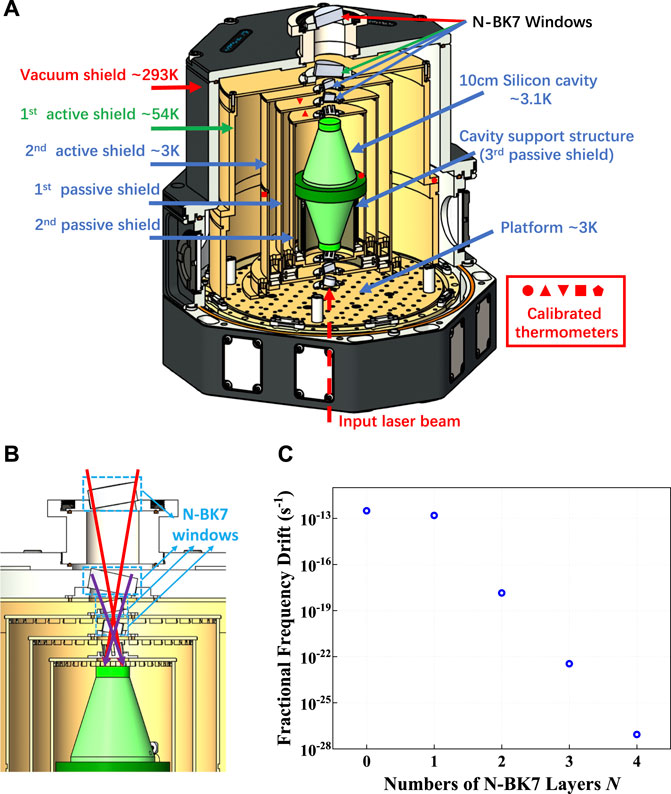
FIGURE 1. Schematic of the customized sample chamber of a 3-K cryostat. (A) Section view of a multi-layer cooling structure. To achieve low temperature and suppress thermal-fluctuation-induced instability, a five-layer cooling structure inside the vacuum shield is designed. From outside to inside, this cooling structure consists of two layers of active shields that are feedback controlled to temperatures of about 54 K and 3 K respectively, as well as two layers of passive shields and an innermost cavity supporting structure, which further provide nested thermal low-pass filters. The 10-cm cavity (in green) has the highest temperature stability. Red solid circle, upper triangle, lower triangle, square and pentagon indicate calibrated temperature sensors on the silicon cavity, the second and first passive shields, the second and first active shields, respectively. (B) Optical passive shield against environmental blackbody radiation. To provide optical access and simultaneously suppress thermal perturbation due to environmental blackbody radiation, on each side of the cavity, two pairs of windows made of N-BK7 glass are incorporated, with center thickness of 10 mm and 6 mm, respectively. The sizes and positions of windows are chosen for reducing the solid angle of environmental radiation leakage. (C) Computed relation between the environmental radiation induced fractional frequency drift rate and the number of N-BK7 windows. Under a sudden environmental temperature change of 1 K, the blackbody radiation leads to a fractional frequency drift rate that decreases rapidly with the addition of more N-BK7 windows.
To ensure that a sample temperature below 4 K be achieved for such a large sample space, the first active layer must be carefully designed. In sharp contrast to having only a thin aluminum layer that is not temperature-controlled in a standard cryostation s200, here we choose high-purity oxygen-free copper for the material of the first active layer, select a relatively large thickness of 5 mm for this layer, polish and gold-plate the surfaces to minimize emissivity, and arrange for an independent feedback control for this layer based on resistive heating. We also add small L-shaped local shields on vacuum pumping holes to eliminate any direct line of view from room-temperature parts to inner helium-temperature layers. Our finite-element simulation shows that, even though the cooling power is provided solely via conduction from the bottom, the excellent thermal conductance throughout the whole layer leads to a temperature inhomogeneity of no more than several Kelvins. The first active layer thus powerfully protects the inner helium-temperature layers against radiative thermal leakage from outer room-temperature parts, and effectively alleviates the workload of the second-stage cryocooler.
The second active shield incorporates a few characteristic features for improving thermal stability and reducing heat leakage. First, similar to the first active shield, the helium-temperature components, including the bottom platform, the second active shield and other inner layers are all made of high-purity oxygen-free copper and are polished and gold-plated. Second, we employ a combination of feedback temperature control and thermal damping techniques. Since the bottom platform is cooled by a nonrigid thermally conducting structure (not shown) connecting to the second-stage cryocooler and has a relatively large temperature fluctuation of about 4 mK (peak to peak), we choose to attenuate the effect of such fluctuation by adding a ring made of holmium copper (HoCu2) between this bottom platform and the second active shield. Based on the large specific heat of HoCu2 (three orders of magnitude larger than that of copper near our operating temperature [26, 27]), an out-of-loop peak-to-peak temperature fluctuation of 0.3 mK can be expected for the second active shield, which shall be further improved by the feedback temperature control using resistive heating. Third, for all thermometers used in the monitoring and feedback temperature control of the helium-temperature layers, the corresponding wires are properly “thermally lagged” to cryogenic stages, namely, these wires are connected either to the first-stage cryocooler or to a “pre-lagged” helium-temperature circuit board. The thermal lagging technique eliminates the room-temperature influence on these thermometer wires and allows for achieving as low a working temperature as possible.
To further suppress the cavity temperature fluctuation at short time scales, we design a three-stage passive thermal damping structure, which can be depicted by a third-order thermal low-pass filter. This damping structure is designed based on a combination of HoCu2, G10 fiber glass, stainless steel, and cooper materials. Here in a number of supporting structures, G10 and stainless steel are used to realize low thermal conductivity and high rigidity at low temperatures; at the same time, HoCu2 is used to increase the heat capacity. The walls of two passive shields are made of gold-plated high-purity oxygen-free copper to improve temperature homogeneity. The innermost cup-shaped support structure of the silicon cavity is made of G10 and stainless steel, providing both a long thermal conduction path and relatively high Young’s modulus for the overall rigidity of the structure [28, 29]. The time constant for the heat conduction between each passive stage and its inner adjacent layer is designed to be on the 103-second scale.
To provide optical access for a narrow-linewidth laser without introducing excessive heat leakage from the environmental blackbody radiation, we design a set of optical passive shield using multiple layers of N-BK7 glass windows (Figures 1A, B) that are anti-reflection coated at the laser wavelength (1,397 nm) and simultaneously absorptive in the bulk for 2.6 μm or longer wavelengths, which effectively blocks the room-temperature blackbody radiation. On each side of the cavity, we arrange for four N-BK7 windows with center thicknesses of 10 mm, 10 mm, 6 mm, 6 mm. To remove undesired etalon effect, each window has a 2.5° wedge angle between its two surfaces and is tilted by 10° or −10° relative to the horizontal plane accordingly to an alternating and symmetric configuration, such that the laser position remains the same after passing through all four windows. We choose the diameters of these windows and design a bulging T-shaped mount for the uppermost window to minimize the solid angle for thermal leakage due to outer blackbody radiation. In Figure 1C, we compute the relation between environmental-radiation-induced fractional frequency drift rate and the number of N-BK7 windows on each side of the cavity. Under a 1-K step change of the environmental temperature, the suddenly altered blackbody radiation leads to a fractional frequency drift for the cavity, which is shown to decrease rapidly with more N-BK7 windows added into the system.
Cooling performance and temperature stability
In the experimental implementation of this cryostat, we achieve a phenomenally low sample temperature of about 3.1 K for the 10-cm silicon cavity; see Figure 2. In Figures 2A, B, a characteristic cooling down process is demonstrated for the cavity and two active shields, where the temperature of each shield is measured by a thin film resistance cryogenic temperature sensor (Lakeshore, Cernox series) with NIST-traceable calibration [30] and typical accuracy of about ± 5 mK at several-Kelvin temperatures. The first active shield cools down from a room temperature of 293 K to its base temperature of 52 K in less than 2 days; see Figure 1A for the sensor position. The second active shield rapidly cools down to 10 K in a single day and then gradually cools down to its base temperature over several days. Due to the third-order thermal low-pass filter between the cavity and the second active shield, the cavity takes the longest period (about 8 days) to cool down to its base temperature. Later we choose a set point of 54 K for the feedback control of the first active shield. Engaging the feedback temperature control for the second active shield also leads to a slight temperature increase of 20 mK for this shield. The cavity temperature T reaches Tf ≈ 3.1 K with all feedback temperature controllers engaged. This low cavity temperature allows for a fundamental thermal noise floor of 3 × 10⁻¹⁷ (based on mirrors with dielectric coating [15, 21, 24]), and at the same time leads to a correspondingly reduced CTE, which is beneficial for suppressing frequency instability caused by temperature fluctuations.
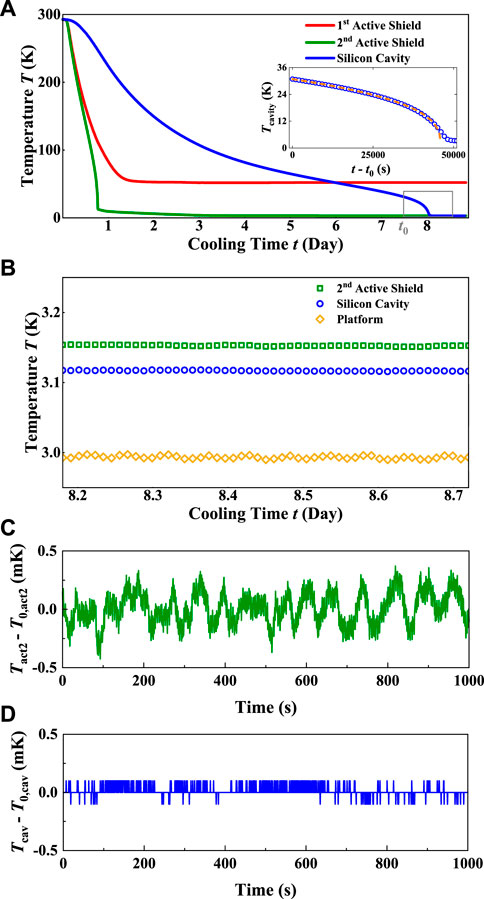
FIGURE 2. Measured cooling performance. (A) Measured cooling process of the silicon cavity and two active shields. Inset: the temperature reduction for the silicon cavity accelerates at temperatures below 30 K, which is due to the significantly decreased specific heat of crystalline silicon. Orange dashed line denotes the fitting based on an analytical model; see Eq. 1. (B) Temperature measurements for the 3-K components. A temperature of about 3.1 K is reached for the silicon cavity after 8 days of cooling. (C) Measured temperature fluctuation of the second active shield with its feedback temperature control engaged. (D) Reading fluctuation of the temperature sensor at the silicon cavity. Typical accuracy of sensors is ± 5 mK at temperatures of several kelvins.
The accelerating temperature reduction of the cavity in its final cooling stage (day 7–8) reflects the significant decrease of its heat capacity as the temperature lowers towards zero; see Figure 2A inset. Our measurement can be compared with a heat conduction model with two premises. First, the silicon heat capacity follows the Debye T3 law when the cavity temperature T is low [33–36], namely, CSi = CT3, where C is a proportionality constant. Second, we estimate that the cooling power (for the silicon cavity) via thermal conduction is at least one order of magnitude larger than the cooling power via thermal radiation for the cavity temperature range of 30 K–10 K. Therefore, when the radiation effect is neglected, the cavity temperature change rate
with tf being a characteristic terminating time. The analytical form in Eq. 1 well depicts the accelerating temperature reduction of the cavity in the 30 ∼ 10 K range where the cavity temperature is still substantially higher than its base value. The fitting of experimental data to Eq. 1 yields a cooling conductivity coefficient A = 1.3 × 10⁻⁵ W/K for the cavity. By contrast, all the cryogenic wires for the temperature sensors correspond to a much lower coefficient of conductivity between the 3-K pre-lagged circuit board and the sensors, which is estimated to be about 2 × 10⁻⁷ W/K based on the wire gauge (36 AWG), wire length (35 cm), wire type (Quad-Twist), and wire material (Phosphor Bronze), confirming negligible thermal influence to the cavity by the wires.
We experimentally determine the time constants for thermal conductance between adjacent 3-K layers based on step-response measurements. As shown in Figure 3A, at t = 0 s and about 1.7 × 10⁴ s, the temperature of the second active shield is rapidly changed by 1 K within tens of seconds. Accordingly, the step temperature response of the cavity and two passive shields are measured, and a third-order low-pass thermal transfer function between the second active shield and the silicon cavity is determined as the following equation:
where
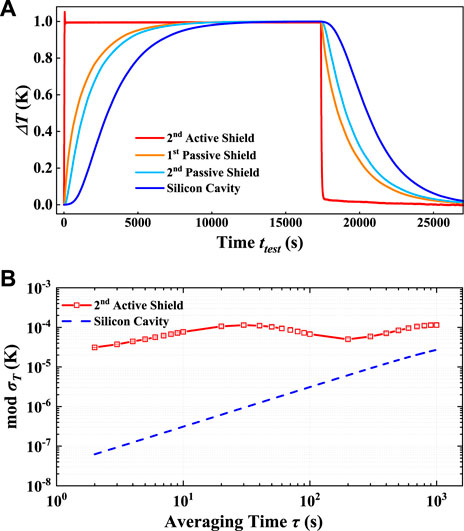
FIGURE 3. Measured heat transfer properties and thermal instability. (A) Determination of thermal transfer properties. At t =0 s and about 1.7×10⁴ s, temperature of the second active shield is rapidly changed by about 1 K within tens of seconds. Accordingly, the step response of the cavity and two passive shields are measured, and the time constants for heat transfer between different 3 K layers are determined; see Eq. 2. (B) Temperature instability. The temperature instability of the second active shield is measured to be 10–4 K or smaller from 2 s to 1,000 s (red squares). Based on Eq. 2, the temperature instability of the silicon cavity (blue dashed line) is computed based on measured temperature instability of the second active shield, reaching 6×10⁻⁸ K at 2 s. Error bars represent 1σ statistical uncertainties.
We study the temperature instability of the silicon cavity based on the measured temperature instability of the second active shield and the thermal transfer function of Eq. 2. Based on feedback temperature control for both the first and second active shields, we achieve an in-loop two-second temperature instability of 0.05 mK and 0.03 mK for the two shields respectively; see also Figure 2C for a sample measurement of temperature fluctuation of the second active shield. Here, the instabilities are characterized by the modified Allan deviation, which is used throughout the rest of this work. As shown in Figure 3B, the temperature instability of the second active shield does not exceed 10–4 K for the averaging time of 2 s–1,000 s. Using the experimentally determined time constants in Eq. 2, the temperature instability of the silicon cavity is computed based on that of the second active shield, reaching 6 × 10⁻⁸ K at 2 s, which is well below the sensor readout noise (Figure 2D).
The combination of the 3.1-K low operating temperature and high thermal stability enables the projected thermal-fluctuation-induced frequency noise to remain well below the fundamental thermal noise floor of the silicon cavity at short time scales. Based on the low CTE of silicon (1.4 × 10⁻¹¹ K−1 at 3.1 K as an example) determined in recent experiments [31, 32] and related studies [29, 38–43], the projected thermal-fluctuation-induced frequency instability remains below the fundamental thermal noise floor (based on mirrors with dielectric coating) for averaging time up to 70 s; see Figure 4. Here we also compute the thermal-fluctuation-induced frequency instability at various operating temperatures from 3.1 K to 6 K, which exhibits significant difference. For example, the CTE of silicon will increase by a factor of 8 if the operating temperature changes from 3.1 K to 6 K. Thus, in order to minimize the influence of thermal fluctuation, it is important to minimize any thermal leakage so as to achieve as low an operating temperature as possible.
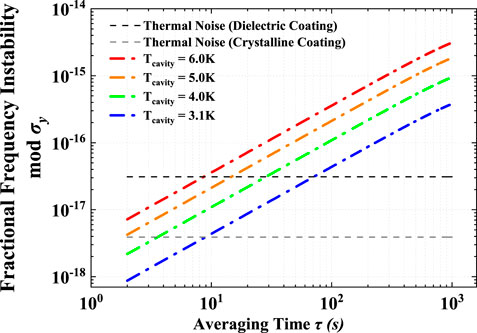
FIGURE 4. Thermal-fluctuation-induced frequency instability inferred from the cavity temperature instability. By multiplying the cavity temperature instability (shown in Figure 3B) and the silicon CTE at a given temperature, the thermal-fluctuation-induced frequency instability (dash dotted line) is computed for a few working temperatures ranging from 3.1 to 6 K, where 3.1 K corresponds to the lowest frequency instability due to the lowest CTE value. Black (gray) dashed line denotes the thermal noise limit of a 10-cm silicon cavity operating at 3.1 K with mirrors of dielectric (crystalline) coating [15, 21, 21,24]. The computations in this figure are based on CTE values measured under 3.1–6 K [31, 32].
Vibration control and measurement
We realize vibration control near the cavity by implementing independent vibration-suppressing supporting structures for the cryocooler and the sample chamber and by minimizing the connections between the two. First, as shown in Figure 5A1, a large and heavy metal block weighing 330 kg is firmly bolted to the concrete on the laboratory ground, which is used for fixing the cryocooler and reducing the associated vibrational noise due to the two-stage cold heads and the compressor (placed in another room). Second, the sample chamber is fixed to a separate vibration control platform (Table Stable, AVI-200-XL-LP) to achieve further suppression of vibrational noise. Third, the connections between the cryocooler and the sample chamber are minimized. In particular, we use a “split-baseplate” structure (Figures 5A2, A3) that is designed by Montana Instruments and has previously been implemented in the system of Ref. 15. The removal of pre-installed shipping support plates (red plates in Figure 5A) can separate the baseplate into two mechanically decoupled halves, one for the cryocooler chassis and the other for the sample chamber, which will further suppress the vibrational noise transferred from the cryocooler to the sample chamber. Due to the extreme care required in removing these support plates, this operation will be performed during the future final optimization of our ultrastable cavity and laser system.
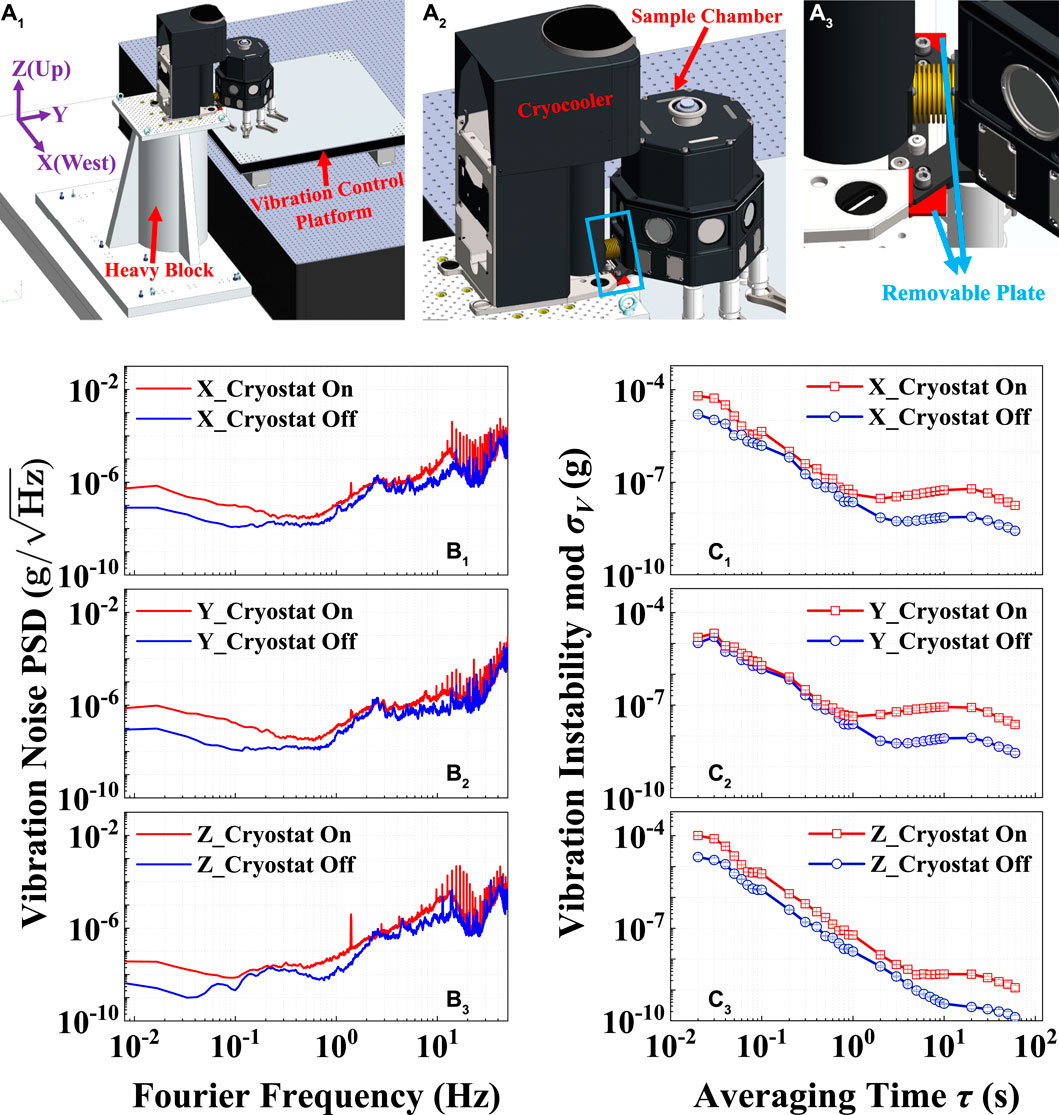
FIGURE 5. Control and measurement of vibrational noise. (A) Schematic of vibration control based on two separate platforms for supporting and fixing the cryocooler and the sample chamber respectively. (A1) A large and heavy metal block weighing 330 kg is firmly bolted to the concrete on the ground and is used for fixing the cryocooler and reducing the vibrational noise due to the two-stage cryocooler cold heads and the compressor (not shown, placed in another room). The sample chamber is fixed to a separate vibration control platform to achieve further suppression of vibrational noise. (A2) The cryocooler and the sample chamber. (A3) An enlarged view of the “split-baseplate” structure, a key feature designed by Montana Instruments; see also the blue box in (A2). The pre-installed red plates currently provide a rigid, protective connection between the sample chamber and the cryocooler. Removing these red plates can further reduce the vibrational noise transferred to the sample chamber. Such plate removal requires extreme care to ensure that the displacements stay within ±0.5 mm in all directions, which shall be carried out in the final optimization of the ultrastable laser system. In (B1–B3,C1–C3), vibrational noise in all directions is measured by a weak motion triaxial broadband seismometer (Güralp 3T-120) placed on the platform supporting the sample chamber. (B) Power spectral densities of the accelerations in three spatial directions, with the pre-installed red plate in place and under the condition of the cryostat being on or off. (C) The corresponding modified Allan Deviations. Error bars represent 1σ statistical uncertainties.
We determine the vibrational noise on the platform supporting the sample chamber based on a weak motion triaxial broadband seismometer (Güralp 3T-120) over a wide low-frequency range down to 8 mHz. The seismometer is placed as close to the sample chamber as possible, with a center-to-center distance of about 24 cm. In the vibration measurements in each spatial direction, we compare the noise power spectral densities with and without the operation of the 3-K cryostat; see Figures 5B1–B3. In addition to contributing a narrow peak at 1.4 Hz in the noise power spectral density, the cryocooler causes noticeable increase in the vibrational noise in the low frequency range from 0.01 Hz to 1 Hz. Such cryocooler-induced vibrational noise can be further characterized by the modified Allan deviation, reaching a stability better than 1 × 10⁻⁷g at one second for each direction, where g is the gravitational acceleration.
Projected total frequency instability and potential improvement
Based on the aforementioned thermal and vibrational measurements, we estimate the total frequency instability of an ultrastable laser tightly locked to this 10-cm silicon cavity operating at 3.1 K. Our noise model takes into account the fundamental thermal noise floor of the silicon cavity, the thermal-fluctuation-induced instability and the vibrational noise. We note that this noise model does not incorporate the effects of other technical noise such as the residual amplitude modulation, laser intensity noise and fiber phase noise, which in principle can be suppressed to a sufficiently low level. Using a conservative estimate of the vibration sensitivities, namely, 2 × 10⁻¹⁰/g in the horizontal direction and 6 × 10⁻¹¹/g in the vertical direction [13, 16], we numerically compute the total frequency instability based on the contributions of the fundamental thermal noise floor, vibrational noise, and thermal fluctuation. Figure 6A shows that our 3-K cryostat has provided a thermally stable, vibrationally low-noise environment with the potential for supporting an ultrastable laser of near-thermal-noise-limited frequency instability under averaging time of 1–50 s (red thick solid line) based on mirrors with dielectric coating. Future improvements are possible based on reducing the vibration sensitivity of the cavity, implementing better mechanical isolation for the sample chamber, and choosing cavity mirrors with ultralow-thermal-noise crystalline coating; see also the blue and green thick solid lines in Figure 6A.
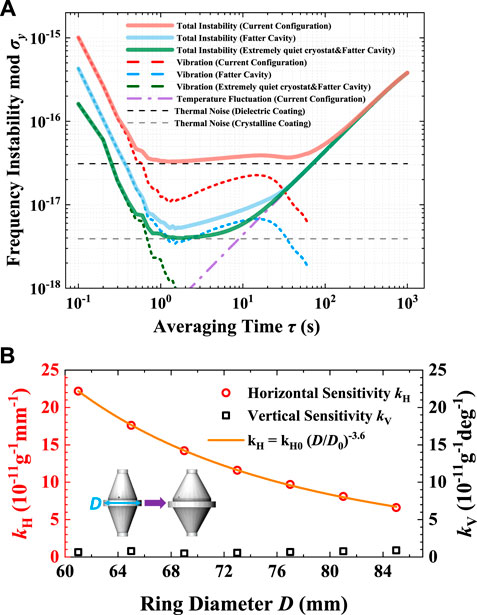
FIGURE 6. Projected total frequency instability and potential improvement. (A) Computed total frequency instability based on a noise model that takes into account the fundamental thermal noise floor of the silicon cavity, the thermal-fluctuation-induced instability and the vibrational noise. Under current experimental conditions, the computed total frequency instability (thick red line) is dominated by the fundamental thermal noise floor of a 10-cm silicon cavity with mirrors of dielectric coating (about 3×10⁻¹⁷) for averaging time of 1∼50 s. (B) Optimization of cavity geometry for reducing the vibration sensitivity in the horizontal direction. By increasing the diameter D in the middle of the cavity (namely, making a “fatter” cavity), we observe in the simulation a substantially smaller horizontal vibration sensitivity kH, whereas the vertical vibration sensitivity kV remains sufficiently small and can be conveniently minimized. The orange line corresponds to a power-law function
Figure 6B showcases one such potential improvement on the horizontal vibration sensitivity by optimizing the cavity geometry, which is fully compatible with our currently implemented cryostat. Based on finite element analysis [44], we perform simulations by increasing the diameter D in the middle of the silicon cavity (namely, making a “fatter” cavity). As D is increased from the current value of 61 mm to large values up to 85 mm, we observe a reduction of the horizontal vibration sensitivity kH by as much as 70%. Within this range, a fitting further shows that kH can be well depicted by a power-law form
Conclusion and discussion
In summary, we design and experimentally realize a cryostat that operates continuously at a phenomenally low temperature of 3.1 K and at the same time provides sufficiently large sample space for a 10-cm ultrastable silicon cavity. The associated high thermal stability and low vibrational noise can well benefit studies on other cryogenic precision systems such as sapphire optical cavities. Our experimental platform, with proper upgrading, holds promise for realizing ultrastable lasers with frequency stability in the low-10–17 regime, which provides enabling tools for precision frequency metrology, the engineering and probing of correlated quantum systems, and the search for exotic physics.
Data availability statement
The original contributions presented in the study are included in the article. Further inquiries can be directed to the corresponding authors.
Author contributions
XZ conceived the project. W-WW, Z-AC, HZ, SD, RW, CQ, and XZ performed the experiments. W-WW, Z-AC, HZ, SK, and XZ performed the numerical computations. All authors contributed to the article and approved the submitted version.
Funding
This work is supported by the Chinese Academy of Sciences Strategic Priority Research Program under Grant No. XDB35020100, the National Key Research and Development Program of China under Grant No. 2018YFA0305601, the National Natural Science Foundation of China under Grant No. 11874073, the Hefei National Laboratory, and the Scientific and Technological Innovation 2030 Key Program of Quantum Communication and Quantum Computer under Grant No. 2021ZD0301903.
Acknowledgments
We are grateful to Wei Zhang, Yige Lin, Xi Lin, and Jie Zhang for very insightful discussions. We thank Montana Instruments for many discussions and technical implementation of our deeply customized cryostat. We also thank Xiao-Hui Shi, John Robinson, Tao Yang, Qiang Wang, Ye Li, Zhen Sun, Tang-Yin Liao, Zhan-Jun Fang, Ping Xu, Xing-Yang Cui, Han-Ning Dai, Yu-Ao Chen, Jian-Wei Pan, and Ke-Lin Gao for discussions and technical support.
Conflict of interest
The authors declare that the research was conducted in the absence of any commercial or financial relationships that could be construed as a potential conflict of interest.
Publisher’s note
All claims expressed in this article are solely those of the authors and do not necessarily represent those of their affiliated organizations, or those of the publisher, the editors and the reviewers. Any product that may be evaluated in this article, or claim that may be made by its manufacturer, is not guaranteed or endorsed by the publisher.
References
1. Ludlow AD, Boyd MM, Ye J, Peik E, Schmidt PO. Optical atomic clocks. Rev Mod Phys (2015) 87:637–701. doi:10.1103/revmodphys.87.637
2. Bloom BJ, Nicholson TL, Williams JR, Campbell SL, Bishof M, Zhang X, et al. An optical lattice clock with accuracy and stability at the 10−18 level. Nature (2014) 506:71–5. doi:10.1038/nature12941
3. Hinkley N, Sherman JA, Phillips NB, Schioppo M, Lemke ND, Beloy K, et al. An atomic clock with 10–18 instability. Science (2013) 341:1215–8. doi:10.1126/science.1240420
4. Jiang YY, Ludlow AD, Lemke ND, Fox RW, Sherman JA, Ma L-S, et al. Making optical atomic clocks more stable with 10−16-level laser stabilization. Nat Photon (2011) 5:158–61. doi:10.1038/nphoton.2010.313
5.The LIGO Scientific Collaboration. LIGO: the Laser Interferometer Gravitational-Wave Observatory. Rep Prog Phys (2009) 72:076901.
6. Adhikari RX. Gravitational radiation detection with laser interferometry. Rev Mod Phys (2014) 86:121–51. doi:10.1103/revmodphys.86.121
7. Kolkowitz S, Pikovski I, Langellier N, Lukin MD, Walsworth RL, Ye J. Gravitational wave detection with optical lattice atomic clocks. Phys Rev D (2016) 94:124043. doi:10.1103/physrevd.94.124043
8. Hils D, Hall JL. Improved Kennedy-Thorndike experiment to test special relativity. Phys Rev Lett (1990) 64:1697–700. doi:10.1103/physrevlett.64.1697
9. Wiens E, Nevsky AY, Schiller S. Resonator with ultrahigh length stability as a probe for equivalence-principle-violating physics. Phys Rev Lett (2016) 117:271102. doi:10.1103/physrevlett.117.271102
10. Martin MJ, Bishof M, Swallows MD, Zhang X, Benko C, Von-Stecher J, et al. A quantum many-body spin system in an optical lattice clock. Science (2013) 341:632–6. doi:10.1126/science.1236929
11. Zhang X, Bishof M, Bromley SL, Kraus CV, Safronova MS, Zoller P, et al. Spectroscopic observation of SU(N)-symmetric interactions in Sr orbital magnetism. Science (2014) 345:1467–73. doi:10.1126/science.1254978
12. Numata K, Kemery A, Camp J. Thermal-noise limit in the frequency stabilization of lasers with rigid cavities. Phys Rev Lett (2004) 93:250602. doi:10.1103/physrevlett.93.250602
13. Kessler T, Hagemann C, Grebing C, Legero T, Sterr U, Riehle F, et al. A sub-40-mHz-linewidth laser based on a silicon single-crystal optical cavity. Nat Photon (2012) 6:687–92. doi:10.1038/nphoton.2012.217
14. Matei DG, Legero T, Häfner S, Grebing C, Weyrich R, Zhang W, et al. 1.5 μm lasers with sub-10 mHz linewidth. Phys Rev Lett (2017) 118:263202. doi:10.1103/physrevlett.118.263202
15. Zhang W, Robinson JM, Sonderhouse L, Oelker E, Benko C, Hall JL, et al. Ultrastable silicon cavity in a continuously operating closed-cycle cryostat at 4 K. Phys Rev Lett (2017) 119:243601. doi:10.1103/physrevlett.119.243601
16. Robinson JM, Oelker E, Milner WR, Zhang W, Legero T, Matei DG, et al. Crystalline optical cavity at 4 K with thermal-noise-limited instability and ultralow drift. Optica (2019) 6:240. doi:10.1364/optica.6.000240
17. Hagemann C, Grebing C, Lisdat C, Falke S, Legero T, Sterr U, et al. Ultrastable laser with average fractional frequency drift rate below 5 × 10⁻¹⁹/s. Opt Lett (2014) 39:5102. doi:10.1364/ol.39.005102
18. Eugen Wiens TM, ChangKwong J, Schiller S. A simplified cryogenic optical resonator apparatus providing ultra-low frequency drift. Rev Scientific Instr (2020) 91:045112. doi:10.1063/1.5140321
19. Matei DG, Legero T, Grebing C, Häfner S, Lisdat C, Weyrich R, et al. A second generation of low thermal noise cryogenic silicon resonators. J Phys Conf Ser (2016) 723:012031. doi:10.1088/1742-6596/723/1/012031
20. Hagemann C. Ultra-stable laser based on a cryogenic single-crystal silicon cavity. Hanover, Germany: The Gottfried Wilhelm Leibniz University Hannover (2013). Ph.D. thesis.
21. Cole GD, Zhang W, Martin MJ, Ye J, Aspelmeyer M. Tenfold reduction of Brownian noise in high-reflectivity optical coatings. Nat Photon (2013) 7:644–50. doi:10.1038/nphoton.2013.174
22. Seel S, Storz R, Ruoso G, Mlynek J, Schiller S. Cryogenic optical resonators: A new tool for laser frequency stabilization at the 1 Hz level. Phys Rev Lett (1997) 78:4741–4. doi:10.1103/physrevlett.78.4741
23. Ye Y, He L, Sun Y, Zhang F, Wang Z, Lu Z, et al. Vibration property of a cryogenic optical resonator within a pulse-tube cryostat. Sensors (2021) 21:4696. doi:10.3390/s21144696
24. Cole GD, Zhang W, Bjork BJ, Follman D, Heu P, Deutsch C, et al. High-performance near- and mid-infrared crystalline coatings. Optica (2016) 3:647. doi:10.1364/optica.3.000647
25.Reliable Cryogenic Environments (2010). Commercial products are identified for technical clarity. Such identification does not imply endorsement by the authors. Available from: http://montanainstruments.com/
27. Lemmon E, Huber M, McLinden M. NIST standard reference database 23: Reference fluid thermodynamic and transport properties-REFPROP (2007). Version 8.0.
28. Kasen MB, MacDonald GR, Beekman DH, Schramm RE. Advances in cryogenic engineering materials. Berlin, Germany: Springer (1980). p. 235–44.
29.NIST. Cryogenic Material Properties Calculators. Available from: https://trc.nist.gov/cryogenics/calculators/propcalc.html/
30.International Temperature Scale of 1990 (ITS-90) or the Provisional Low Temperature Scale (PLTS-2000) as appropriate. The calibrations are traceable to the National Institute of Standards and Technology (NIST, United States), the National Physical Laboratory (NPL, United Kingdom), the Physikalisch Technische Bundesanstalt (PTB, Germany), or natural physical constants (1990). Available from: https://www.lakeshore.com/
31. Wiens E, Chen Q-F, Ernsting I, Luckmann H, Rosowski U, Nevsky A, et al. Silicon single-crystal cryogenic optical resonator. Opt Lett (2014) 39:3242. doi:10.1364/ol.39.003242
32. Wiens E, Chen Q-F, Ernsting I, Luckmann H, Rosowski U, Nevsky A, et al. Silicon single-crystal cryogenic optical resonator: Erratum. Opt Lett (2015) 40:68. doi:10.1364/ol.40.000068
33. Ashcroft NW, Mermin ND. Solid state physics. Massachusetts, United States: Thomson Learning (1976).
35. Flubacher P, Leadbetter AJ, Morrison JA. The heat capacity of pure silicon and germanium and properties of their vibrational frequency spectra. Phil Mag (1959) 4:273–94. doi:10.1080/14786435908233340
36. Abe H, Kato H, Baba T. Specific heat capacity measurement of single-crystalline silicon as new reference material. Jpn J Appl Phys (2011) 50:11RG01. doi:10.7567/jjap.50.11rg01
38.NIST (1997). Cryogenics. Available at: https://trc.nist.gov/cryogenics/materials/Silicon/Silicon.htm.
39. Lyon KG, Salinger GL, Swenson CA, White GK. Linear thermal expansion measurements on silicon from 6 to 340 K. J Appl Phys (1977) 48:865–8. doi:10.1063/1.323747
40. Roberts RB. Thermal expansion reference data: Silicon 300-850 K. J Phys D: Appl Phys (1981) 14:L163–6. doi:10.1088/0022-3727/14/10/003
41. Swenson CA. Recommended values for the thermal expansivity of silicon from 0 to 1000 K. J Phys Chem Reference Data (1983) 12:179–82. doi:10.1063/1.555681
42. White GK, Minges ML. Thermophysical properties of some key solids: An update. Int J Thermophys (1997) 18:1269–327. doi:10.1007/bf02575261
43. Karlmann PB, Klein KJ, Halverson PG, Peters RD, Levine MB, Van Buren D, et al. Linear thermal expansion measurements of single crystal silicon for validation of interferometer based cryogenic dilatometer. AIP Conf Proc (2006) 824:35–42.
44. Chen L, Hall JL, Ye J, Yang T, Zang E, Li T. Vibration-induced elastic deformation of Fabry-Perot cavities. Phys Rev A (2006) 74:053801. doi:10.1103/physreva.74.053801
Keywords: precision measurement, ultrastable laser, cryogenic optical cavity, cryostat, vibration control, thermal stability
Citation: Wang W-W, Chen Z-A, Zhang H, Du S, Wu R, Qiao C, Kuang S and Zhang X (2023) Design and realization of a 3-K cryostat for a 10-cm ultrastable silicon cavity. Front. Phys. 11:1176783. doi: 10.3389/fphy.2023.1176783
Received: 28 February 2023; Accepted: 30 May 2023;
Published: 22 June 2023.
Edited by:
Shou-Gang Zhang, National Time Service Center (CAS), ChinaReviewed by:
Guanjun Xu, Chinese Academy of Sciences (CAS), ChinaMeng Khoon Tey, Tsinghua University, China
Copyright © 2023 Wang, Chen, Zhang, Du, Wu, Qiao, Kuang and Zhang. This is an open-access article distributed under the terms of the Creative Commons Attribution License (CC BY). The use, distribution or reproduction in other forums is permitted, provided the original author(s) and the copyright owner(s) are credited and that the original publication in this journal is cited, in accordance with accepted academic practice. No use, distribution or reproduction is permitted which does not comply with these terms.
*Correspondence: Wen-Wei Wang, d3d3YW5nQHBrdS5lZHUuY24=; Xibo Zhang, eGlib0Bwa3UuZWR1LmNu