 Ying Zou1*
 Li-Jen Chen2
 Brian M. Walsh3Brandon Burkholder2,4Yuzhang Ma5
 William A. Bristow6
 Larry R. Lyons7
 Jiang Liu7,8
 Sheng Tian8
 Sneha Yadav8Antea J. Coster9Kathryn A. McWilliams10
- 1Johns Hopkins University Applied Physics Laboratory, Laurel, MD, United States
- 2NASA Goddard Space Flight Center, Greenbelt, MD, United States
- 3Department of Mechanical Engineering and Center for Space Physics, Boston University, Boston, MA, United States
- 4Goddard Planetary Heliophysics Institute, University of Maryland Baltimore County, Baltimore, MD, United States
- 5Shandong Provincial Key Laboratory of Optical Astronomy and Solar-Terrestrial Environment, Institute of Space Sciences, Shandong University, Weihai, China
- 6Department of Meteorology and Atmospheric Science, Pennsylvania State University, University Park, PA, United States
- 7Department of Atmospheric and Oceanic Sciences, University of California, Los Angeles, Los Angeles, CA, United States
- 8Department of Earth, Planetary and Space Sciences, University of California, Los Angeles, Los Angeles, CA, United States
- 9Massachusetts Institute of Technology Haystack Observatory, Westford, MA, United States
- 10Department of Physics and Engineering Physics, University of Saskatchewan, Saskatoon, SK, Canada
Introduction: Magnetopause reconnection is known to impact the dayside ionosphere by driving fast ionospheric flows, auroral transients, and high-density plasma structures named polar cap patches. However, most of the observed reconnection impact is limited to one hemisphere, and a question arises as to how symmetric the impact is between hemispheres.
Methods: We address the question using interhemispheric observations of poleward moving radar auroral forms (PMRAFs), which are a “fossil” signature of magnetopause reconnection, during a geomagnetic storm. We are particularly interested in the temporal repetition and spatial structure of PMRAFs, which are directly affected by the temporal and spatial variation of magnetopause reconnection. PMRAFs are detected and traced using SuperDARN complemented by DMSP, Swarm, and GPS TEC measurements.
Results: The results show that PMRAFs occurred repetitively on time scales of about 10 min. They were one-to-one related to pulsed ionospheric flows, and were collocated with polar cap patches embedded in a Tongue of Ionization. The temporal repetition of PMRAFs exhibited a remarkably high degree of correlation between hemispheres, indicating that PMRAFs were produced at a similar rate, or even in close synchronization, in the two hemispheres. However, the spatial structure exhibited significant hemispherical asymmetry. In the Northern Hemisphere, PMRAFs/patches had a dawn-dusk elongated cigar shape that extended >1,000 km, at times reaching >2,000 km, whereas in the Southern Hemisphere, PMRAFs/patches were 2–3 times shorter.
Conclusion: The interesting symmetry and asymmetry of PMRAFs suggests that both magnetopause reconnection and local ionospheric conditions play important roles in determining the degree of symmetry of PMRAFs/patches.
1 Introduction
Magnetic reconnection at Earth’s magnetopause impacts the dayside ionosphere in a number of ways. The reconnection electric field maps to the ionospheric cusp and drives ionospheric plasma to flow across the open-closed magnetic field line boundary [1–4]. The plasma flows continue in the open field line region, and depending on their characteristics, they are named as flow/convection channels [5–8], flow bursts [9–13], or pulsed ionospheric flows (PIFs) [14–16]. These flows are connected to reconnected flux tubes at the magnetopause via Alfvén waves that carry field-aligned currents (FACs) down the magnetic field lines [12,17]. The upward FAC illuminates as auroral transients, which are often identified as poleward-moving auroral forms (PMAFs) [18]. The electron precipitation associated with PMAFs causes ionization, electron heating and ion upflow in the F-region ionosphere [19], and Joule heating is enhanced in the E-region ionosphere [20]. Emerging from the most poleward edge of PMAFs are polar cap patches [21,22], which are high-density plasma structures in the polar F-region ionosphere, with typical horizontal extension from 100 to 1,000 km [23,24]. The association between PMAFs and polar cap patches has been interpreted as the strong localized Joule heating of PMAFs driving plasma to upwell from below to F-region altitudes. The upwelled plasma is then transported into the polar cap by the anti-sunward convection forming patches [21]. Alternatively, it has been suggested that the soft particle precipitation of PMAFs causes impact ionization, and the resultant enhanced F-region density forms patches [22].
A question arises as to how symmetric the impact is between hemispheres. The answer remains elusive because obtaining good simultaneous measurements in both hemispheres is difficult and most of the observed reconnection impact is limited to one hemisphere. All-sky imagers (ASIs) that detect PMAFs and polar cap patches often only operate in winter where the sky is dark, unsuitable for interhemispheric comparison. The global radar network SuperDARN is promising since radars operate in all seasons. However, interhemispheric observations are still limited because the backscatter echoes of SuperDARN are often too patchy to compare on a point-by-point basis between conjugate magnetic latitudes and local times. Nevertheless, among the few interhemispheric observations made under southward Interplanetary Magnetic Field (IMF) conditions, [2] noted a significant asymmetry in the dayside average flow direction, where the main flows rotate in opposite directions in north and south, as expected from the effect of the IMF By component. The authors further found an asymmetry in the latitude of the open-closed field line boundary, with the summer cusp at higher latitude. Wild et al. [25] additionally showed that the flows just poleward of the open-closed field line boundary are pulsed, and that the pulsations exhibit a remarkable correspondence between hemispheres. The correspondence suggests that the flows in the two hemispheres have a common source at the magnetopause.
Several more events have been reported for northward IMF. [26,27], and [28] found that the reverse sunward flows associated with lobe reconnection are significantly faster in the summer hemisphere than winter hemisphere. Yakymenkoet al. [28] also found an asymmetry in the flow direction where the sunward flows deviate more from the midnight-noon meridian in the summer than winter hemisphere.
Besides the aforementioned ionospheric flow and optical features, magnetopause reconnection also drives poleward-moving radar auroral forms (PMRAFs). PMRAFs are poleward-moving regions of enhanced backscatter power seen by HF radars [29–31] that often occur near local noon and poleward of the dayside auroral oval. Using space-ground coordinated observations, PMRAFs are found to occur in conjunction with flux transfer events (FTEs) at the high latitude magnetopause [32] and pulsed particle signatures in the mid-altitude cusp [31]. A careful inspection reveals that PMRAFs originate near the footprint of spacecraft that detects FTEs and then propagate into the polar cap [32]. This implies that PMRAFs are “fossils” of ionospheric structuring that takes place at the ionospheric footprint of magnetopause reconnection.
Compared with other ionospheric features seen in SuperDARN HF radars (e.g., flow/convection channels, flow bursts, PIFs), PMRAFs have less strict observational requirement and serve as a promising candidate to study the hemispheric symmetry and asymmetry of reconnection impacts. The fossil property of PMRAFs allows reconnection impacts to be studied and traced in the polar cap, where the radar Field-of-View (FOV) fans out and becomes broad. In comparison, other ionospheric features are mostly confined to regions around the cusp, where they may be missed or only partially captured by the radars. Moreover, PMRAFs are detected based on radar backscatter power, which is not critically dependent on the look direction of the radar. Other ionospheric features, mostly those based on flow signatures, need to have a significant velocity component along the radar look direction in order to be detected, which is not always easily satisfied.
This paper therefore investigates the hemispheric symmetry and asymmetry of the impact of magnetopause reconnection on the dayside ionosphere as revealed by PMRAFs under a steady and due southward IMF during a geomagnetic storm. We are particularly interested in the temporal repetition and spatial structure of PMRAFs in the two hemispheres, which are directly affected by the temporal and spatial variation of magnetopause reconnection. Despite the small IMF By component, PMRAFs still show interesting asymmetry, indicating an important role played by local ionospheric conditions. During the event, MMS crossed the magnetopause in proximity to the southern cusp and detected multiple boundary layers as well as kinetic signature of reconnection [33]. The current paper complements [33] by reporting the macroscopic impact of magnetopause reconnection in the ionosphere and its symmetry and asymmetry between hemispheres.
It is noteworthy that the ionosphere structure causing the enhanced backscatter power of PMRAFs has not been unambiguously determined. Milanet al. [29] observed that PMRAFs emerge as a continuation of the poleward portion of PMAFs where the intensity of PMAFs becomes faint. As mentioned earlier, a structure that has also been found to emanate from the poleward portion of PMAFs is polar cap patches. The potential connection between PMRAFs and patches is strengthened in [30], where high-density patches were observed simultaneously with PMRAFs. One limitation of [30] is the limited overlap between the latitudes where PMRAFs and patches were observed. Instead, the PMRAFs lay poleward of the patches. Generally speaking, enhanced HF backscatter indicates plasma instability regions [34], and polar cap patches are subject to the gradient drift instability [e.g., [35–37]], current convective instability [38], and Kelvin-Helmholts instability [39,40] due to their large plasma density gradients and speed [41]. In observations, patches are frequently found to be associated with SuperDARN backscatter [42–44]. The current paper will therefore also test the connection between PMRAFs and polar cap patches.
The paper is organized as follows: Section 2 lists the datasets employed in the study. Section 3 presents the solar wind driving conditions. Section 4 presents the occurrence of PMRAFs in the two hemispheres, their association with reconnection-related ionospheric flows, and their 2-D morphology. Section 5 explores the relation between PMRAFs and polar cap patches based on conjunctions between SuperDARN and DMSP as well as GPS Total Electron Content (TEC) measurements. Section 6 addresses the hemispheric symmetry and asymmetry of PMRAFs, and discusses the possible causes. Section 7 contains a conclusion of the study.
2 Datasets
We study PMRAFs by taking advantage of the global SuperDARN radar network. Figure 1 presents the Field-of-Views (FOVs) of the radars to be analyzed in the AACGM-v2 coordinates [45]. The footprint of the field line threading MMS is also marked. We have examined all available SuperDARN data, and the radars in Figure 1 are selected because they have captured the key properties of PMRAFs. For instance, the DCE-MCM radar pair in the Southern Hemisphere traced the transpolar propagation of PMRAFs (Figure 3), and in the Northern Hemisphere, it is the combination of the CVW, PGR, and INV radars that traced the transpolar propagation (Figure 4). The joint FOVs of the RKN and INV radars in the Northern Hemisphere revealed the 2-D spatial structure of PMRAFs (Figure 5). This is also where DMSP spacecraft traversed the polar cap, providing space-ground coordinated observations for testing the relation between PMRAFs and polar cap patches (Figure 7). The RKN-INV radar pair mainly covered the polar region >80° MLAT, and the CLY FOV extended slightly equatorward. The CLY radar had good conjunctions with GPS TEC measurements, serving as an alternative dataset for assessing the relation between PMRAFs and polar cap patches (Figure 8). Last but not the least, the MCM and INV radars monitored PMRAFs in the southern and northern polar cap, respectively, offering conjugate observations for understanding the hemispheric symmetry and asymmetry of PMRAFs (Figures 9, 10).
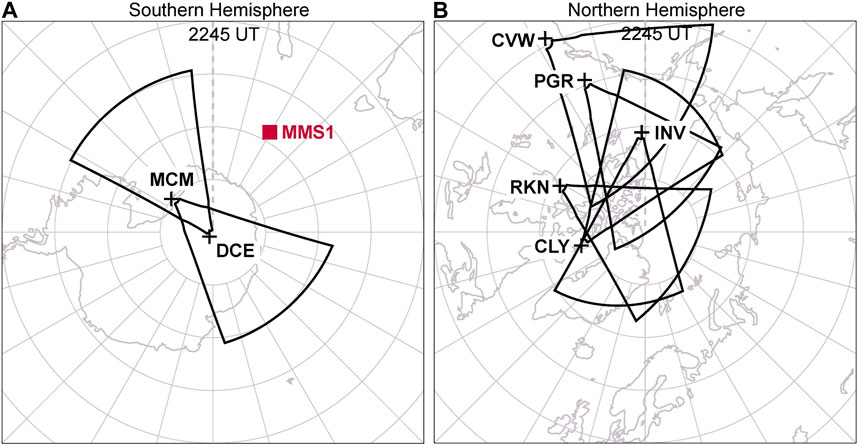
FIGURE 1. Field-of-Views (FOVs) of the SuperDARN radars analyzed in the current study at 2245 UT. This is also the time when MMS entered the magnetopause boundary layer from the magnetosheath [33]. Panel (A) is for the Southern Hemisphere, and Panel (B) is for the Northern Hemisphere. The plots are shown in AACGM-v2 geomagnetic latitude-MLT coordinates with magnetic noon at the top. The footprint of field line threading MMS1 is marked by the red square.
We identify polar cap patches using DMSP, Swarm, and GPS TEC measurements. The DMSP spacecraft provide ion density, ion and electron temperature, cross-track ion drifts, magnetic field, and precipitating electrons and ions. The Swarm spacecraft provide electron density, electron temperature, ion drifts, and magnetic field. The vertical GPS TEC measurements describe the total number of electrons contained in a cylinder of cross-sectional area 1 m2 that extends vertically above a given point on Earth and extends all the way through the ionosphere [46]. Global maps of TEC are generated at MIT Haystack Observatory using a global network of GPS receivers and accessible from the Madrigal database.
3 Solar wind driving conditions
Figure 2 presents the solar wind conditions on 20 December 2015. A geomagnetic storm initiated at 0313 UT, and reached its peak activity at 2249 UT with a minimum SYM-H value at −170 nT. The interval of interest, as shaded in pink, occurred around the peak of the storm. The interval started at 2000 UT, when good radar echoes were simultaneously available from a wide range of radars, although the limited radar measurements before this time indicate that the PMRAF activity can be traced back to 1400 UT if not earlier. The interval ended at 2400 UT, when the dense radar coverage rotated far away from noon. The initiation of the storm was associated with a sudden enhancement of the solar wind dynamic pressure (Figure 2B), and the IMF stayed strongly southward throughout the storm main phase (Figure 2C). The enhanced dynamic pressure was associated with elevated solar wind density, as the solar wind velocity only shows small variations (Figure 2F). The IMF clock angle, defined as the angle between IMF projection on the Y-Z plane and the Z-axis of GSM (Figure 2D), mostly fluctuated between 160° and 190° during the interval as shaded in blue, the median value being 177°. Similarly, the IMF cone angle, defined as the angle between the IMF direction and the Sun-Earth line, mostly varied between 70° and 80°, the median value being 74°. The clock and cone angles therefore confirm that the driving IMF was quasi-steady and close to being due southward throughout the interval of our interest.
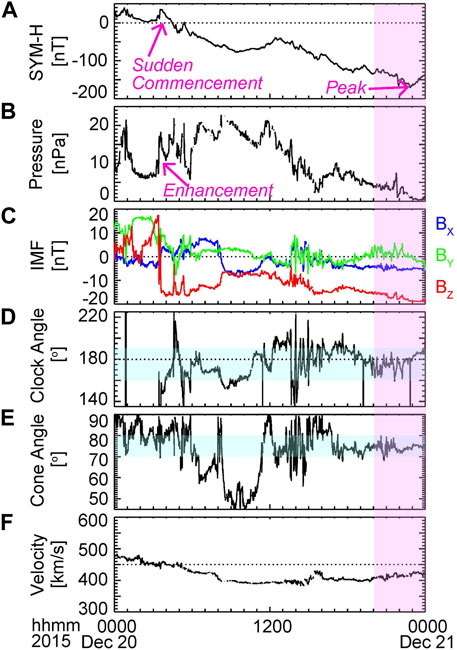
FIGURE 2. Overview of the geomagnetic storm on 20 December 2015. From top to bottom (A–F) shows the SYM-H index, solar wind dynamic pressure, IMF in GSM coordinates, IMF clock angle, IMF cone angle, and solar wind speed. The interval under analysis is shaded in pink.
4 PMRAF occurrence, association with PIFs, and 2-D morphology
In this section, we present the occurrence of PMRAFs in the two hemispheres, their association with reconnection-related ionospheric flows, and their 2-D morphology based on SuperDARN observations. Figures 3A, B present the occurrence and transpolar propagation of a series of PMRAFs in the Southern Hemisphere based on the SuperDARN radar backscatter power. The selection of the radar beam for plotting is based on which beam captured the clearest structures (same for below). During the interval of interest, some of the SuperDARN radars operated in a special mode named Radiation Belt Storm Probes (RBSP) mode, where high cadence data of ∼19 s are available along three camping beams. The priority of beam selection will further be given to those camping beams. An example of the camping beam is the MCM beam 3 in Figure 3A (RBSP mode until 2200 UT). In comparison, the DCE radar in Figure 3B was not operated in the RBSP mode and the data were only available at 2-min cadence.
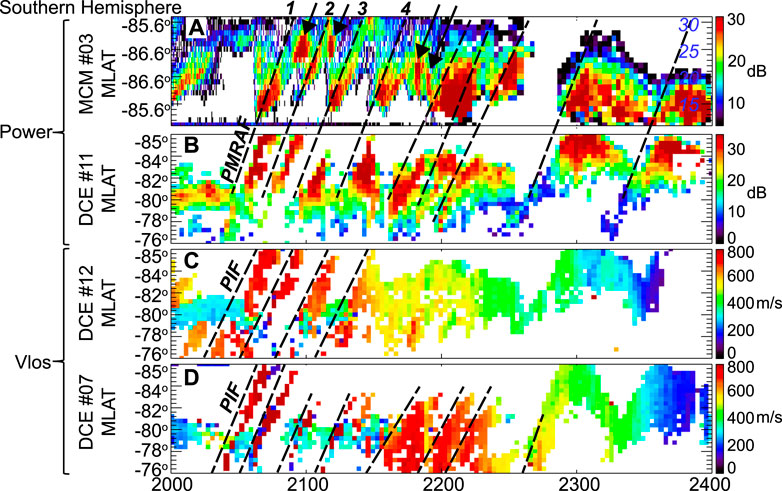
FIGURE 3. Occurrence of PMRAFs and PIFs in the Southern Hemisphere. From top to bottom (A–D) shows radar backscatter power along Beam 03 of the MCM radar, backscatter power along Beam 11 of the DCE radar, and line-of-sight (LOS) velocity along Beam 12 and Beam 07 of the DCE radar. Positive LOS velocities indicate plasma moving away from the radar. Traces of poleward-propagating PMRAFs and PIFs are delineated by the black dashed lines. The first four PMRAFs are also numbered, which are used in Figure 10 to illustrate the 2-D spatial structure of PMRAFs. PMRAFs that emerged within the MCM FOV without a clear source in the DCE FOV are marked by the arrows.
In Figures 3A, B, PMRAFs, as delineated by the black dashed lines, appeared as traces of strong backscatter originating between −78° and −82° MLAT in the FOV of the DCE radar and moving continuously poleward into the FOV of the MCM radar. Note that the latitude of the MCM radar measurements first decreases (e.g., see tick values from −85.6° to −86.6°) and then increases (e.g., from −86.6° to −85.6°). This is because with increasing range gate (shown in blue on the right axis) the FOV extends from the dayside into the nightside polar cap. Figure 3A also contains strong backscatter echoes that suddenly emerged within the MCM FOV without a clear source within the DCE FOV, as marked by the black arrows. The DCE radar may have either missed the source of these PMRAFs due to the low cadence data, or these PMRAFs may have formed outside the DCE FOV and entered the MCM FOV at a later stage of their transpolar propagation. The high-cadence MCM data suggest that the PMRAFs recurred on a time scale on the order of 10 min. The repetition rate may have continued into the period of the radar’s low-cadence operation after 2200 UT, but the low cadence data have only resolved groups of PMRAFs without differentiating individual structures.
To investigate the relation between PMRAFs with ionospheric flows, specifically those flows driven by magnetopause reconnection, Figures 3C, D present the line-of-sight (LOS) velocity along two of the DCE radar beams. A series of PIFs can be identified as traces of fast flows (colored in red) moving poleward, some of them being only discernable along Beam 7 (Figure 3D) when Beam 12 (Figure 3C) was not at a favorable look direction. After 2300 UT, the DCE radar rotated away from the convection throat and even Beam 7 no longer had a favorable look direction, as seen from the overall slower convection velocities (green and blue colors) in Figure 3D. The fast flows are deemed PIFs because they were separated in time by slower flows, i.e., being pulsed. The repetition of the PIFs coincided with that of the PMRAFs within the DCE FOV, and a one-to-one correlation can be identified between the PIFs and the PMRAFs, supporting that they were driven by the same magnetospheric process that being magnetopause reconnection. Interestingly, different from the PMRAFs which originated between −78° and −82° MLAT within the DCE FOV, the origin of the PIFs can be traced to a latitude equatorward of the DCE FOV, implying a latitudinal separation of >2°. This suggests that the PMRAFs were not formed at the footprint of magnetopause reconnection, but at a later stage after the PIFs and associated reconnected flux tubes propagated some distance into the open field line region. This finding is consistent with [29], who found that PMRAFs emerge from where the intensity of PMAFs has become faint.
PMRAFs in the Northern Hemisphere are presented in Figures 4A, B. Here only data during the first half of the event, which is 2000–2200 UT, are shown since the availability of PGR data (Figure 4B) was limited afterwards. The INV radar (Figure 4A) continued to detect PMRAFs deep in the polar cap until 2400 UT similarly to the Southern Hemisphere radars, and an interhemispheric comparison of the deep polar-cap PMRAFs is conducted in Section 6. Despite the somewhat noisy data, traces of PMRAF can be identified in the PGR FOV, as delineated by the black dashed lines. PMRAF 1 and 3 contain substructures that seemingly suggest that each trace consisted of two closely spaced PMRAFs. The delineated PMRAFs persisted into the INV FOV, and PMRAF 1 and 3 even “re-brightened,” as marked by the black arrows. The cause of re-brightening is not precisely known. It may suggest a re-organization or re-structuring of PMRAFs. The fact that re-brightening occurred for PMRAFs that contained substructures may indicate a potential role of the substructures. It may also imply, by analogizing to the Southern Hemisphere, emergence of patches that did not have a clear source in the PGR FOV. If so, these patches were so closely spaced that even the high-cadence RBSP mode data cannot clearly distinguish.
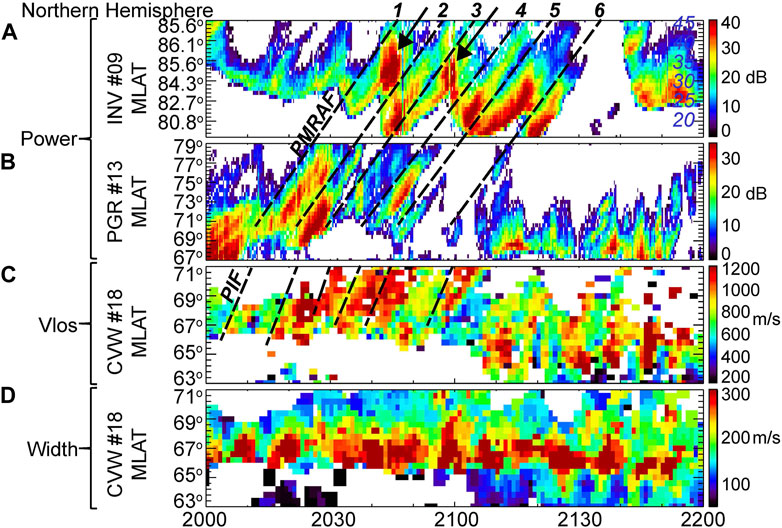
FIGURE 4. Occurrence of PMRAFs and PIFs in the Northern Hemisphere. From top to bottom (A–D) shows radar backscatter power along Beam 09 of the INV radar, backscatter power along Beam 13 of the PGR radar, LOS velocity along Beam 17 of the CVW radar, and spectral width along Beam 17 of the CVW radar. Traces of PMRAFs are delineated and numbered in a similar manner to Figure 3. The numbering is used in Figure 5 to illustrate the 2-D spatial structure of PMRAFs.
Similar to those in the Southern Hemisphere, the PMRAFs in the Northern Hemisphere were associated with PIFs. The PIFs were captured by the CVW radar in Figure 4C, where the fast flows were separated in time by slower flows (the CVW data have been smoothed with a window size of three samples to reduce noisiness). The traces of the PIFs are associated with a steeper slope than the PMRAFs because the utilized radars have different look directions (the slope is determined by the distance travelled by the PIFs/PMRAFs projected into the radar look direction). The PIFs originated from ∼66° to 67° MLAT, which is 2°–4° equatorward of the PMRAFs. The latitude of 66° MLAT is also where the open-closed field line boundary was located. This is because Figure 4D shows the radar spectral width, and the open-closed field line boundary can be identified as the transition from low to high spectral width from low to high latitudes [47,48]. Therefore, the Northern Hemisphere observation also suggests that despite being one-to-one related to PIFs, PMRAFs were not formed until PIFs propagated some distance into the open field line region.
The 2-D spatial structure of the PMRAFs is presented in Figure 5. Here we focus on the Northern Hemisphere, and the interhemispheric comparison with the Southern Hemisphere is conducted in Section 6. In the Northern Hemisphere, the combined FOVs of two radars have captured the spatial structure of the PMRAFs, where RKN captured the dawnward edge of the structures, and INV captured the duskward edge. The PMRAFs are numbered following the order of their occurrence in Figure 4. Overall the PMRAFs exhibited a dawn-dusk elongated cigar shape propagating anti-sunward. Based on manual measurement (uncertainty about 100 km), the dawn-dusk extent of PMRAFs 1-4 was about 1,600 km within the radar FOVs, although the value is likely to be a lower limit estimate as the edges of the PMRAFs might have extended further beyond the FOVs. The noon-midnight extent was about 400–500 km. PMRAF 2 appeared to have decreased in the dawn-dusk extent as it propagated from Figures 5B, C; however, the decrease could possibly be instrumental because of the limited radar backscatter from far range gates. PMRAF 5 still exhibited a cigar shape although the extent was smaller than PMRAFs 1-4, being about 1,100 km. The extent of PMRAF 6 was about 1,250 km. PMRAF 6 was oriented at an angle to the dawn-dusk meridian, which could result from gradients in the plasma flow during the course of PMRAF’s propagation, as expected from the small but finite and variable IMF By component. In fact [49], showed that large IMF By causes parcels of high density plasma to rotate during their traversal of the polar cap, where the leading edge may become the trailing edge.
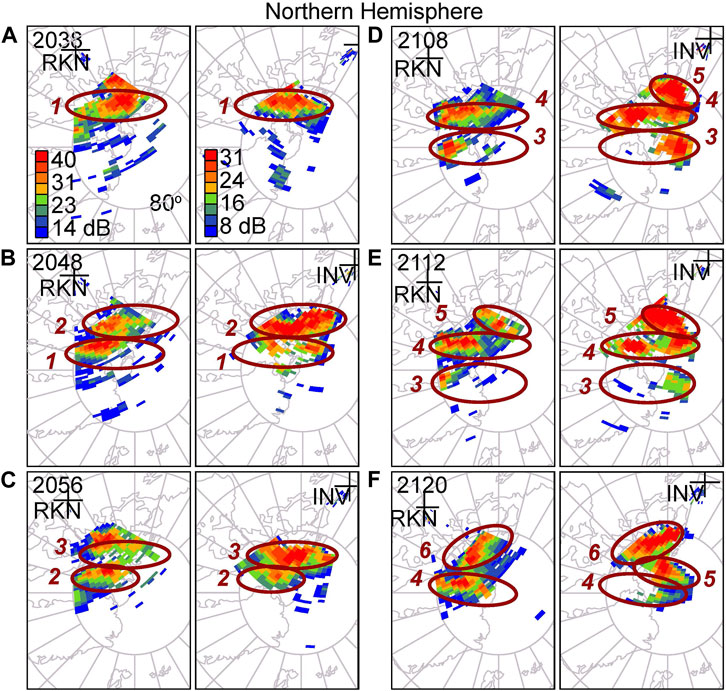
FIGURE 5. Selective scan plots that show the spatial structure of Northern Hemisphere PMRAFs as measured by the RKN and INV radar. Panels (A–F) are taken at time instances labeled at the top left. The RKN (INV) radar captures the duskward (dawnward) edge of PMRAFs, and the combined structure are circled in red. PMRAFs are numbered according to the order of appearance in Figure 4.
Figure 6 presents the two-dimensional ionosphere convection around the PMRAFs at two times, which were chosen to correspond to Figures 5A, F, respectively. The convection pattern is obtained from the recently developed Global, Local Divergence Free Fitting (G-LDFF) technique [50], which is an improvement from the Local Divergence Free Fitting (LDFF) technique [51] that uses LOS observations within a given region and fits a velocity field assuming that the velocity is divergence free. At both instances in Figure 6, the orientation of PMRAFs is highly oblique or perpendicular to the convection flow. Although limited in coverage, available echoes outside the PMRAFs suggest that convection was not uniform and that it was slower than that within the PMRAFs (cyan velocity vectors highlighted in blue circles in comparison to yellow-green vectors). [52,53], and [54] have shown the presence of fast polar cap flow channels embedded in the slower convection, where the flow channels can maintain their structure and propagate anti-sunward all the way to the nightside auroral oval. The convection in Figure 6 shows similar non-uniformity, although the fast flows here did not manifest discrete channel-like structures.
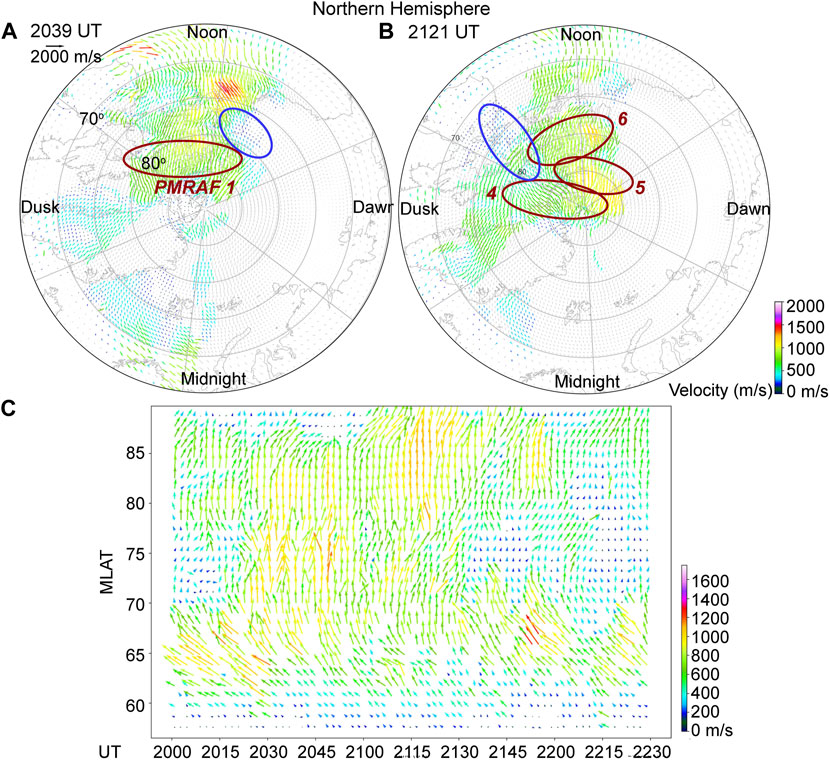
FIGURE 6. (A, B) Selective convection maps that show the ionosphere convection at and surrounding PMRAFs. Colored vectors indicate the locations where LOS observations contributed to a fit. Light gray vectors indicate locations where there were no observations. The location of PMRAFs, as determined based on the radar backscatter power, is circled in red. The blue circles highlight regions where the convection is slower than surrounding. (C) Dynamic ionospheric convection along the 12 h MLT meridian.
The time series plot of the convection at the bottom of Figure 6 shows the dynamic ionospheric convection along the 12 h MLT meridian. PIFs originated from ∼66° MLAT and continued poleward. They appear to extend deep into the polar cap, resulting in a highly variable convection speed there. Note that the decrease of the polar cap convection speed towards and after 2200 UT is likely instrumental because, as the radar network rotated away from noon, the available echoes at 12 h MLT and the radar-measured LOS velocity both decreased, affecting the result of the velocity fitting.
As a section summary, PMRAFs occurred repetitively on time scales on the order of 10 min in both Northern and Southern Hemispheres, and propagated from the dayside to nightside polar cap over long distances. They exhibited one-to-one relation with PIFs, but did not form until PIFs propagated some distance into the open field line region. In 2-D and Northern Hemisphere, PMRAFs had a dawn-dusk elongated cigar shape that extended >1,000 km in the longest dimension, and the orientation was highly oblique or perpendicular to the direction of ionosphere convection. The repetition of PMRAFs indicates that magnetopause reconnection was varying at approximately 10 min, which is similar to the reported mean repetition rate of FTEs [55,56].
5 Relation between PMRAFs and polar cap patches
As indicated in the introduction, one candidate ionosphere structure that causes the enhanced backscatter power of PMRAFs is polar cap patches. Polar cap patches can be identified in situ by LEO spacecraft, or remotely by GPS receivers or incoherent scatter radars. This section employs both types of experimental data to investigate the occurrence of patches and their relation with PMRAFs.
During the event, DMSP F16, F17, and F18 flew over the polar cap, providing in situ measurements of the topside ionosphere, and Figure 7 serves as an example of the measurements as made by F17 in the Northern Hemisphere. The spacecraft entered the northern polar cap at dusk at around 2104 UT as determined from the reversal from the sunward (positive values of Vcross) to anti-sunward convection (negative values) in Figure 7D, as well as the sharp drop of the energetic electron and ion precipitation that is typical for the auroral oval in Figures 7G, H. Within the polar cap, the spacecraft encountered a region of significantly enhanced ion number density during 2108:27-2113:08 UT (Figure 7C). The density enhancement had a median value of 4.8 × 104 cm−3, which was enhanced by about a factor of 2.2 from the median value of the entire polar cap, suggesting that the enhancement is a polar cap patch [24]. The interval when F17 observed the patch agreed with the interval when F17 crossed the PMRAF from its duskward to dawnward edge in Figures 7A, B, providing strong evidence that this polar cap patch gave rise to the backscatter of the PMRAF. In fact, a careful inspection suggests that the patch consists of two substructures separated by a minimal density at 2110:20 UT (Figure 7C). Correspondingly, the PMRAF contained two blobs of regions of strong radar backscatter (Figures 7A, B), and the spacecraft crossed the junction of the two blobs just after 2110 UT.
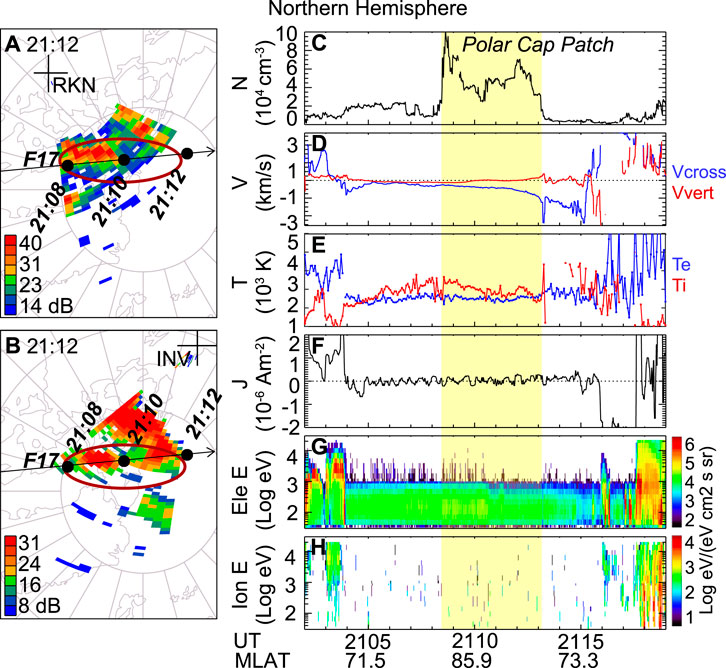
FIGURE 7. Conjunction between SuperDARN and DMSP F17. (A,B) F17 orbit overlain on the scan plots of radar backscatter as measured by the RKN and INV radar, respectively. (C–H) In situ plasma density (at ∼845 km altitude), velocity, temperature, FAC (deduced from magnetic field measurements), and differential energy flux of precipitating electrons and ions. A polar cap patch is detected and is highlighted in yellow.
The extent of the patch along the spacecraft trajectory was 2,079 km, which was obtained by multiplying the spacecraft velocity by the time it took to cross the patch. Here we have assumed that the patch was stationary during spacecraft traversal. In reality, patches propagated at the local plasma convection velocity [57], which according to Figure 6C had a magnitude of about 800 m/s and was directed mostly anti-sunward. Projecting this anti-sunward velocity to the spacecraft trajectory yields 70 m/s (angle of intersection being 85°), which was ∼1% of the spacecraft velocity and hence a minor correction to the estimate of the patch extent. This extent is comparable with, but larger than the extent of the PMRAF determined in Figure 4. The difference mainly comes from the fact that, although F17 exited the PMRAF at 2112 UT in Figure 7B, it took another minute to exit the high-density patch in Figure 7C. As indicated in Section 4, the PMRAF extent determined in Figure 4 should be regarded as a lower estimate. The PMRAF may have had the same extent as the patch, since its dawnside edge was cut off by the dawnside edge of the radar coverage.
The patch in Figure 7C fits into the classification of the classical (cold) patch as opposed to hot patches. Hot patches [58,59] are characterized by higher electron temperature than the ions, and the opposite is true for classical patches. Zhang et al. [58] suggested that hot patches may be produced when the dayside sunlit plasma is transported into flow channels, where low-energy particle precipitation associated with FACs occur. The authors therefore postulated that hot patches may be the initial creation phase of classical patches, and classical patches are more mature patches within which the particle precipitation has ended and the temperature has cooled down. The observed patch is deemed cold because the electron temperature was lower than the ion temperature (Figure 7E). The patch was also not associated with significant FACs (Figure 7F) or sharp flow shears (Figure 7D), although the anti-sunward convection gradually intensified towards dawn. It was not associated with localized particle precipitation either (Figures 7G, H).
The relation between PMRAFs and polar cap patches is alternatively assessed using GPS TEC measurements shown in Figure 8. Global TEC measurements are binned into 1° × 1° cells at 5 min resolution by default, and we further apply a spatial median filtering with a window size of three data points. One striking feature is a continuous plume of TEC enhancements that extended from the dayside ionosphere at 50°–60° MLAT into the polar cap and towards the nightside. The feature is often referred to as Tongue of Ionization (TOI) [e.g., [44,60]], and is formed when the anti-sunward convection expands equatorward and transports high-density sunlit F-region plasma at mid-latitudes through the dayside cusp into the polar cap [61].
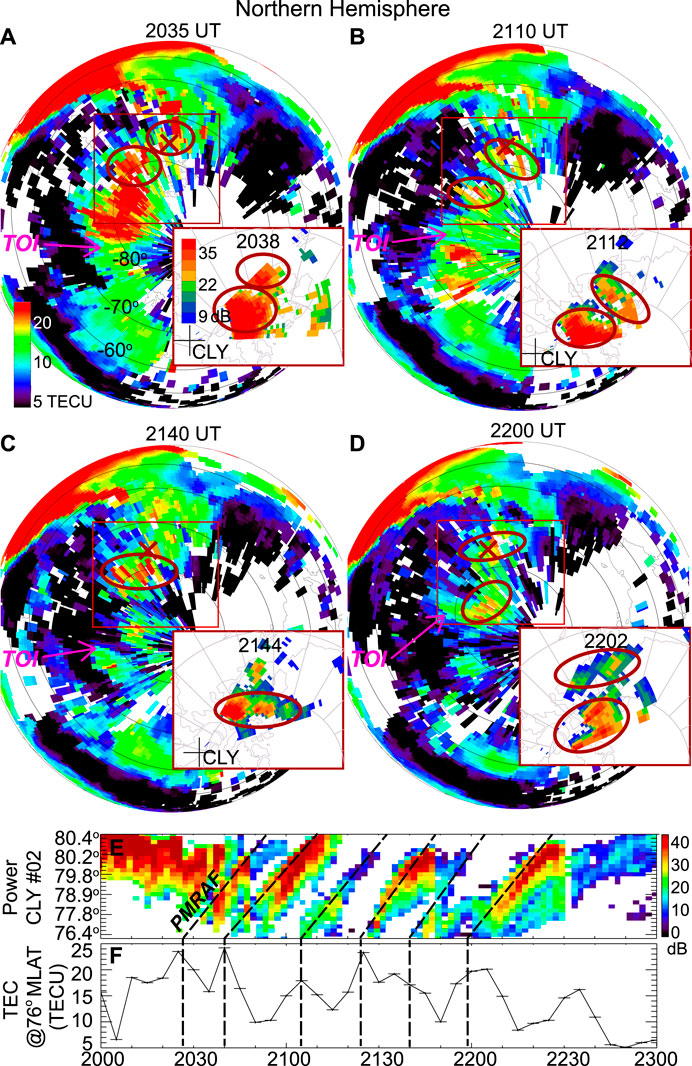
FIGURE 8. Conjunction between SuperDARN and GPS TEC measurements. (A–D) Maps of TEC. Embedded within the TOI are localized structures with higher TEC values than the surrounding TEC values, and those structures located within the CLY FOV are circled in red. The region containing the CLY FOV is denoted by the red rectangle, and the distribution of radar backscatter power over the same region is shown in the inserts. The red circles in the inserts highlight PMRAFs. (E) Range-time plot of radar backscatter power along Beam 02 of the CLY radar. Traces of PMRAFs are delineated by the black dashed lines. (F) Time variation of TEC value at 76° MLAT, −62° MLON, which was marked the red X in (A–D). The vertical black dashed lines mark the time when PMRAFs in (E) passed around 76° MLAT, where the red X is positioned. These vertical lines also approximately mark the temporal peaks of TEC measurements.
Interestingly, the TOI was not spatially smooth but contained localized structures with higher TEC values than the surrounding, and a few representative structures are circled in red in Figures 8A–D. TOI has long been known to be subject to fragmentation, where it is segmented into polar cap patches [62,63]. The common mechanisms include discrete changes in IMF By, Bz, and solar wind density, speed and pressure; variations in global convection patterns [e.g., [64]]; flow channels that chop the TOI by elevating the ionosphere recombination rates [65]; cusp particle precipitation that increases ionospheric density by particle impact ionization [66,67]; and transient magnetopause reconnection that displaces the open-closed field boundary equatorward into the dayside sunlit plasma [68] (see review by [69]). We therefore refer to the structures circled in red as patches, although different from isolated patches, the patches in Figure 8 were embedded in a continuous stream of TOI.
We now compare the patches within the red rectangle with the radar backscatter power measured by the CLY radar over the same area (shown in the inserts). The patches occurred around similar time and location to the PMRAFs, the latter also being circled in red. Although the exact location and spatial form of the patches is limited by the somewhat sparse TEC data points at polar latitudes, the correspondence between the patches and PMRAFs occurred repetitively throughout Figures 8A–D, indicating that the correspondence is not coincidental. In fact, Figure 8F extracts the TEC value at the red X point (76° MLAT, −62° MLON) in Figures 8A–D, which is along the look direction of Beam 2 of the CLY radar, and presents the value as a function of time. The TEC shows a series of peaks, and each peak coincides with a passage of a PMRAF. One small exception is the peak at 2135 UT which preceded the PMRAF by 5 min. Considering that the TEC map has a cadence of 5 min, the difference is regarded as insignificant. Therefore, the remarkable one-to-one correspondence between the PMRAFs and the patches suggests that PMRAFs are the radar manifestation of polar cap patches.
To summarize the current section, PMRAFs are found to collocate with polar cap patches, the latter manifesting as regions of enhanced plasma in the topside ionosphere in DMSP data, and as structures of elevated TEC values embedded within a continuous TOI in the GPS TEC data. Similar to the PMRAFs that extended ∼1,600 km in the dawn-dusk direction, patches had a dawn-dusk extent of ∼2,100 km. The PMRAFs may have had the same extent as the patches, where their dawnward edge was cut off by the limited radar coverage. It is worth mentioning that strictly speaking, it is the plasma irregularities associated with polar cap patches that give rise to backscatter echoes of the HF radar, and that plasma irregularities take time to develop. The growth time for gradient drift instability, which is one of the most important instabilities associated with polar cap patches, has been reported to vary from <1 min to 12 min [41,70–72], the exact value depending on the plasma convection speed and the scale length of the plasma density gradient. This may explain why even though PIFs and patches form within the cusp, PMRAFs do not form until several minutes later when they propagate some distance into the polar cap.
6 Hemispheric symmetry and asymmetry of PMRAFs and associated patches
6.1 Temporal repetition
In this section, we compare the temporal repetition and spatial structure of PMRAFs in the two hemispheres. Figure 9 compares the temporal repetition of PMRAFs based on measurements along Beam 3 of the MCM and Beam 9 of the INV radar. The two radars had FOVs that extend to the central polar cap, where PMRAFs tend to cross, and their conjugate FOVs have large overlaps. The findings are not sensitive to the choice of the specific camping beams because of the large extent of the PMRAFs. Individual PMRAFs have been identified as traces with strong backscatter moving poleward, and they are marked by the magenta arrows. They are also numbered starting around 2040 UT, when backscatter of the two radars became simultaneously large in power and quasi-continuous in temporal coverage.
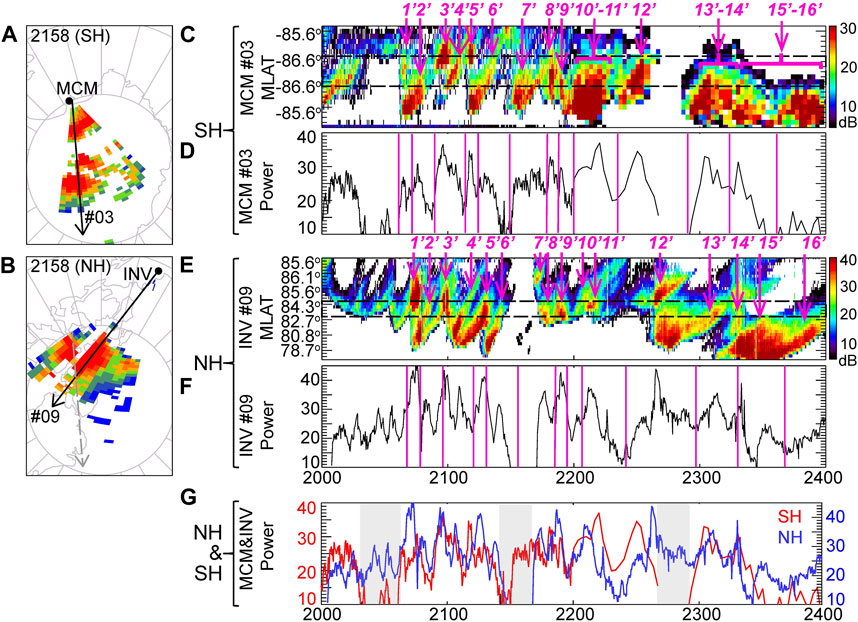
FIGURE 9. Interhemispheric comparison of PMRAF occurrence rate. (A,B) Scan plots of radar backscatter power as measured by the MCM and INV radar, respectively. Beams selected for interhemispheric comparison are delineated, and Beam 03 of MCM is also overlain onto the Northern Hemisphere for comparison. (C) Range-time plots of radar backscatter power along Beam 03 of the MCM radar. PMRAFs are marked by the magenta arrows and also numbered. The numbered PMRAFs are different from those in Figure 3 because here PMRAFs without a clear source in the DCE FOV are also counted. (D) Time variation of radar backscatter power along Beam 03 averaged over a given latitude range. The latitude range is denoted by the black dashed rectangle in (C). The vertical magenta lines are used to guide the identification of temporal peaks of the averaged backscatter power. (E,F) Similar to (C,D) but for Beam 09 of the INV radar. The vertical magenta lines in (D) are overlain but tagged by 3 min. (G) Direct comparison of (D) (red) and (F,D), where (F) is advanced by 3 min to account for the interhemispheric lag.
Between 2040–2200 UT, nine PMRAFs were identified in the MCM radar, with an average occurrence rate of one PMRAF per 9 min. Some of the PMRAFs entered the MCM FOV from the equatorward edge of the FOV, such as PMRAFs 2′, 4′, 6′, and 7′, while others entered at a later stage of their transpolar propagation. Interestingly, the INV radar in the Northern Hemisphere captured the same number of PMRAFs during the same time period, and the occurrence time of each PMRAF was similar to those in the Southern Hemisphere. One exception is PMRAF 7′ which entered the INV FOV about 10 min later than the time it entered MCM, but the delay can be attributed to the gap in the INV radar coverage during 2130–2140 UT. When the coverage recovered, PMRAF 7’ already propagated to the poleward edge of the INV FOV, giving an apparent late occurrence time.
The correlated PMRAF occurrence persisted during 2200–2400 UT, but with a larger uncertainty. The uncertainty is partially due to the end of the RBSP operation of the MCM radar, after which only low cadence are available (Figure 9C). The low cadence data cannot resolve PMRAFs that were closely spaced. The uncertainty is also due to the rotation of the INV radar to a non-ideal look direction, where the PMRAF traces in the INV radar became less discrete and showed a decreasing slope with time (Figure 9E), both indicating that the radar beam intersected the PMRAFs at an increasingly oblique angle. Nevertheless, seven PMRAFs (numbered 10′-16′) have been identified in the INV radar in the Northern hemisphere, and the MCM radar in the Southern Hemisphere, although unable to resolve individual PMRAFs, showed similar PMRAF groups (numbered 10′−11′, 12′, 13’−14′, 15’−16′).
As an alternative approach of examining the hemispheric correlation of PMRAF occurrence, we compare the temporal variation of the radar backscatter at a fixed latitude range. The latitude is selected to capture the passage of as many PMRAFs as possible, as marked by the dashed black rectangle in Figures 9C, E. The latitudinally averaged backscatter is presented for the Southern and Northern Hemisphere in Figures 9D, F, respectively. The backscatter power shows a series of peaks, indicative of passage of PMRAFs. A set of vertical magenta lines has been superimposed onto Figure 9D to visually guide the identification of the peaks in the Southern Hemisphere. These magenta lines have a nearly one-to-one correspondence to the PMRAFs in Figure 9C as expected, except for PMRAFs 3′ and 4′, which were very closely spaced and manifest as a single peak, as opposed to two peaks, in the spatially averaged backscatter power.
The same set of magenta lines is overlain in Figure 9F, except for being lagged by 3 min. If the PMRAFs in the Northern Hemisphere were produced at a similar rate to those in the Southern Hemisphere, the radar backscatter power in Figure 9F should exhibit similar temporal variation to that in Figure 9D. Indeed, the magenta lines serve as excellent markers for the variations in the Northern Hemisphere as well. One exception is the INV peak at ∼2105 UT, which corresponded to PMRAF 4’ but was not picked out by the magenta lines. The missing magenta line, as mentioned above, was due to the small separation of PMRAFs 3 and 4 in the Southern Hemisphere, which effectively merges the two peaks associated with the passage of two PMRAFs into one broad peak.
A direct comparison of the temporal variation of the two radar backscatters is shown in Figure 9G, where the INV backscatter is advanced by 3 min. A high degree of correlation is again obtained, with similar number of peaks occurring at similar instances, except at intervals of data gap in either radar (shaded in grey).
The interhemispheric lag of approximately 3 min could result from a number of factors. The location of the cusp may be different between hemispheres, and [73] reported that the difference varies with the Earth’s dipole tilt and the IMF Bz component. A negative dipole tilt (northern winters) shifts the cusp in the winter hemisphere equatorward with respect to the simultaneous cusp position in the summer hemisphere. Considering that the cusp is where polar cap patches originate, a displacement to a lower (higher) latitude means a longer (shorter) distance for patches/PMRAFs to travel to the central polar cap. This effect, however, can be reduced by the IMF Bz which shifts the southern cusp equatorward. Furthermore, ionospheric convection may be different, and [27,28] observed that convection can be faster and oriented at a larger angle relative to the noon-midnight meridian in the summer hemisphere than winter hemisphere. The event is associated with a finite IMF Bx component, and this component has been shown to induce differences in the strength of the Region-1 FACs [74], intensity and location of the auroral oval [75–78], and value of polar cap indices [79] between hemispheres. The Bx component also affects the location of dayside reconnection site by shifting the merging line northward (southward) for Bx > 0 (Bx < 0) [80–82]. The IMF Bx was negative, and the associated southward shift means that the distance and time that signals travel from the reconnection site to the ionosphere is shorter in the Southern Hemisphere (typical signal traveling time is 2 min [e.g;, [83]]). On the other hand, the reconnection site is also affected by the dipole tilt. A negative dipole tilt tends to move reconnection northward [81, 82, 84–86], which can reduce the IMF Bx effect. The time lag is also contributed by the different latitudes selected to conduct the interhemispheric comparison of the radar backscatter power, as the selection was limited by the available backscatter echoes.
The high degree of correlation of PMRAF occurrence between hemispheres suggests that the PMRAFs were produced at a similar rate, or even in close synchronization, in the two hemispheres. Note that being located within the polar cap, the PMRAFs in different hemispheres were not threaded by the same magnetic field lines, and hence the correlation cannot be explained as a result of field line mapping. The correlation, however, can be understood if PMRAFs are a fossil signature of magnetopause reconnection. Reconnection drives ionospheric flows in each hemisphere across the open-closed field line boundary. If reconnection is bursty, the associated ionospheric flows would be pulsed, and the pulsations would be in close synchronization between hemispheres. Although the open-closed field line boundary at different hemispheres may be located at different latitudes [2], as long as the boundary is embedded within a region of high density plasma, such as dayside sunlit plasma, PIFs would transport the high-density plasma into the polar cap. This leads to nearly simultaneous formation of polar cap patches, and hence highly correlated detection of PMRAFs in the two hemispheres. In other words, magnetopause reconnection can produce traveling structures, such as polar cap patches and PMRAFs, that maintain hemispheric correlation deep into the open field line region.
The highly correlated occurrence of PMRAFs further implies that polar cap patches were also produced at similar rate if not simultaneously in the Northern and Southern Hemisphere. This finding is in contrast to climatological studies of patch occurrence, which shows significant hemispheric differences. [87, 88] suggested that patches in both hemispheres tend to occur in local winter. [89, 90], on the other hand, found that Southern Hemisphere patches tend to occur in local summer, and that there are more patches in the south than the north. The studied event occurred near winter solstice in the north, and is predicted by the former (latter) studies to have more patches in the Northern (Southern) than the opposite hemisphere, yet similar numbers of patches are indicated. In general, the formation of patches requires the dayside open-closed field line boundary to be positioned at or just equatorward of the terminator at F-region altitudes. The intense geomagnetic storm condition of the studied event is associated with a boundary positioned much more equatorward than normal, which may account for the discrepancy between the case and climatological studies. More interhemispheric observations are warranted to understand the hemispherical dependence of patch occurrence.
6.2 Spatial structure
We now compare the spatial structure of PMRAFs between hemispheres. The structures of the Northern Hemisphere PMRAFs have been analyzed in Figures 5, 7, 10A–D present the 2-D distribution of the radar backscatter power in the Southern Hemisphere measured by the DCE and MCM radars. The PMRAFs were highlighted by red circles, and also numbered according to the order of their appearance following Figure 3. Note that the MCM backscatter power is shown at instances that are 7–9 min later than the DCE radar to account for the time taken by the PMRAFs to propagate anti-sunward into the MCM FOV. Despite the somewhat limited radar coverage, the spatial structure of the Southern Hemisphere PMRAFs can be inferred. This is because the dawnward edge of the PMRAFs was well captured by the DCE radar, which manifests as gradient of the backscatter power from red, to green, and then blue. The gradient is also evident in the MCM radar, and the location of the gradient, when compared against that in the DCE radar, is consistent with an overall anti-sunward propagation of PMRAFs with limited azimuthal motion, as expected for the small IMF By component.
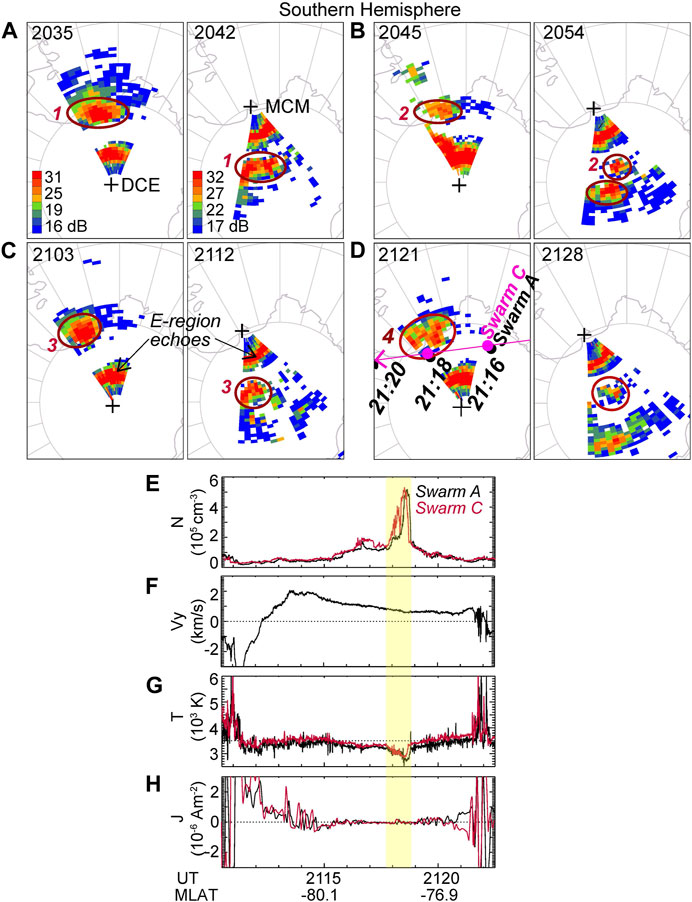
FIGURE 10. Conjunction between SuperDARN and Swarm. (A–D) Selective scan plots that show the spatial structure of Southern Hemisphere PMRAFs as measured by the DCE and MCM radar. PMRAFs are circled in red and numbered according to the order of appearance in Figure 3. Orbits of Swarm A and C are overlain in (D). The large radar backscatter power at near range gates is not due to PMRAFs but E-region echoes. (E–H) In situ plasma density (at ∼450 km altitude, Swarm A in black, Swarm C in red), cross-track velocity, electron temperature, and FAC (deduced from magnetic field measurements). Cross-track velocity was only available on Swarm A. Polar cap patch is detected and is highlighted in yellow.
For the duskward edge of the PMRAFs, the DCE radar did not observe the dark blue backscatter power background as for the dawnward edge. However, it detected the decrease of the backscatter power from red to green for PMRAFs 1–3. Assuming that the backscatter power continued to decrease at the same rate as the dawnward edge, the duskward edge was expected to be located at a distance <100 km from the edge of the DCE FOV. We therefore estimated the dawn-dusk extent of the PMRAFs by adding 100 km to the extent covered by the DCE radar, and obtained an approximate extent of 850, 650, 700, and 750 km for PMRAFs 1-4, respectively. These numbers were significantly smaller than the size of the PMRAFs in the Northern Hemisphere that were observed at similar time by a factor of two to three. The noon-midnight extent, however, was similar to that in the Northern Hemisphere, being about 400–500 km. The overall location of the PMRAFs was displaced duskward compared with those in the Northern Hemisphere.
The shorter dawn-dusk extent of the Southern Hemisphere PMRAFs is supported by the in situ measurements of polar cap patches made by the Swarm A and C spacecraft in Figures 10E–H. The two spacecraft entered the polar cap at around 2112:20 UT, as evidenced from the reversal of convection from sunward (negative) to anti-sunward (positive) in Figure 10F and the sudden decrease of FACs to small values (overall <1 µA/m2) in Figure 10H. Within the polar cap, Swarm C observed an enhancement of plasma density starting from 2117:45 UT (Figure 10E, shaded in yellow), which rose to a peak density at 5.2 × 105 cm−3 at around 2118:30 UT. The density enhancement is a polar cap patch. Swarm A also observed the density increase, but lagged by a few seconds due to the spatial displacement from Swarm C in the along-track direction. A close inspection further reveals that the magnitude of the density increase at Swarm A was smaller than that at Swarm C until 2118:25 UT, after which the two spacecraft measurements became comparable. This difference in magnitude, combined with the fact that Swarm C was displaced from Swarm A towards the dayside, is consistent with the two spacecraft straddling the leading edge of the patch. The patch was associated with electron temperature lower than the surrounding (Figure 10G), and hence fits into the classical polar cap patch, similar to the Northern Hemisphere patches.
By comparing the time when the spacecraft observed the patch with the time when they passed PMRAF 4, we found that the increase of the in situ plasma density starting around 2117:45 UT coincided with the spacecraft approaching the front of the PMRAF. Assuming the same coincidence for duskward edge of the PMRAF, the duskward edge should be located where the plasma density decreased, which occurred sharply at 2118:36–2118:42 UT for Swarm C or 2118:44–2118:48 UT for Swarm A. The obtained location is consistent with our simple estimate of the duskward edge being located approximately 100 km from the edge of the DCE FOV, corroborating the short dawn-dusk extent of the Southern Hemisphere PMRAFs in comparison to the Northern Hemisphere ones.
The extent of the polar cap patch traversed by the Swarm spacecraft is 433 km, which was comparable, although smaller than, the 750-km extent of PMRAF 4. The difference is probably because the spacecraft did not fully cross the patch from its dawnward to duskward edge, but only from the leading edge to the duskward edge. It is thus likely that the patch and the PMRAF had the same extent, and the extent measured by the spacecraft was only a fraction of the full extent.
Although not shown, another polar cap patch was measured by Swarm B during 2213:59–22:15:00 in conjunction with a PMRAF within the DCE FOV. The extent of the patch was 464 km, similarly short to the patch measured by Swarm A and C. The DMSP spacecraft used to measure the extent of the Northern Hemisphere patches crossed the southern polar cap on the nightside, without direct conjunctions with PMRAFs.
Therefore, despite the remarkably high degree of correlation of temporal repetition, the spatial scales of PMRAFs/patches show drastic asymmetry between the two hemispheres. If magnetopause reconnection were the only process determining the spatial structure of PMRAFs/patches, the structure would be expected to be the same especially when the prevailing IMF was close to being due southward. One candidate explanation is that the production of PMRAFs/patches not only requires pulsed reconnection-related ionospheric flows, which are magnetically conjugate, but also a source population of high-density plasma, such as dayside photoionization plasma. If the distribution of the high-density plasma along the open-closed field boundary is hemispherically asymmetric, the spatial extent of the plasma entrained in the anti-sunward convection and hence the structure of the PMRAFs/patches will be asymmetric.
Figure 11 compares the distribution of ionospheric plasma from mid to polar latitudes between the two hemispheres. The comparison is performed at 2000 UT, when TEC measurements in the Southern Hemisphere were still dense around noon. Both hemispheres show the occurrence of a TOI that originated from a mid-latitude plume often referred to as Storm Enhanced Density (SED, Foster, 1993). Here, the SED manifests as an extended plume of enhanced plasma density that spanned from the spatially broad high density source at dusk, which is the TEC bulge [91], to the vicinity of the noon time cusp. According to Figure 8, it is the segmentation of the TOI that produced polar cap patches and associated PMRAFs.
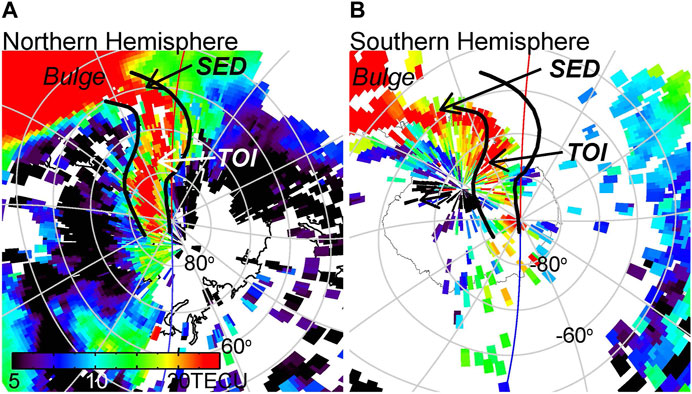
FIGURE 11. GPS TEC maps that show the extension of the polar TOI from a SED plume, which is further extended from a TEC bulge. Panel (A) shows the Northern Hemisphere, and the boundaries of the SED plume and TOI are delineated by the black solid curve based on regions of large TEC (red color). The boundaries are overlain onto the Southern Hemisphere in Panel (B) to guide the interhemispheric comparison of the spatial extent.
One salient difference between hemispheres is the TEC bulge. Specifically, the bulge was spatially more extensive in the Northern than Southern Hemisphere, with its duskward edge located at 13.4 h MLT at the base of the SED in the north, and at 15.2 h MLT in the south. The spatial extent of the bulge is potentially important for the morphology of the TOI in the polar cap because the bulge serves as a source population for the SED plume, and because the entry of the SED plume into the polar cap forms the TOI. An inspection of Figure 11 indeed reveals that both the SED plume and the TOI in the Southern Hemisphere had a narrower width (width being defined as the dimension perpendicular to the channel of TEC enhancement) than those in the Northern Hemisphere. In fact, by outlining the boundaries of the Northern Hemisphere SED and TOI based on gradient in TEC (transition from red to green as delineated by solid black curve in Figure 11A) and overlaying the boundaries onto the Southern Hemisphere, we find that the Southern Hemisphere TOI was narrower and was centered more towards the dusk away from the noon-midnight meridian, consistent with the comparison result of the PMRAFs.
Note that hemispheric asymmetry has been reported for the TEC bulge as well as for the SED plume. For instance, [91] compared TEC observed by a LEO spacecraft and GPS TEC at the magnetic conjugate point, and found that the amplitude of the bulge is often non-conjugate. [92] inspected GPS TEC maps from the two hemispheres, and observed that the longitudinal extent of the bulge (see their Figures 6.7 and 6.9) differs between hemispheres, the difference being very similar to Figure 11. Using data assimilation [93], reported simultaneous occurrence of SED/TOI in conjugate hemispheres; however, the SEDs showed a hemispheric difference in both the amplitude and time evolution.
The broader plasma source in the Northern compared to Southern Hemispheres may appear counterintuitive as one would expect stronger solar ionization in the Southern Hemisphere near winter solstice. The counter intuition highlights the predominant influence of the geomagnetic storm on local ionosphere dynamics. Generally speaking, the enhancement of mid-latitude TEC during storms can be due to advection, either from lower latitudes as a superfountain effect [94,95] or from later local times [96]. It can also be due to local production associated either with plasma uplift by penetration or polarization electric fields [97,98], or with disturbed neutral winds [54,99]. Evidence suggests that the superfountain effect is important mainly during superstorms (Dst < −250 nT), and that local production is important during intense storms [100]. For the studied intense storm, the broader TEC bulge in the Northern than Southern Hemisphere is possibly contributed by neutral wind enhancement and the offset between geographic pole and geomagnetic pole. The offset causes plasma convection and auroral phenomena, such as penetration and polarization electric fields, to move toward and away from the Sun. TEC enhancements should be largest when the geomagnetic pole is tilted towards the Sun, which is 1900 UT for the Northern Hemisphere, and 0700 UT for the Southern Hemisphere [98]. The time when the studied event occurred favors the former more than the latter. Equatorward-propagating disturbance neutral winds, as driven by Joule heating at high latitudes, push plasma upward along magnetic field lines enhancing TEC, whereas poleward-propagating winds from the opposite hemisphere reduce TEC. The broader northern TEC bulge may imply a broader equatorward wind surge than that in the Southern Hemisphere. However, existing wind measurements are too sparse to test this inference, and future simulation efforts are warranted.
In brief, PMRAFs exhibited a remarkably high degree of correlation of temporal repetition between hemispheres, as evidenced by the similar number of PMRAFs and by the similar temporal variation of radar backscatter power. This indicates that PMRAFs were produced at a similar rate, or even in close synchronization, in the two hemispheres. The correlation can be understood as magnetopause reconnection driving ionospheric flows that pulse in close synchronization between the two hemispheres. These flows transport the subauroral high-density plasma into the polar cap, forming patches/PMRAFs. However, the spatial structure of PMRAFs was asymmetric, with the Southern Hemisphere PMRAFs 2–3 times shorter in the dawn-dusk direction than the Northern Hemisphere ones. The difference is attributed to the hemispherically asymmetrical distribution of the high-density plasma source along the dayside open-closed field line boundary. The source distribution determines the spatial extent of plasma entrained in the anti-sunward convection, and hence the extent of patches/PMRAFs.
7 Conclusion
The impact of Earth’s magnetopause reconnection on the dayside ionosphere and its hemispherical symmetry is investigated based on interhemispheric observations of PMRAFs during a geomagnetic storm. The storm is characterized by an IMF that was quasi-steady and close to being due southward, and signatures of active reconnection have been detected by MMS spacecraft crossing the magnetopause boundary layer. The interhemispheric observations of PMRAFs presented here suggest the following.
1. PMRAFs occurred repetitively on time scales of about 10 min, and propagated from the dayside to nightside polar cap over long distances. They exhibited one-to-one relation with pulsed ionospheric flows, but did not form until the flows propagated some distance into the open field line region. The delayed formation is because the plasma irregularities that give rise to PMRAFs take time to develop and is consistent with being a fossil signature of magnetopause reconnection.
2. The temporal repetition of PMRAFs exhibited a remarkably high degree of correlation between hemispheres, indicating that PMRAFs were produced at a similar rate, or even in close synchronization, in the two hemispheres.
3. The spatial structure of PMRAFs exhibited significant hemispherical asymmetry. In the Northern Hemisphere, PMRAFs had a dawn-dusk elongated cigar shape that extended >1,000 km, at times reaching >2,000 km, in the longest dimension, whereas in the Southern Hemisphere, PMRAFs were 2–3 times shorter.
4. Both magnetopause reconnection and local ionospheric conditions play important roles in determining the degree of symmetry of PMRAFs/patches. On one hand, magnetopause reconnection drives ionospheric flows that pulse in close synchronization between hemispheres. These flows transport the subauroral high-density plasma into the polar cap, forming patches/PMRAFs that exhibit symmetric temporal repetition. On the other hand, the distribution of the high-density plasma at the dayside open-closed field line boundary determines the spatial extent of plasma entrained in the anti-sunward convection, and hence the structure of patches/PMRAFs. Although reconnection-driven ionospheric flows are nearly magnetically conjugate under a due southward IMF, the distribution of the high-density plasma is subject to local processes, such as neutral wind pattern or separations between geographic pole and geomagnetic pole.
5. The ionospheric structure that causes the enhanced backscatter power of PMRAFs appears to be polar cap patches. Patches are collocated with, and have a comparable dawn-dusk extent to PMRAFs, with differences explainable by radars partly capturing PMRAFs or spacecraft partly crossing patches.
These characteristics of PMRAFs are observed under a nearly due southward IMF, and additional asymmetry might occur if the IMF had a strong By component. For instance, a positive By component moves the cusp towards the afternoon (morning) sector in the Northern (Southern) Hemisphere, affecting the location of PMRAF origin. Since the TEC bulge is located in the afternoon sector, the proximity (distance) of the cusp to the plasma source may affect the extent of PMRAFs, which increases (decreases) the extent in the Northern (Southern) Hemisphere, intensifying the hemispheric asymmetry. Furthermore, PMRAFs will propagate across the polar cap in a direction which deviates from the anti-sunward direction, pointing towards dawn (dusk) in the Northern (Southern) Hemisphere.
Data availability statement
Publicly available datasets were analyzed in this study. This data can be found here: http://vt.superdarn.org/ https://superdarn.jhuapl.edu/downloadhttps://www.ngdc.noaa.gov/stp/satellite/dmsp/https://swarm-diss.eo.esa.int/ Madrigal database.
Author contributions
YZ: conceptualization, methodology, formal analysis, writing—original draft, visualization. L-JC, BW, and BB: conceptualization, formal analysis, writing—review and editing. YM and WB: formal analysis, writing—review and editing. LL, JL, ST, and SY: validation, writing—review and editing. AC and KM: resources. All authors contributed to the article and approved the submitted version.
Funding
YZ is supported by NSF AGS-2025570 and NASA DRIVE Science Center for Geospace Storms (CGS) under award 80NSSC22M0163. LL, JL and SY are supported by AFOSR FA9559-16-1-0364, NSF AGS-2055192, and NASA 80NSSC20K1314, 80NSSC20K1316, and 80NSSC21K1407, and NASA contract NAS5-02099. SuperDARN is a collection of radars funded by national scientific funding agencies of Australia, Canada, China, France, Italy, Japan, Norway, South Africa, United Kingdom and the United States. SuperDARN operations and research at Pennsylvania State University are supported under NSF PLR-1443504 from the Office of Polar Programs, and AGS-1934419 from the Geospace Section of NSF Division of Atmospheric and Geospace Sciences. The CVW SuperDARN radar is supported by NSF grant AGS-1934997 to Dartmouth College. The Dome C East radar was installed in the framework of a French-Italian collaboration with contribution from the Institut Polaire Francais (IPEV), the Institut National des Sciences de l’Univers (INSU), the Italian National Program for Antarctic Research (PNRA), the Italian National Research Council (CNR) and the Istituto Nazionale di Astrofisica (INAF). Dome C East is operated by the Institute for Space Astrophysics and Planetology (IAPS) of INAF with support from CNR and PNRA.
Conflict of interest
The authors declare that the research was conducted in the absence of any commercial or financial relationships that could be construed as a potential conflict of interest.
Publisher’s note
All claims expressed in this article are solely those of the authors and do not necessarily represent those of their affiliated organizations, or those of the publisher, the editors and the reviewers. Any product that may be evaluated in this article, or claim that may be made by its manufacturer, is not guaranteed or endorsed by the publisher.
References
1. Baker KB, Rodger AS, Lu G. HF-Radar observations of the dayside magnetic merging rate: A Geospace environment modeling boundary layer campaign study. J Geophys Res Space Phys (1997) 102(A5):9603–17. doi:10.1029/97JA00288
2. Pinnock M, Rodger AS, Baker KB, Lu G, Hairston M. Conjugate observations of the day-side reconnection electric field: A gem boundary layer campaign. Ann Geophysicae (1999) 17(4):443–54. doi:10.1007/s00585-999-0443-4
3. Pinnock M, Chisham G, Coleman IJ, Freeman MP, Hairston M, Villain J-P. The location and rate of dayside reconnection during an interval of southward interplanetary magnetic field. Ann Geophysicae (2003) 21(7):1467–82. doi:10.5194/angeo-21-1467-2003
4. Chisham G, Freeman MP, Coleman IJ, Pinnock M, Hairston MR, Lester M, et al. Measuring the dayside reconnection rate during an interval of due northward interplanetary magnetic field. Ann Geophysicae (2004) 22(12):4243–58. doi:10.5194/angeo-22-4243-2004
5. Pinnock M, Rodger AS, Dudeney JR, Baker KB, Newell PT, Greenwald RA, et al. Observations of an enhanced convection channel in the cusp ionosphere. J Geophys Res (1993) 98(A3):3767–76. doi:10.1029/92JA01382
6. Pinnock M, Rodger AS, Dudeney JR, Rich F, Baker KB. High spatial and temporal resolution observations of the ionospheric cusp. Ann Geophys (1995) 13:919–25. doi:10.1007/s00585-995-0919-9
7. Neudegg DA, Yeoman TK, Cowley SWH, Provan G, Haerendel G, Baumjohann W, et al. A flux transfer event observed at the magnetopause by the Equator-S spacecraft and in the ionosphere by the CUTLASS HF radar. Ann Geophys (1999) 17:707–11. doi:10.1007/s00585-999-0707-z
8. Neudegg DA, Cowley SWH, Milan SE, Yeoman TK, Lester M, Provan G, et al. A survey of magnetopause FTEs and associated flow bursts in the polar ionosphere. Ann Geophys (2000) 18:416–35. doi:10.1007/s00585-000-0416-0
9. Elphic RC, Lockwood M, Cowley SWH, Sandholt PE. Signatures of flux transfer events at the dayside magnetopause and in the ionosphere: Combined ISEE, EISCAT and optical observations. Geophys Res Lett (1990) 17:2241–4. doi:10.1029/gl017i012p02241
10. Nishitani N, Ogawa T, Pinnock M, Freeman MP, Dudeney JR, Villain J-P, et al. A very large scale flow burst observed by the SuperDARN radars. J Geophys Res (1999) 104(A10):22469–86. doi:10.1029/1999JA900241
11. Chisham G, Pinnock M, Rodger AS. Poleward-moving HF radar flow bursts in the cusp: Transient changes in flow speed or direction? Geophys Res Lett (2000) 27:919–22. doi:10.1029/1999GL010760
12. Marchaudon A, Cerisier J-C, Greenwald RA, Sofko GJ. Electrodynamics of a flux transfer event: Experimental test of the Southwood model. Geophys Res Lett (2004) 31:L09809. doi:10.1029/2004GL019922
13. Marchaudon A, Cerisier J-C, Bosqued J-M, Dunlop MW, Wild JA, Décréau PME, et al. Transient plasma injections in the dayside magnetosphere: One-to-one correlated observations by cluster and SuperDARN. Ann Geophys (2004) 22:141–58. doi:10.5194/angeo-22-141-2004
14. Provan G, Yeoman TK, Milan SE. CUTLASS Finland radar observations of the ionospheric signatures of flux transfer events and the resulting plasma flows. Ann Geophys (1998) 16:1411–22. doi:10.1007/s00585-998-1411-0
15. Provan G, Yeoman TK. Statistical observations of the MLT, latitude and size of pulsed ionospheric flows with the CUTLASS Finland radar. Ann Geophys (1999) 17:855–67. doi:10.1007/s00585-999-0855-1
16. McWilliams KA, Yeoman TK, Provan G. A statistical survey of dayside pulsed ionospheric flows as seen by the CUTLASS Finland HF radar. Ann Geophys (2000) 18:445–53. doi:10.1007/s00585-000-0445-8
17. Farrugia CJ, Lund EJ, Sandholt PE, Wild JA, Cowley SWH, Balogh A, et al. Pulsed flows at the high-altitude cusp poleward boundary, and associated ionospheric convection and particle signatures, during a Cluster - FAST - SuperDARN- Søndrestrøm conjunction under a southwest IMF. Ann Geophys (2004) 22:2891–905. doi:10.5194/angeo-22-2891-2004
18. Fasel GJ, Lee LC, Smith RW. A mechanism for the multiple brightenings of dayside poleward-moving auroral forms. Geophys Res Lett (1993) 20(20):2247–50. doi:10.1029/93GL02487
19. Moen J, Oksavik K, Carlson HC. On the relationship between ion upflow events and cusp auroral transients. Geophys Res Lett (2004) 31:L11808. doi:10.1029/2004GL020129
20. Lessard MR, Fritz B, Sadler B, Cohen I, Kenward D, Godbole N, et al. Overview of the rocket experiment for neutral upwelling sounding rocket 2 (RENU2). Geophys Res Lett (2020) 47:e2018GL081885. doi:10.1029/2018GL081885
21. Lorentzen DA, Moen J, Oksavik K, Sigernes F, Saito Y, Johnsen MG. In situ measurement of a newly created polar cap patch. J Geophys Res (2010) 115:A12323. doi:10.1029/2010JA015710
22. Hosokawa K, Taguchi S, Ogawa Y. Periodic creation of polar cap patches from auroral transients in the cusp. J Geophys Res Space Phys (2016) 121:5639–52. doi:10.1002/2015JA022221
23. Weber EJ, Buchau J, Moore JG, Sharber JR, Livingston RC, Winningham JD, et al. F layer ionization patches in the polar cap. J Geophys Res (1984) 89(A3):1683–94. doi:10.1029/JA089iA03p01683
24. Crowley G. Critical review of ionospheric patches and blobs. In: Stone WR, editor. Review of radio science, 1993-1996. London: International Union of Radio Science (1996). p. 619.
25. Wild JA, Milan SE, Cowley SWH, Dunlop MW, Owen CJ, Bosqued JM, et al. Coordinated interhemispheric SuperDARN radar observations of the ionospheric response to flux transfer events observed by the Cluster spacecraft at the high-latitude magnetopause. Ann Geophysicae (2003) 21(8):1807–26. doi:10.5194/angeo-21-1807-2003
26. Wilder FD, Clauer CR, Baker JBH, Newell PT. Interhemispheric observations of dayside convection under northward IMF. J Geophys Res Space Phys (2011) 116(A10). doi:10.1029/2011JA016748
27. Koustov AV, Yakymenko KN, Ponomarenko PV. Seasonal effect for polar cap sunward plasma flows at strongly northward IMF Bz. J Geophys Res Space Phys (2017) 122(2):2530–41. doi:10.1002/2016JA023556
28. Yakymenko KN, Koustov AV, Fiori RD. Interhemispheric asymmetry of the sunward plasma flows for strongly dominant IMF BZ>0. J Geophys Res Space Phys (2018) 123(1):315–25. doi:10.1002/2017JA024644
29. Milan SE, Lester M, Cowley SWH, Brittnacher M. Convection and auroral response to a southward turning of the IMF: Polar UVI, CUTLASS, and IMAGE signatures of transient magnetic flux transfer at the magnetopause. J Geophys Res Space Phys (2000) 105(A7):15741–55. doi:10.1029/2000JA900022
30. Davies JA, Yeoman TK, Rae IJ, Milan SE, Lester M, Lockwood M, et al. Ground-based observations of the auroral zone and polar cap ionospheric responses to dayside transient reconnection. Ann Geophysicae (2002) 20:781–94. European Geophysical Society 2002. doi:10.5194/angeo-20-781-2002
31. Rae IJ, Fenrich FR, Lester M, McWilliams KA, Scudder JD. Solar wind modulation of cusp particle signatures and their associated ionospheric flows. J Geophys Res (2004) 109:A03223. doi:10.1029/2003JA010188
32. Wild JA, Cowley SWH, Davies JA, Khan H, Lester M, Milan SE, et al. First simultaneous observations of flux transfer events at the high-latitude magnetopause by the Cluster spacecraft and pulsed radar signatures in the conjugate ionosphere by the CUTLASS and EISCAT radars. Ann Geophysicae (2001) 19(10/12):1491–508. doi:10.5194/angeo-19-1491-2001
33. Burkholder BL, Chen L-J, Fuselier S, Gershman D, Schiff C, Shuster J, et al. MMS observations of storm-time magnetopause boundary layers in the vicinity of the Southern cusp. Geophys Res Lett (2022) 49:e2022GL101231. doi:10.1029/2022GL101231
34. Moen J, Oksavik K, Alfonsi L, Daabakk Y, Romano V, Spogli L. Space weather challenges of the polar cap ionosphere. J Space Weather Space Clim (2013) 3:02. doi:10.1051/swsc/2013025
35. Gondarenko NA, Guzdar PN. Gradient drift instability in high latitude plasma patches: Ion inertial effects. Geophys Res Lett (1999) 26(22):3345–8. doi:10.1029/1999GL003647
36. Guzdar PN, Gondarenko NA, Chaturvedi PK, Basu S. Three-dimensional nonlinear simulations of the gradient drift instability in the high-latitude ionosphere. Radio Sci (1998) 33(6):1901–13. doi:10.1029/98RS01703
37. Sojka JJ, Subramanium MV, Zhu L, Schunk RW. Gradient drift instability growth rates from global-scale modeling of the polar ionosphere. Radio Sci (1998) 33(6):1915–28. Geophysical Research: Space Physics, 109(A3). doi:10.1029/98RS02490
38. Kelley M. The earth's ionosphere: Plasma Physics and electrodynamics. 2nd ed. Amsterdam: Elsevier (2009). p. 556.
39. Basu S, Basu S, Mackenzie E, Coley WR, Sharber JR, Hoegy WR. Plasma structuring by the gradient drift instability at high-latitudes and comparison with velocity shear driven processes. J Geophys Res (1990) 95(A6):7799–818. doi:10.1029/JA095iA06p07799
40. Carlson HC, Pedersen T, Basu S, Keskinen M, Moen J. Case for a new process, not mechanism, for cusp irregularity production. J Geophys Res (2007) 112:A11304. doi:10.1029/2007JA012384
41. Burston R, Mitchell C, Astin I. Polar cap plasma patch primary linear instability growth rates compared. J Geophys Res Space Phys (2016) 121:3439–51. doi:10.1002/2015JA021895
42. Hosokawa K, Shiokawa K, Otsuka Y, Ogawa T, St-Maurice J-P, Sofko GJ, et al. Relationship between polar cap patches and field-aligned irregularities as observed with an all-sky airglow imager at Resolute Bay and the PolarDARN radar at Rankin Inlet. J Geophys Res (2009) 114:A03306. doi:10.1029/2008JA013707
43. Dahlgren H, Perry GW, Semeter JL, St.-Maurice J-P, Hosokawa K, Nicolls MJ, et al. Space-time variability of polar cap patches: Direct evidence for internal plasma structuring. J Geophys Res (2012) 117:A09312. doi:10.1029/2012JA017961
44. Thomas EG, Baker JBH, Ruohoniemi JM, Clausen LBN, Coster AJ, Foster JC, et al. Direct observations of the role of convection electric field in the formation of a polar tongue of ionization from storm enhanced density. J Geophys Res Space Phys (2013) 118(3):1180–9. doi:10.1002/jgra.50116
45. Shepherd SG. Altitude-adjusted corrected geomagnetic coordinates: Definition and functional approximations. J Geophys Res Space Phys (2014) 119:7501–21. doi:10.1002/2014JA020264
46. Rideout W, Coster A. Automated GPS processing for global total electron content data. GPS solutions (2006) 10:219–28. doi:10.1007/s10291-006-0029-5
47. Villain J-P, André R, Pinnock M, Greenwald RA, Hanuise C. A Statistical study of the Doppler spectral width of high-latitude ionospheric F-region echoes recorded with SuperDARN coherent HF radars. Ann Geophys (2002) 20:1769–81. doi:10.5194/angeo-20-1769-2002
48. Chisham G, Freeman MP. A technique for accurately determining the cusp-region polar cap boundary using SuperDARN HF radar measurements. Ann Geophys (2003) 21:983–96. doi:10.5194/angeo-21-983-2003
49. Oksavik K, Barth VL, Moen J, Lester M. On the entry and transit of high-density plasma across the polar cap. J Geophys Res (2010) 115:A12308. doi:10.1029/2010JA015817
50. Bristow WA, Lyons LR, Nishimura Y, Shepherd SG, Donovan EF. High-latitude plasma convection based on SuperDARN observations and the locally divergence free criterion. J Geophys Res Space Phys (2022) 127:e2022JA030883. doi:10.1029/2022JA030883
51. Bristow WA, Hampton DL, Otto A. High-spatial-resolution velocity measurements derived using Local Divergence-Free Fitting of SuperDARN observations. J Geophys Res Space Phys (2016) 121:1349–61. doi:10.1002/2015JA021862
52. Lyons LR, Nishimura Y, Kim H-J, Donovan E, Angelopoulos V, Sofko G, et al. Possible connection of polar cap flows to pre- and post-substorm onset PBIs and streamers. J Geophys Res (2011) 116:A12225. doi:10.1029/2011JA016850
53. Nishimura Y, Lyons LR, Zou Y, Oksavik K, Moen JI, Clausen LB, et al. Day-night coupling by a localized flow channel visualized by polar cap patch propagation. Geophys Res Lett (2014) 41:3701–9. doi:10.1002/2014GL060301
54. Zou Y, Nishimura Y, Lyons LR, Shiokawa K, Donovan EF, Ruohoniemi JM, et al. Localized polar cap flow enhancement tracing using airglow patches: Statistical properties, IMF dependence, and contribution to polar cap convection. J Geophys Res Space Phys (2015) 120:4064–78. doi:10.1002/2014JA020946
55. Lockwood M, Wild MN. On the quasi-periodic nature of magnetopause flux transfer events. J Geophys Res (1993) 98:5935–40. doi:10.1029/92JA02375
56. Rijnbeek RP, Cowley SWH, Southwood DJ, Russell CT. A survey of dayside flux transfer events observed by ISEE 1 and 2 magnetometers. J Geophys Res (1984) 89:786–800. doi:10.1029/JA089iA02p00786
57. Thomas EG, Hosokawa K, Sakai J, Baker JBH, Ruohoniemi JM, Taguchi S, et al. Multi-instrument, high-resolution imaging of polar cap patch transportation. Radio Sci (2015) 50:904–15. doi:10.1002/2015RS005672
58. Zhang Q-H, Ma YZ, Jayachandran PT, Moen J, Lockwood M, Zhang YL, et al. Polar cap hot patches: Enhanced density structures different from the classical patches in the ionosphere. Geophys Res Lett (2017) 44:8159–67. doi:10.1002/2017GL073439
59. Ma Y-Z, Zhang Q-H, Xing Z-Y, Heelis RA, Oksavik K, Wang Y. The ion/electron temperature characteristics of polar cap classical and hot patches and their influence on ion upflow. Geophys Res Lett (2018) 45:8072–80. doi:10.1029/2018gl079099
60. Foster JC, Coster AJ, Erickson PJ, Holt JM, Lind FD, Rideout W, et al. Multiradar observations of the polar tongue of ionization. J Geophys Res Space Phys (2005) 110(A9):13. doi:10.1029/2004JA010928
61. Knudsen WC. Magnetospheric convection and the high-latitude F 2 ionosphere. J Geophys Res (1974) 79(7):1046–55. doi:10.1029/JA079i007p01046
62. Sojka JJ, Bowline MD, Schunk RW, Decker DT, Valladares CE, Sheehan R, et al. Modeling polar cap F-region patches using time varying convection. Geophys Res Lett (1993) 20(17):1783–6. doi:10.1029/93GL01347
63. Sojka JJ, Bowline MD, Schunk RW. Patches in the polar ionosphere: UT and seasonal dependence. J Geophys Res (1994) 99(A8):14959–14970. doi:10.1029/93JA03327
64. Anderson DN, Buchau J, Heelis RA. Origin of density enhancements in the winter polar cap ionosphere. Radio Sci (1988) 23:513–9. doi:10.1029/RS023i004p00513
65. Valladares CE, Decker DT, Sheehan R, Anderson DN, Bullett T, Reinisch BW. Formation of polar cap patches associated with north-to-south transitions of the interplanetary magnetic field. J Geophys Res (1998) 103(7):14657–70. doi:10.1029/97JA03682
66. Rodger AS, Pinnock M, Dudeney JR, Baker KB, Greenwald RA. A new mechanism for polar patch formation. J Geophys Res (1994) 99(A4):6425–6436. doi:10.1029/93JA01501
67. Millward CH, Moffett RJ, Balmforth HF, Rodger AS. Modeling the ionospheric effects of ion and electron precipitation in the cusp. J Geophys Res (1999) 104:24603–12. doi:10.1029/1999JA900249
68. Lockwood M, Carlson HC. Production of polar cap electron density patches by transient magnetopause reconnection. Geophys Res Lett (1992) 19:1731–4. doi:10.1029/92GL01993
69. Carlson HC. Sharpening our thinking about polar cap ionospheric patch morphology, research, and mitigation techniques. Radio Sci (2012) 47:RS0L21. doi:10.1029/2011RS004946
70. Moen J, Walker IK, Kersley L, Milan SE. On the generation of cusp HF backscatter irregularities. J Geophys Res (2002) 107(A4):1044. doi:10.1029/2001JA000111
71. Moen J, Oksavik K, Abe T, Lester M, Saito Y, Bekkeng TA, et al. First in-situ measurements of HF radar echoing targets. Geophys Res Lett (2012) 39:L07104. doi:10.1029/2012GL051407
72. Spicher A, Cameron T, Grono EM, Yakymenko KN, Buchert SC, Clausen LBN, et al. Observation of polar cap patches and calculation of gradient drift instability growth times: A Swarm case study. Geophys Res Lett (2015) 42:201–6. doi:10.1002/2014GL062590
73. Candidi M, Meng C-I. Low-altitude observations of the conjugate polar cusps. J Geophys Res (1988) 93(A2):923. doi:10.1029/JA093iA02p00923
74. Laundal KM, Reistad JP, Finlay CC, Østgaard N, Tenfjord P, Snekvik K, et al. Interplanetary magnetic field Bx component influence on horizontal and field-aligned currents in the ionosphere. J Geophys Res Space Phys (2018) 123:3360–79. doi:10.1002/2017JA024864
75. Shue J-H, Newell PT, Liou K, Meng C-I, Cowley SWH. Interplanetary magnetic fieldBxasymmetry effect on auroral brightness: Imf Bx asymmetry effect on aurora. J Geophys Res (2002) 107(A8):SIA 16-1–SIA 16-0. doi:10.1029/2001JA000229
76. Baker JB, Ridley AJ, Papitashvili VO, Clauer CR. The dependence of winter aurora on interplanetary parameters. J Geophys Res (2003) 108(A4):8009. doi:10.1029/2002JA009352
77. Stubbs TJ, Vondrak RR, Østgaard N, Sigwarth JB, Frank LA. Simultaneous observations of the auroral ovals in both hemispheres under varying conditions. Geophys Res Lett (2005) 32:L03103. doi:10.1029/2004GL021199
78. Reistad JP, Østgaard N, Laundal KM, Haaland S, Tenfjord P, Snekvik K, et al. Intensity asymmetries in the dusk sector of the poleward auroral oval due to IMF Bx. J Geophys Res Space Phys (2015) 119:9497–507. doi:10.1002/2014JA020216
79. Park J-S, Shi QQ, Shi X, Shue J-H, Degeling AW, Nowada M, et al. Radial interplanetary magnetic field-induced north-south asymmetry in the solar wind-magnetosphere-ionosphere coupling: A case study. J Geophys Res Space Phys (2022) 127:e2021JA030020. doi:10.1029/2021JA030020
80. Peng Z, Wang C, Hu YQ. Role of IMFBx in the solar wind-magnetosphere-ionosphere coupling: Brief report. J Geophys Res Space Phys (2010) 115(A8). doi:10.1029/2010JA015454
81. Hoilijoki S, Souza VM, Walsh BM, Janhunen P, Palmroth M. Magnetopause reconnection and energy conversion as influenced by the dipole tilt and the IMF Bx. J Geophys Res Space Phys (2014) 119(6):4484–94. doi:10.1002/2013JA019693
82. Hoshi Y, Hasegawa H, Kitamura N, Saito Y, Angelopoulos V. Seasonal and solar wind control of the reconnection line location on the Earth’s dayside magnetopause. J Geophys Res Space Phys (2018) 123(9):7498–512. doi:10.1029/2018JA025305
83. Carlson HC, Oksavik K, Moen J, Pedersen T. Ionospheric patch formation: Direct measurements of the origin of a polar cap patch. Geophys Res Lett (2004) 31:L08806. doi:10.1029/2003GL018166
84. Russell CT, Wang YL, Raeder J. Possible dipole tilt dependence of dayside magnetopause reconnection. Geophys Res Lett (2003) 30(18). doi:10.1029/2003GL017725
85. Komar CM, Fermo RL, Cassak PA. Comparative analysis of dayside magnetic reconnection models in global magnetosphere simulations. J Geophys Res Space Phys (2015) 120(1):276–94. doi:10.1002/2014JA020587
86. Kitamura N, Hasegawa H, Saito Y, Shinohara I, Yokota S, Nagai T, et al. Shift of the magnetopause reconnection line to the winter hemisphere under southward IMF conditions: Geotail and MMS observations. Geophys Res Lett (2016) 43(11):5581–8. doi:10.1002/2016GL069095
87. Coley WR, Heelis RA. Seasonal and universal time distribution of patches in the Northern and Southern polar caps. J Geophys Res Space Phys (1998) 103(A12):29229–37. doi:10.1029/1998JA900005
88. Spicher A, Clausen LBN, Miloch WJ, Lofstad V, Jin Y, Moen JI. Interhemispheric study of polar cap patch occurrence based on Swarm in situ data. J Geophys Res Space Phys (2017) 122(3):3837–51. doi:10.1002/2016JA023750
89. Noja M, Stolle C, Park J, Lühr H. Long-term analysis of ionospheric polar patches based on CHAMP TEC data. Radio Sci (2013) 48(3):289–301. doi:10.1002/rds.20033
90. Chartier AT, Mitchell CN, Miller ES. Annual occurrence rates of ionospheric polar cap patches observed using Swarm. J Geophys Res Space Phys (2018) 123(3):2327–35. doi:10.1002/2017JA024811
91. Foster JC, Rideout W. Storm enhanced density: Magnetic conjugacy effects. Ann Geophysicae (2007) 25(8):1791–9. doi:10.5194/angeo-25-1791-2007
92. Coster AJ, Erickson PJ, Foster JC, Thomas EG, Ruohoniemi JM, Baker J. Solar cycle 24 observations of storm-enhanced density and the tongue of ionization. In: Fuller-Rowell T, Yizengaw E, Doherty PH, Basu S, editors. Geophysical monograph series. Hoboken, NJ, USA: John Wiley & Sons, Inc (2016). p. 71–83. doi:10.1002/9781118929216.ch6
93. Yue X, Wan W, Liu L, Liu J, Zhang S, Schreiner WS, et al. Mapping the conjugate and corotating storm-enhanced density during 17 March 2013 storm through data assimilation. J Geophys Res Space Phys (2016) 121(12):12202–10. doi:10.1002/2016JA023038
94. Tsurutani BT, Mannucci A, Iijima B, Abdu MA, Sobral JHA, Gonzalez W., et al. Global dayside ionospheric uplift and enhancement associated with interplanetary electric fields. J Geophys Res (2004) 109:A08302. doi:10.1029/2003JA010342
95. Mannucci AJ, Tsurutani BT, Iijima BA, Komjathy A, Saito A, Gonzalez WD, et al. Dayside global ionospheric response to the major interplanetary events of October 29–30, 2003 Halloween Storms. Geophys Res Lett (2005) 32:L12S02. doi:10.1029/2004GL021467
96. Vlasov M, Kelley MC, Kil H. Analysis of groundbased and satellite observations of F-region behavior during the great magnetic storm of July 15, 2000. J Atmos Solar-Terrestrial Phys (2003) 65:1223–34. doi:10.1016/j.jastp.2003.08.012
97. Huang CS, Foster JC, Kelley MC. Longduration penetration of the interplanetary electric field to the low-latitude ionosphere during the main phase of magnetic storms. J Geophys Res (2005) 110:A11309. doi:10.1029/2005JA011202
98. Heelis RA, Sojka JJ, David M, Schunk RW. Storm time density enhancements in the middle-latitude dayside ionosphere. J Geophys Res (2009) 114:A03315. doi:10.1029/2008JA013690
99. Pokhotelov D, Fernandez-Gomez I, Borries C. Polar tongue of ionisation during geomagnetic superstorm. Ann Geophysicae (2021) 39(5):833–47. doi:10.5194/angeo-39-833-2021
Keywords: hemispheric symmetry/asymmetry, magnetopause reconnection, polar cap patches, pulsed ionospheric flows, poleward moving radar auroral forms (PMRAFs)
Citation: Zou Y, Chen L-J, Walsh BM, Burkholder B, Ma Y, Bristow WA, Lyons LR, Liu J, Tian S, Yadav S, Coster AJ and McWilliams KA (2023) Hemispheric symmetry and asymmetry of poleward moving radar auroral forms (PMRAFs) and associated polar cap patches during a geomagnetic storm. Front. Phys. 11:1174209. doi: 10.3389/fphy.2023.1174209
Received: 26 February 2023; Accepted: 13 June 2023;
Published: 13 July 2023.
Edited by:
Kyle Murphy, Northumbria University, United KingdomReviewed by:
Aimin Du, Chinese Academy of Sciences (CAS), ChinaOctav Marghitu, Space Science Institute, Romania
Copyright © 2023 Zou, Chen, Walsh, Burkholder, Ma, Bristow, Lyons, Liu, Tian, Yadav, Coster and McWilliams. This is an open-access article distributed under the terms of the Creative Commons Attribution License (CC BY). The use, distribution or reproduction in other forums is permitted, provided the original author(s) and the copyright owner(s) are credited and that the original publication in this journal is cited, in accordance with accepted academic practice. No use, distribution or reproduction is permitted which does not comply with these terms.
*Correspondence: Ying Zou, eWluZy56b3VAamh1YXBsLmVkdQ==