
94% of researchers rate our articles as excellent or good
Learn more about the work of our research integrity team to safeguard the quality of each article we publish.
Find out more
METHODS article
Front. Phys., 04 April 2023
Sec. Physical Acoustics and Ultrasonics
Volume 11 - 2023 | https://doi.org/10.3389/fphy.2023.1172536
This article is part of the Research TopicUltrasound Micromanipulations and Ocean Acoustics: From Human Cells to Marine StructuresView all 11 articles
Beamforming technology with spherical microphone arrays (SMAs) is often applied for localizing and identifying noise sources in airplane cabins, automobiles, and submarines. The performance of a SMA signal processing algorithm depends on its physical characteristics, especially the array aperture. The array aperture limits the frequency range of its application, and the small aperture leads to weak performance at low frequencies. In this paper, a large-aperture virtual SMA is obtained through the virtual SMA extrapolation method. Because the radius of the virtual SMA is larger than that of the actual SMA, an approximate low-frequency signal can be obtained, which may improve the localization effect of the low-frequency noise source of the SMA. Firstly, the paper introduces the extrapolation method of SMA, and through the discussion of several typical parameters such as envelope parameters, SMA aperture and signal-to-noise ratio (SNR), the application scope and conditions of SMA extrapolation method are given. In addition, this paper introduces compressed sensing technology (CS) into the calculation process of virtual SMA extrapolation to improve the accuracy of virtual SMA element data. The generalized inverse beamforming (GIB) algorithm is then used to locate and identify noise sources and verify the benefits of the virtual SMA. Simulation and experimental results show that the virtual SMA can locate and identify noise sources with high spatial resolution in the low frequency range.
Beamforming technology is widely used in detecting marine targets, estimating direction of arrival, localizing and identifying signals, etc., [1, 2]. Beamforming technology with SMA is exceedingly popular in localizing and identifying noise sources in the mid-high-frequency range, because its small-size and full-space directivity [3–5].
SMA with the spherical harmonic beamforming (SHB) algorithm is the most commonly used noise source localization and identification method in the mid-high-frequency range. However, SMA with SHB has two drawbacks. On the one hand, SHB uses the orthogonality of spherical harmonic function to locate the sound source, but it needs to carefully select the position and number of array elements, and is vulnerable to noise, resulting in serious side lobe. On the other hand, the spatial resolution of low-frequency noise source localization and identification results is poor, because the aperture of the SMA is small [5–8].
In order to narrow main-lobe and suppress side-lobes, and improve the use effect of the array, scholars have also carried out a lot of research. Scholars have improved the beamforming effect using algorithms, for example, DAMAS and its derivative algorithm [9, 10]. Although this algorithm can obtain high-precision noise source localization and identification results in the mid-high-frequency range, it cannot solve the problem of poor spatial resolution in the low-frequency range due to the limitation of small apertures in the array. The concentric dual-radius SMA [11, 12] has a wider application frequency range than the single SMA. In the dual-radius SMA, the large-radius SMA can effectively compensate for the low-frequency application effect of the small-radius SMA. However, in general, the two radii of a dual radius spherical array are fixed values, and the radius cannot be changed according to the application environment.
This paper proposes a high-resolution low-frequency noise source localization and identification method. The advantage of this method is that it can approximately achieve the low-frequency application effect of the dual-radius SMA without changing the actual SMA. The proposed method first obtains a large-aperture virtual SMA through virtual SMA extrapolation [13–16]. The core of virtual SMA extrapolation is to solve the strength of virtual source from ill-posed inverse problem. In this paper, the compressed sensing method (CS) is introduced into the solution process of virtual source strength, which improves the accuracy of source strength [17]. At the same time, through the discussion and analysis of parameters such as the aperture of the envelope surface and the configuration of the virtual source, the radius of the spherical array, the distribution of the array elements, and the signal-to-noise ratio, the parameter configuration scheme of the virtual array method and its application range and conditions are given. Then generalized inverse beamforming (GIB) is introduced into the localization and identification of the noise source of the virtual SMA [16, 18]. This solves the problem of poor spatial resolution of the low-frequency noise source localization and identification results caused by the small aperture of the SMA.
The remainder of this paper is arranged as follows: Section 2 gives the theory of the SMA extrapolation method and discusses several factors that affect SMA extrapolation. Section 3 gives the principle of the GIB algorithm and describes the simulation experiments of low-frequency noise source localization and identification with GIB, verifying the effectiveness of the virtual SMA extrapolation method. Section 4 is devoted to verifying the accuracy of simulation conclusions and the effectiveness of practical applications through noise source localization and identification experiments. The conclusions are provided in Section 5.
In this paper, the SMA aperture is extrapolated virtually by extrapolating the sound field surrounding the SMA. This method supposes an envelope surface between the sound source and the actual SMA, and there are some virtual sources on the envelope surface S. These virtual sound sources are generated by the actual sound source radiating to the envelope surface S, as shown in Figure 1. After solving the unknown strength of the virtual sources, a virtual SMA with a larger aperture can be obtained by calculating the sound field radiated by the virtual sources in a forward direction [15–17].
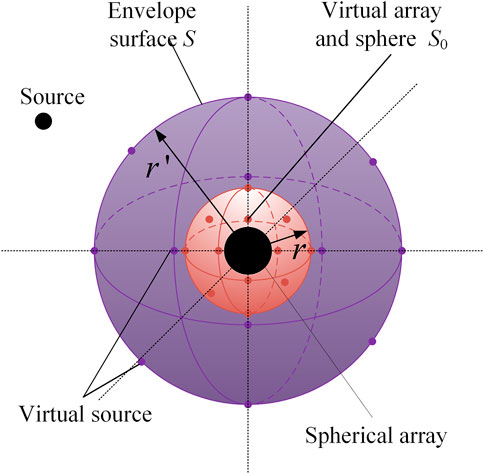
FIGURE 1. Schematic diagram of virtual SMA extrapolation method. The black sphere represents the actual SMA, the red sphere represents the virtual SMA, and the purple sphere represents the envelope surface where the virtual sources are located.
The superposed field generated by the virtual sources can be given by an integral over S:
where p(a) is sound pressure, G(a, r′) is the free-field Green’s function at a field point a (a is the radius of the SMA) caused by the source placed at r′, and q(r′) is the vector of strengths of the virtual sources, satisfying the Helmholtz equation (the time factor e−iωt omitted):
where k is wavenumber, and k = ω/c, c is sound speed in the air.
Consider M virtual sources distributed uniformly on S, Eq. 1 can be written as a matrix form:
where
To stabilize the solution of the inverse problem in the presence of measured noise, the Tikhonov regularization is used:
where λ is the regularization parameter, ‖•‖2 represents L2 norm, and Ω(q) = ‖Lq‖ is the smoothing norm of q with L representing the penalty matrix. For conventional Tikhonov regularization, L is an identity matrix. When L is not an identity matrix, the solution is given by:
where [•]H denotes the complex conjugate transpose. To avoid the lack of information induced by the penalty matrix, the beamforming regularization matrix is adopted Gauthier et al. [13]:
The virtual sources strengths qBF solved by the beamforming regularization matrix method is
According to the above theory, the virtual source is sparse or close to sparse. CS can be used to calculate the source strength of virtual sources. Different from the l2-norm, the l1-norm (‖•‖1) can promote sparsity and the sparse virtual source strengths can be obtained. It is preferable to solve the Eq. 4 by minimizing l1-norm, i.e., [19,20].
where ɛ is the data fidelity constraint. CS has proved that Eq. 9 can be solved by using a convex optimization algorithm to obtain a well-estimated sparse solution with most elements being zero. In the calculation process, the above CS problem with l1-norm optimization is solved by the available Matlab CVX package. The result is the source strengths qBF of the virtual source[21].
After solving the strengths of the virtual sources qBF, the sound field in the envelope surface S can be approximately calculated. Assume that a virtual SMA is placed at a surface S0 (r is the radius of the virtual SMA) as shown in Figure 1. Then, a virtual SMA is used to localize and identify the sound source, the sound pressure pv(rv) received at a point rv on the virtual SMA can be given by:
Before applying the virtual SMA for noise localization and identification, it is necessary to analyze the factors affecting the accuracy of the extrapolation. This section analyzes the parameter sensitivity of the extrapolation. Here, several dominant parameters were considered, including the configuration of the surface where the virtual source is placed, the aperture of the SMA, and the signal-to-noise ratio (SNR). Unless specified, the default parameters treated in the simulations are given as follows: the sound speed c in the air is 340 m/s, the sound source was placed at (5 m, 56°, 201°) in spherical coordinates, the radius of the open SMA a is 0.3 m, and the number of array elements is 64. In order to evaluate the accuracy of the extrapolation, the least square errors of the pressure are defined as follows Zhang et al. [18]:
where pthe and prec are the theoretical and approximate values of sound pressure on the spherical reference surface, respectively.
Two parameters were considered in the simulations, the radius of the surface where the virtual source is placed and the number of virtual sources used [22, 23]. No noise was added during the simulation process, and the simulation results are shown in Figures 2, 3.
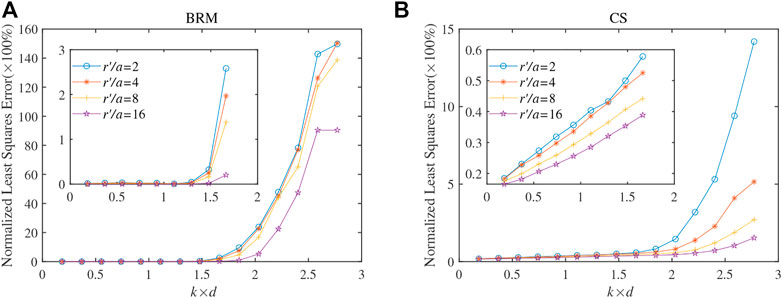
FIGURE 2. The pressure least square errors as a functon of the frequency for different radii of the envelope surfaces. The simulation results of the BRM and CS are shown in (A) and (B), respectively.
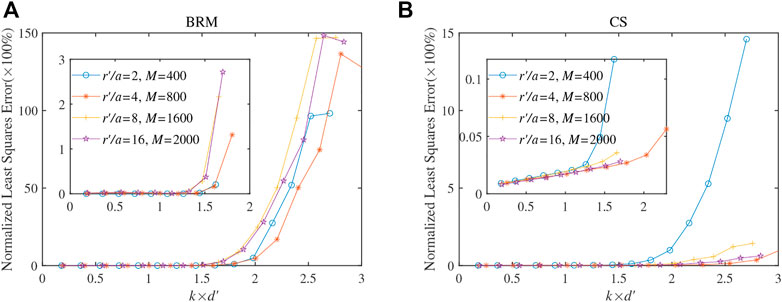
FIGURE 3. The pressure least square errors as a functon of the frequency for different radii of the number of the virtual source at different frequencies. The simulation results of the BRM and CS are shown in (A) and (B), respectively.
Figure 2 demonstrates the errors at different radii of the virtual source surface versus frequency. Here, the radius of virtual source surface r′ was set to be 2, 4, 8, and 16 times that of the open SMA (a = 0.3). In Figure 2, the abscissa represents the product of wave number k and minimum array element spacing d, and the ordinate represents the least square error. For a given radius of the virtual source surface, the error remains stable at around 3% before rapidly increasing to a cut-off frequency of k × d ≈ 2. The cut-off frequency corresponds to an acoustic wavelength of 2/d. Thus, an equivalent of the Nyquist criterion for sampling waveforms is violated at the cut-off frequency, where a sudden increase in the error can be seen. In addition, when k is higher than the cut-off frequency, the larger virtual source radius extrpolation error is smaller. Because the smaller the envelope surface, the smaller the distance between the envelope surface and the SMA. Therefore, the correlation of vectors in the transfer matrix is stronger, and the condition number of the transfer matrix becomes larger, resulting in instability of the inverse problem, especially at higher frequencies.
Next, the influence of the number of virtual sources was researched. Figure 3 displays the errors as a function of the number of virtual sources at different frequencies. In the figure, the abscissa represents the product of wave number k and minimum virtual source spacing d′. In this case, the error curves exhibit similar behavior as those for different configurations of virtual sources, significantly decreasing before the number of virtual sources reaches a specific number M and remaining stable afterward. M also corresponds to an equivalent of the Nyquist criterion for virtual sources. This means that the distribution of the virtual sources also needs to satisfy the Nyquist criterion. At the same time, by comparing Figures 3A, B, it can be found that the array extrapolation error of CS method is smaller under the same sampling scheme.
Apart from the virtual source surface configuration, the aperture of the SMA also affects the extrapolation accuracy. This section investigates the influence of the radius of the open SMA. The simulations in this section kept the same default parameters used in Section 2.1.1. Figure 4 shows the error as a function of the radius of the open SMA at 125, 250, and 500 Hz. Four radii, a = 0.1, 0.2, 0.3, and 0.4 m, were considered in the simulations. And the envelope surface parameter at this time is a fixed value (the radius of the virtual source surface and the number of virtual sources are set according to the curve r′/a = 16 in Figure 2). It can be seen from Figure 4 that as r increases, an overall increasing trend of the error curves can be seen at different frequencies. Moreover, the higher the frequency, the larger the increase of error with r. Further, larger radii of the open SMA will cause smaller errors. This coincides with the observation that stable results of the inverse problem can be obtained when the distance between the virtual source surface and the open SMA is far (small condition number of the transfer matrix). At the same time, by comparing Figures 3A, B, under the same conditions, the virtual SMA error obtained by CS method is smaller.
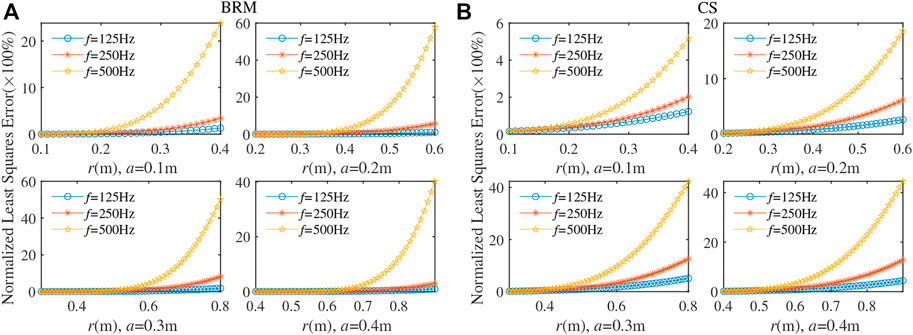
FIGURE 4. The pressure least square errors as a functon of the frequency for different spherical array radius. The simulation results of the BRM and CS are shown in (A) and (B), respectively.
In the actual measurement environment, the received data of the SMA contains environment noise. Using the received data with noise could cause the error of the approximate received data of the virtual SMA to become larger, which affects its subsequent application effect.
Figure 5 shows the error results of different virtual SMA radii as the SNR changes at 125 Hz. The radius of the virtual SMA is 1.5, 2, 2.5, and 3 times that of the actual SMA. It can be seen from Figure 5 that the sound pressure extrapolation error at the virtual SMA is high when the signal to noise ratio is low. Therefore, in order to obtain a better application effect of the virtual SMA, it should be ensured that the SNR of the signal received by the actual SMA is high. An SNR value of at least 20 dB was adopted in the subsequent noise source localization simulations. At the same time, by comparing Figures 5A, B, it can be found that the error of CS method is smaller after SNR is greater than 25 dB. In addition, the extrapolation error of the virtual SMA increases as its radius increases at the same SNR.
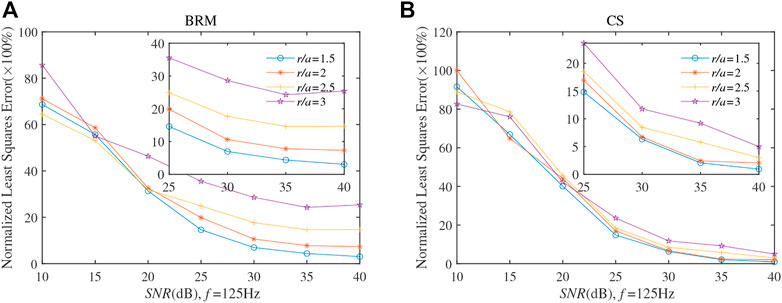
FIGURE 5. The pressure least square errors as a function of SNR at 125 Hz. The simulation results of the BRM and CS are shown in (A) and (B), respectively.
To further improve the resolution of source localization using the virtual extrapolated array (EA) in the presence of sound sources in the low-frequency range, GIB is applied in this paper. The GIB algorithm estimates the source information through the data measured by the array and its sound field transfer relationship (Eq. 4). Generally, the number of microphones used is lower than the number of scanning grid points, thus the general solution of the unknown strength can be written as:
where β is the scaling parameter to compensate for reduced source amplitudes caused by over-regularization, with a mathematical expression of
The actual SMA and virtual SMA data can be substituted into the GIB to realize the noise source localization and identification. Figure 6 shows the schematic diagram of the virtual SMA noise source localization and identification.
In the single sound source simulation experiment, the SMA was the same as the array in the simulation parameter analysis. The single sound source was placed at (1m, 91°, 78°) (marked with ‘×’ in the following figures) in the spherical coordinate system where the SMA was located. The sound source position obtained through simulation calculation is marked with an arrow at the upper left corner of the localization result map. During the simulation calculation, the radius of the virtual SMA was equal to 0.6 m, which is two times that of the actual SMA (a = 0.3 m). The simulation results of the actual SMA with the same radius as the virtual SMA (a = 0.6 m) are also displayed for comparison.
Figures 7, 8 show the simulation results for noise source localization and identification using the actual and virtual SMA at 125 and 500 Hz, respectively. Figure 7A shows the localization result of an open SMA with a radius of 0.3 m, Figures 7B, C show the localization result of a virtual open SMA with a radius of 0.6 m extrapolated from the open SMA, and Figure 7D shows the localization result of an actual open SMA with a radius of 0.6 m. As can be seen from Figure 7, using a virtual open SMA with a radius of 0.6 m at 125 Hz can effectively improve the localization effect of the actual SMA, but the localization effect is slightly worse than a actual SMA with a radius of 0.6 m. It can be found from Figures 7, 8, the virtual SMA extrapolation method has obvious advantages. As can be seen from Figure 4, when the SNR is 20dB, the higher the sound source frequency, the extrapolation error of the SMA becomes larger. Therefore, some interference appears in the localization result graph, but this does not affect the localization result.
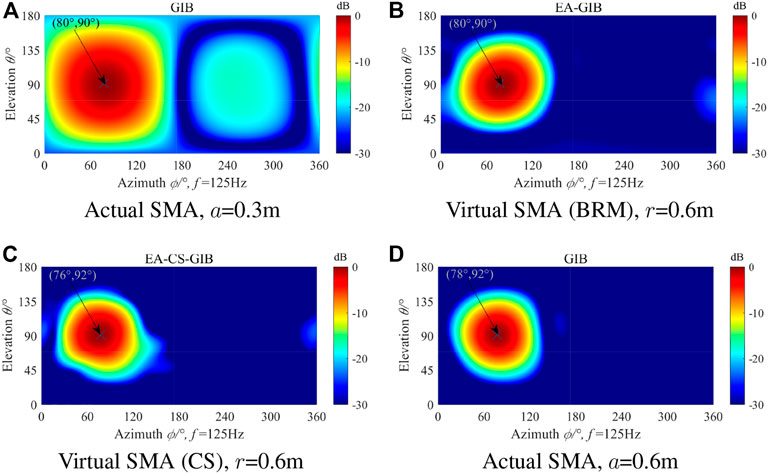
FIGURE 7. The simulation results for single source localization and identification using the virtual SMA in (B) and (C) at 125 Hz and SNR = 20dB, and using the actual SMA shown in (A) and (D) for comparison purposes.
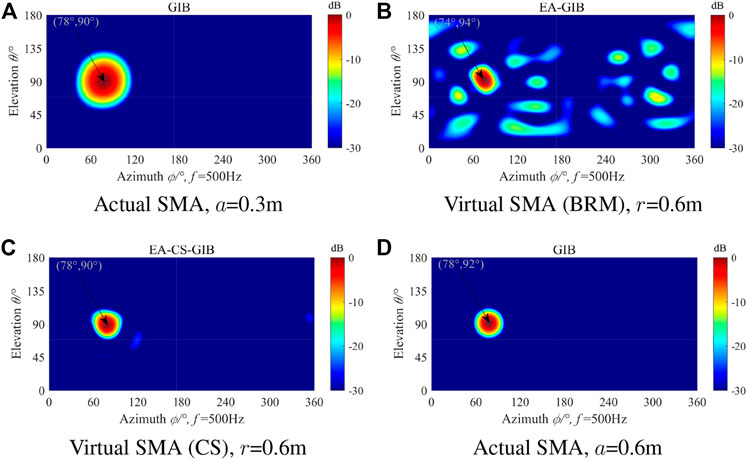
FIGURE 8. The simulation results for single source localization and identification using the virtual SMA in (B) and (C) at 500 Hz and SNR = 20dB, and using the actual SMA shown in (A) and (D) for comparison purposes.
The single sound source localization and identification simulations described above proved the advantages of the SMA extrapolation method researched in this paper in the low-frequency range. In the double sound sources simulation experiment, the SMA is the same as that in the single sound source simulation. The sound source position is located at (1 m, 91°, 78°) and (1 m, 89°, 160°) in the spherical coordinate system where the SMA is located, and the virtual SMA radius (0.6 m) is set to be 2 times that of the actual SMA. The simulation results of the actual SMA with the same radius as the virtual SMA are also displayed for comparison and analysis.
Figures 9, 10 show the simulation results of noise source localization and identification using the actual and virtual SMA when SNR = 20 dB at 125 and 500Hz, respectively. It can be seen from Figure 9 that the actual open SMA with a radius of 0.3 m cannot distinguish the two sound sources at 125 Hz, but after the extrapolation method is used to obtain a virtual SMA with a radius of 0.6 m the two sound sources can be clearly distinguished. As can be seen from Figures 9B, C, the virtual SMA obtained by CS method has better resolution effect on two sound sources. But its effect is not as good as the actual SMA with a radius of 0.6 m. It can be seen from Figure 10 that with the increase of sound source frequency, the actual SMA with a radius of 0.3 m can effectively distinguish two sound sources, and the virtual SMA can also distinguish two sound sources. However, due to the increase of the sound source frequency, the SMA extrapolation effect becomes worse, and the sidelobe interference appears in the localization result.
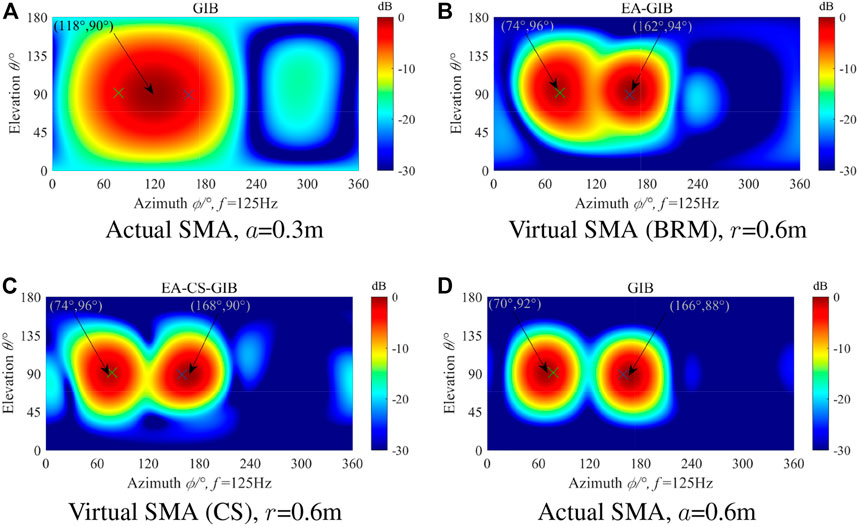
FIGURE 9. The simulation results for double sources localization and identification using the virtual SMA in (B) and (C) at 125 Hz and SNR = 20dB, and using the actual SMA shown in (A) and (D) for comparison purposes.
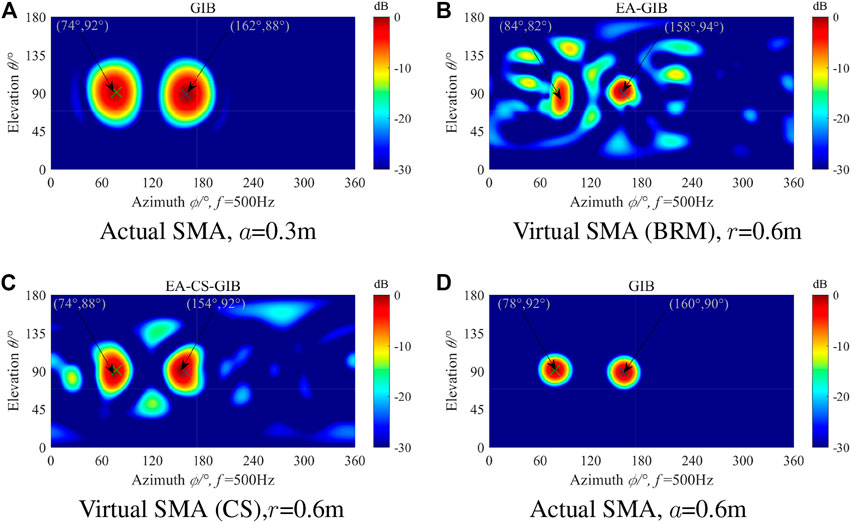
FIGURE 10. The simulation results for double sources localization and identification using the virtual SMA in (B) and (C)at 500 Hz and SNR = 20dB, and using the actual SMA shown in (A) and (D) for comparison purposes.
The simulation experiments of noise source localization and identification in the case of single and double sound sources indicate that the SMA extrapolation method explored in this paper provides some advantages in the low-frequency range. In this section, an experiment with locating loudspeakers based on the open SMA (a = 0.3 m) in an empty room is carried out to verify the accuracy and effectiveness of the extrapolation method in an actual environment. The signal generator (Agilent33522A) in the launching system generates signals to drive the loudspeakers to radiate sound waves. In the receiving system, the sound waves are received by a 64-element randomly and uniformly distributed open SMA (BSWA MPA201 Microphone), collected by the multi-channel data collector (B&K PULSE 3660D) stored in the computer, and then displayed by the computer. Photos of the test site are shown in Figure 11. During the test, the two loudspeakers were located at (1 m, 91°, 78°) and (1 m, 89°, 160°) in the spherical coordinate system, which was established with the center of the open SMA at the origin. In the experiment with the single sound source, only the sound source at position 1 worked. In the experiment with a double sound source, both sound sources worked at the same time.
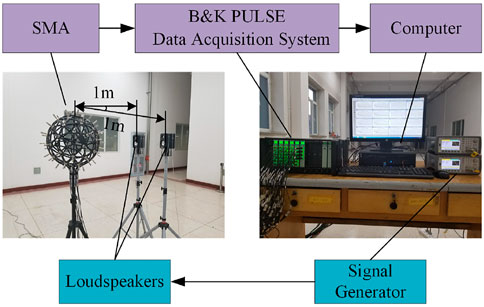
FIGURE 11. Experimental setup.The blue background text at the bottom of the figure represents an experimental signal transmission system consisting of a signal generator and loudspeakers. The purple background text at the top of the figure represents an experimental receiving system consisting of an SMA, data acquisition system, and computer.
Figures 12, 13 show the experimental data processing results when the sound source frequency is 125 and 500 Hz. It can be seen from the figure that the position of the sound source could be accurately localized with the virtual SMA extrapolation method adopting 125 and 500 Hz. Compared with Figures 12A–C, after adopting the virtual SMA, the width of the mainlobe of the beam in the GIB algorithm is narrower and the sound source localization effect is better. At the same time, through Figures 12B, C, we can see that the virtual SMA obtained by CS method is better. As shown in Figure 13, the increase of the sound source frequency, the transmitting ability of the loudspeaker increases, and the SNR of the signal received by the SMA is higher, the width of the main lobe is narrower and the sound source localization effect is better.

FIGURE 12. The experimental results for single source localization and identification using the actual SMA in (A) at 125 Hz, and the virtual SMA shown in (B) and (C).

FIGURE 13. The experimental results for single source localization and identification using the actual SMA in (A) at 500 Hz, and the virtual SMA shown in (B) and (C).
Next, both loudspeakers were switched on in order to conduct the experiment with a double source. Figures 14, 15 show the experimental results for two sound sources at frequencies of 250 Hz (The low frequency emission capability of the loudspeaker used in the experiment is limited, making it difficult to ensure a high SNR at 125 Hz. Therefore, 250 Hz was used as the experimental frequency.) and 500 Hz. It can be seen from the figure that when the sound source frequency is equal to 250 Hz, the actual SMA cannot accurately distinguish the two sound sources, while the virtual SMA can completely distinguish the two sound sources and their positions accurately. And the localization effect of the virtual SMA obtained by CS method is better. When the sound source frequency is equal to 500 Hz, the actual and the virtual SMA can distinguish the two sound sources. And the virtual SMA has higher accuracy, a narrower mainlobe, and a better localization effect than the actual SMA.

FIGURE 14. The experimental results for double sources localization and identification using the actual SMA in (A) at 250 Hz, and the virtual SMA shown in (B) and (C).

FIGURE 15. The experimental results for double sources localization and identification using the actual SMA in (A) at 500 Hz, and the virtual SMA shown in (B) and (C).
This paper proposes a low-frequency noise sources localization method based on the virtual SMA extrapolation method and resolves the localization problem of a small-aperture SMA with low-frequency noise sources. Firstly, this paper introduces the method and principle of the virtual SMA extrapolation method and discusses in detail the selection of parameters, the scope of application, and the influence on the array extrapolation of the envelope surface aperture, SMA aperture, and SNR. At the same time, the CS technology is introduced into the extrapolation of the virtual SMA, which further improves the reception accuracy of the virtual SMA. Secondly, the GIB algorithm was introduced into the noise source localization and identification process, and the appropriate virtual SMA radius was selected according to the above parameter discussion. The simulation results show that the error of the virtual SMA obtained by the CS method is smaller, and it also proves the advantages of the virtual SMA extrapolation method in the low-frequency noise source localization and identification. Finally, an experiment with noise source localization and identification of the open SMA was carried out. The experimental results verify the accuracy of the simulation calculation and its effectiveness in an actual environment. The proposed method provides an effective solution for solving the problem of poor low-frequency spatial resolution of small-aperture SMAs and expands the application range of small-aperture SMAs. At the same time, it is proved that the method simultaneously reduces the complexity and cost of the measurement system, which has great engineering application value and prospects.
The raw data supporting the conclusion of this article will be made available by the authors, without undue reservation.
SS and BY contributed to the conception of the study; BY, QG, and CG carried out experiments; BY performed the data analyses and wrote the manuscript; YL and CG helped to review and revise the manuscript. All authors contributed to the article and approved the submitted version.
The authors declare that the research was conducted in the absence of any commercial or financial relationships that could be construed as a potential conflict of interest.
All claims expressed in this article are solely those of the authors and do not necessarily represent those of their affiliated organizations, or those of the publisher, the editors and the reviewers. Any product that may be evaluated in this article, or claim that may be made by its manufacturer, is not guaranteed or endorsed by the publisher.
1. Ginn KB, Haddad K. Noise source identification techniques: Simple to advanced applications. In: Proceedings of the Acoustics; Nantes, France (2012). p. 1781–6.
2. Chiariotti P, Martarelli M, Castellini P. Acoustic beamforming for noise source localization–reviews, methodology and applications. Mech Syst Signal Process (2019) 120:422–48. doi:10.1016/j.ymssp.2018.09.019
3. Yang Y, Chu Z, Shen L, Xu Z. Functional delay and sum beamforming for three-dimensional acoustic source identification with solid spherical arrays. J Sound Vib (2016) 373:340–59. doi:10.1016/j.jsv.2016.03.024
4. Haddad K, Hald J. 3d localization of acoustic sources with a spherical array. The J Acoust Soc America (2008) 123:3311. doi:10.1121/1.2933754
5. Balmages I, Rafaely B. Open-sphere designs for spherical microphone arrays. IEEE Trans Audio Speech Lang Process (2007) 15:727–32. doi:10.1109/TASL.2006.881671
6. Rafaely B. Phase-mode versus delay-and-sum spherical microphone array processing. IEEE Signal Process. Lett (2015) 12, 713–6.
7. Tiana-Roig E, Torras-Rosell A, Fernandez-Grande E, Jeong C-H, Agerkvist FT. Enhancing the beamforming map of spherical arrays at low frequencies using acoustic holography. In: 5th Berlin Beamforming Conference (2014).
8. Yan S, Sun H, Svensson UP, Ma X, Hovem JM. Optimal modal beamforming for spherical microphone arrays. IEEE Trans Audio Speech Lang Process (2011) 19:361–71. doi:10.1109/TASL.2010.2047815
9. Chu Z, Yang Y, He Y. Deconvolution for three-dimensional acoustic source identification based on spherical harmonics beamforming. J Sound Vib (2015) 344:484–502. doi:10.1016/j.jsv.2015.01.047
10. Chu Z, Zhao S, Yang Y, Yang Y. Deconvolution using clean-sc for acoustic source identification with spherical microphone arrays. J Sound Vib (2019) 440:161–73. doi:10.1016/j.jsv.2018.10.030
11. Parthy A, Jin C, van Schaik A. Measured and theoretical performance comparison of a co-centred rigid and open spherical microphone array. In: 2008 International Conference on Audio, Language and Image Processing (2008). p. 1289–1294. doi:10.1109/ICALIP.2008.4590251
12. Jin CT, Epain N, Parthy A. Design, optimization and evaluation of a dual-radius spherical microphone array. IEEE/ACM Trans Audio, Speech, Lang Process (2014) 22:193–204. doi:10.1109/TASLP.2013.2286920
13. Gauthier P-A, Camier C, Pasco Y, Berry A, Chambatte E, Lapointe R, et al. Beamforming regularization matrix and inverse problems applied to sound field measurement and extrapolation using microphone array. J Sound Vib (2011) 330:5852–77. doi:10.1016/j.jsv.2011.07.022
14. Gauthier P-A, Chambatte r., Camier C, Pasco Y, Berry A. Beamforming regularization, scaling matrices, and inverse problems for sound field extrapolation and characterization: Part ii–experiments. J Audio Eng Soc (2014) 62:207–19. doi:10.17743/jaes.2014.0017
15. Padois T, Gauthier P-A, Berry A. Inverse problem with beamforming regularization matrix applied to sound source localization in closed wind-tunnel using microphone array. J Sound Vib (2014) 333:6858–68. doi:10.1016/j.jsv.2014.07.028
16. Yang B, Shi S, Yang D. Acoustic source localization using the open spherical microphone array in the low-frequency range. MATEC Web of Conf (2019) 283:04001. doi:10.1051/matecconf/201928304001
17. Ping G, Chu Z, Yang Y, Xu Z. Wideband holography based spherical equivalent source method with rigid spherical arrays. Mech Syst Signal Process (2018) 111:303–13. doi:10.1016/j.ymssp.2018.04.006
18. Zhang Z, Chen S, Xu Z, He Y, Li S. Iterative regularization method in generalized inverse beamforming. J Sound Vib (2017) 396:108–21. doi:10.1016/j.jsv.2017.02.044
19. Wang Y, Chen K. Compressive sensing based spherical harmonics decomposition of a low frequency sound field within a cylindrical cavity. J Acoust Soc Am (2017) 141:1812–23. doi:10.1121/1.4978247
20. Bi C-X, Liu Y, Xu L, Zhang YB. Sound field reconstruction using compressed modal equivalent point source method. J Acoust Soc Am (2017) 141:73–9. doi:10.1121/1.4973567
22. He T, Mo S, Fang E, Wang M, Zhang R. Modeling three-dimensional underwater acoustic propagation over multi-layered fluid seabeds using the equivalent source method. J Acoust Soc Am (2021) 150:2854–64. doi:10.1121/10.0006663
Keywords: low-frequency sound source, localization and identification, spherical microphone arrays, array extrapolation, compressed sensing
Citation: Shi S, Yang B, Guo Q, Li Y and Gui C (2023) Low-frequency sound source localization and identification with spherical microphone arrays extrapolation method. Front. Phys. 11:1172536. doi: 10.3389/fphy.2023.1172536
Received: 23 February 2023; Accepted: 23 March 2023;
Published: 04 April 2023.
Edited by:
Zhixiong Gong, Shanghai Jiao Tong University, ChinaReviewed by:
Pierre Grandjean, Université de Sherbrooke, CanadaCopyright © 2023 Shi, Yang, Guo, Li and Gui. This is an open-access article distributed under the terms of the Creative Commons Attribution License (CC BY). The use, distribution or reproduction in other forums is permitted, provided the original author(s) and the copyright owner(s) are credited and that the original publication in this journal is cited, in accordance with accepted academic practice. No use, distribution or reproduction is permitted which does not comply with these terms.
*Correspondence: Chenyang Gui, Z3VpY2hlbnlhbmdAaHJiZXUuZWR1LmNu
Disclaimer: All claims expressed in this article are solely those of the authors and do not necessarily represent those of their affiliated organizations, or those of the publisher, the editors and the reviewers. Any product that may be evaluated in this article or claim that may be made by its manufacturer is not guaranteed or endorsed by the publisher.
Research integrity at Frontiers

Learn more about the work of our research integrity team to safeguard the quality of each article we publish.