 Shinnosuke Hirata
 Akiho Isshiki2
 Po-Hsiang Tsui
 Tadashi Yamaguchi
95% of researchers rate our articles as excellent or good
Learn more about the work of our research integrity team to safeguard the quality of each article we publish.
Find out more
ORIGINAL RESEARCH article
Front. Phys. , 28 June 2023
Sec. Medical Physics and Imaging
Volume 11 - 2023 | https://doi.org/10.3389/fphy.2023.1164622
This article is part of the Research Topic Advances in Quantitative Ultrasound Imaging: Functional Imaging and Tissue Characterization View all 6 articles
Introduction: Assessing the stage of liver fibrosis during the diagnosis and follow-up of patients with diffuse liver disease is crucial. The tissue structure in the fibrotic liver is reflected in the texture and contrast of an ultrasound image, with the pixel brightness indicating the intensity of the echo envelope. Therefore, the progression of liver fibrosis can be evaluated non-invasively by analyzing ultrasound images.
Methods: A convolutional-neural-network (CNN) classification of ultrasound images was applied to estimate liver fibrosis. In this study, the colorization of the ultrasound images using echo-envelope statistics that correspond to the features of the images is proposed to improve the accuracy of CNN classification. In the proposed method, the ultrasound image is modulated by the 3rd- and 4th-order moments of pixel brightness. The two modulated images and the original image were then synthesized into a color image of RGB representation.
Results and Discussion: The colorized ultrasound images were classified via transfer learning of VGG-16 to evaluate the effect of colorization. Of the 80 ultrasound images with liver fibrosis stages F1–F4, 38 images were accurately classified by the CNN using the original ultrasound images, whereas 47 images were classified by the proposed method.
In diffuse liver disease, inflammation, necrosis, and regeneration of the liver parenchyma are repeated in chronic infections caused by HBV and/or HCV, alcoholic hepatitis, and non-alcoholic steatohepatitis. Diffuse liver disease is often associated with irreversible fibrogenesis. The fibrous tissue occurs and develops around the necrotic parenchyma. This eventually leads to liver cirrhosis and hepatocellular carcinoma [1, 2]. The progression of liver fibrosis is the most important indicator of the patient’s prognosis. Liver fibrosis is conventionally diagnosed quantitatively by liver biopsy, ultrasound transient elastography (TE), and ultrasound shear wave elastography (SWE). Pathological examination using a liver biopsy remains the gold standard for determining the stage of liver fibrosis [3]. However, liver biopsy is a highly invasive procedure, often accompanied by complications [4]. Furthermore, there is the possibility of sampling errors [5]. In TE and SWE, shear waves are induced inside the liver by a mechanical vibrator or an acoustic radiation force impulse (ARFI). The elasticity of the liver is then estimated non-invasively from the propagation speed of the shear wave. However, congestion or inflammation, other than fibrosis, can also increase the liver elasticity [6], and the shear wave speed is physically affected by the viscosity of the medium.
The variation in the tissue structure because of liver fibrosis is equivalent to the variations in the number density, distribution, and scattering intensities of the scatterers that generate ultrasound echoes. The tissue structure severely affects the texture and contrast of the ultrasound image, whose pixel brightness indicates the intensity of the echo envelope. Although the tissue structure and the ultrasound image do not directly correspond because of the interference of echoes, the progression of liver fibrosis can be evaluated by ultrasound image analysis. Tissue characterization of the liver based on the features of ultrasound images, such as echo-envelope statistics, co-occurrence matrices, and size zone matrices, has been reported [7–13].
A convolutional neural network (CNN) using ultrasound images as the input has been applied for segmentation, beamforming, noise reduction, and classification [14–22]. The CNN classification of ultrasound images by the stages of liver fibrosis has also been reported [18–22]. In these studies, the original grayscale images obtained using conventional ultrasound scanners were used and classified. However, colored images are often used as the input in the common pretrained CNNs, such as ImageNet, GoogLeNet, VGG, and ResNet. Therefore, in this study, modulation and colorization of ultrasound images using echo-envelope statistics were proposed to improve the potential performance of CNNs. In the proposed method, the ultrasound image is modulated at different moments in the echo-envelope statistics. The colorized ultrasound image comprises modulated and original images in the red, green, and blue (RGB) representation. Colorization associated with liver fibrosis is a promising method to improve the accuracy of CNN classification. In this study, a combination of third- and fourth-order moments was used as an effective echo-envelope statistic. Furthermore, the accuracy of liver fibrosis estimation and the effect of colorization were evaluated via transfer learning of VGG-16.
Clinical data from patients infected with HBV and/or HCV obtained from the Chang Gung Memorial Hospital, Linkou, Taiwan, were used in this study. An ultrasound scanner (Model 3000; Terason, Burlington, MA, United States) was used to acquire the raw echo data on the liver. The center frequency of the ultrasound transmitted from the convex array probe (Model5C2A; Terason) was 3.5 MHz. The focal depth was fixed at 40 mm. The echo data up to a depth of 80 mm were stored at a sampling frequency of 30 MHz.
Pathological examinations were performed by liver biopsy and blood tests in all patients. Physicians made a definitive diagnosis of viral hepatitis and segmented the liver region from the ultrasound image. The stages of liver fibrosis were assessed according to the METAVIR scoring system as follows: normal liver (F0), early to severe fibrosis (F1–F3), and cirrhosis (F4). The number of patients with a METAVIR score of F0 was insufficient. Furthermore, if the amount of data in each stage is different, a learning bias toward the large-data stage can occur. Therefore, cases F1–F4 were used for CNN classification. Twenty images, whose liver regions were relatively large, were selected for each stage. Therefore, 80 images were used in this study. Moreover, liver steatosis was classified according to intracellular fatty deposition: grade 0, healthy (<5%); grade 1, mild (5–33%); grade 2, moderate (34–66%); and grade 3, severe (>66%) [23]. Of the 80 images, 39 were assessed as grade 0 and the remaining data were assessed as grade 1.
In this study, the envelopes of raw echo data without log-compression were analyzed. The ultrasound images were reconstructed by the scan conversion (rearrangement along the scan line of the convex probe) of the envelopes. Pixel spacings in the lateral and depth directions of the image were 64.9 and 63.3 μm, respectively. An ultrasound echo attenuates as it propagates over a distance. Therefore, the received signals are amplified with the propagated distance (reception time) in an ultrasound scanner. However, the amplification factors do not fully correspond to the actual attenuation in tissues. Furthermore, the intensities of the echoes are changed by the effects of transmission and reception focuses. In Figure 1A, the region around a depth of 50 mm is brighter because of these effects. In this study, these effects were cancelled by normalization using locally estimated second-order moments. To normalize each pixel, the second-order moment of the envelopes in the region around the pixel was estimated, as illustrated in Figure 1B. The region was ellipse-shaped, centered on the pixel, and 12 (4
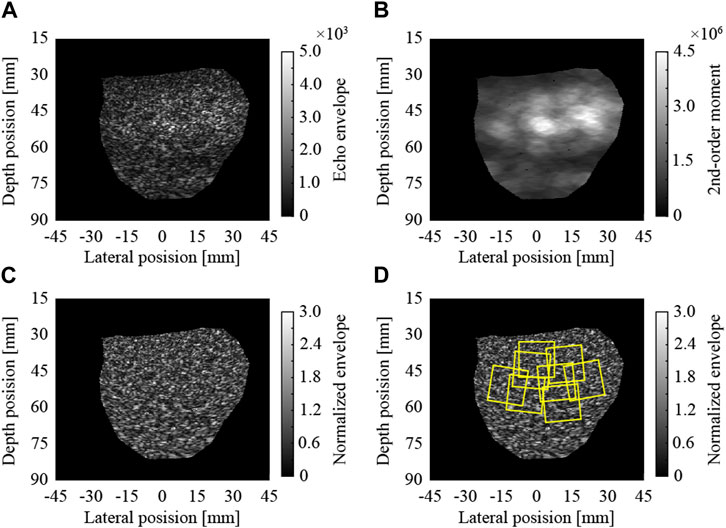
FIGURE 1. Normalization of ultrasound image and extraction of regions of interest; (A) envelopes of raw echo data, (B) local 2nd-order moments, (C) normalized envelopes, and (D) extracted ROIs.
As indicated in Table 1, 27,046 ROIs were extracted from the 80 ultrasound images. Approximately, a hundred to a few hundred ROIs could be extracted from a single ultrasound image. First, the moments in the echo-envelope statistics of all ROIs were investigated. In each ROI, the first-, second-, third-, and fourth-order moments were estimated from all pixels. The first-, third-, and fourth-order moments were then divided by the root, three-half power, and square of the second-order moment for normalization. The first-, third-, and fourth-order moments of all ROIs are shown in Figure 2. All-order moments vary depending on the stage of liver fibrosis. However, the dispersion of moments in each stage was high compared to the interquartile range (IQR) of moments. If echoes generated not from the liver parenchyma or fibrous tissues but from the vessel walls or lipid droplets are included in an ROI, the moments of the ROI do not correspond to the stage of liver fibrosis. Therefore, such inadequate ROIs should be removed in echo-envelope statistics-based analyses.
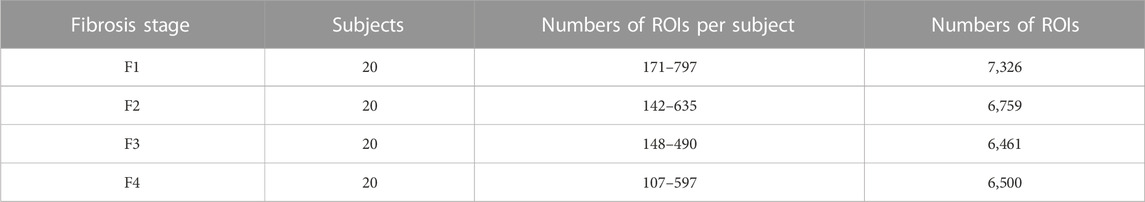
TABLE 1. Numbers of regions of interest (ROIs) (15 mm
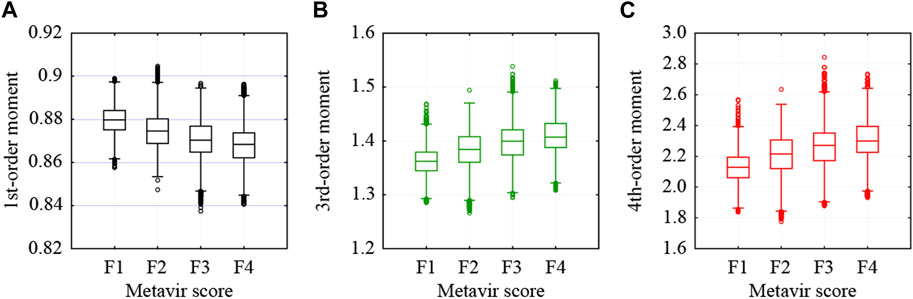
FIGURE 2. Moments estimated from all pixels in each ROI: (A) first-, (B) third-, and (C) fourth-order moments.
In this study, the moments of adequate ROI were estimated from the liver fibrosis stages and inadequate ROIs were removed using the thresholds of the moments. The probability density function (PDF) of an ultrasound image of a fibrotic liver can be approximated using various probability distribution models [9–12]. The multi-Rayleigh model (MRM) is expressed by two different Rayleigh distributions, which are associated with those from the liver parenchyma and fibrous tissue regions, as illustrated in Figure 3. The MRM is expressed using Eq. 1:
where x is the envelope in each pixel, the variance
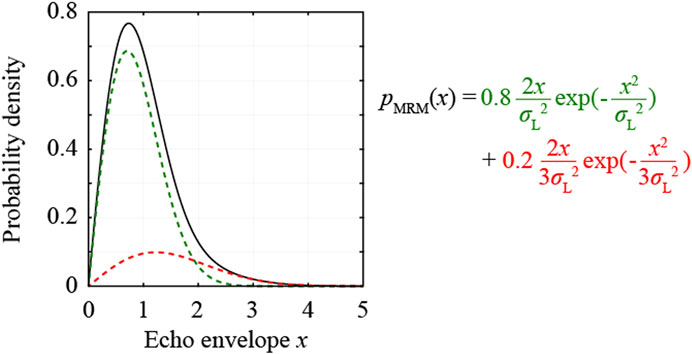
FIGURE 3. Probability density function of the multi-Rayleigh model with the variance ratio
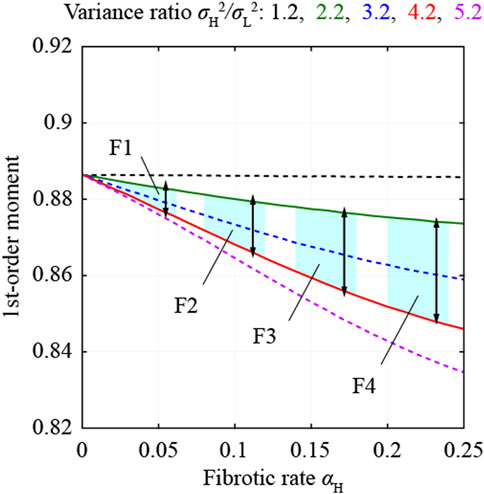
FIGURE 4. First-order moments estimated from the multi-Rayleigh models and thresholds to select ROIs.
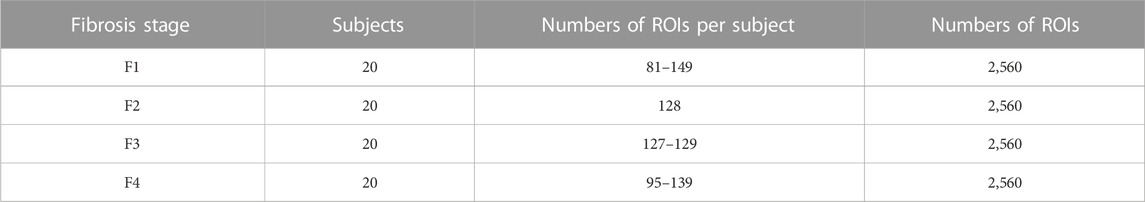
TABLE 2. Numbers of regions of interest (ROIs) used for CNN classification.
In this study, the third- and fourth-order moments estimated from all the pixels were used for the colorization of the ROIs. The third- and fourth-order moments of the selected ROIs are shown in Figure 5. Both moments increase depending on the stage of liver fibrosis. First, the moments were normalized from −1 to 1 using the theoretical moments estimated from the MRMs. In the case of the third-order moment, the moments from 1.335 to 1.508, which were estimated from MRM1 with the variance ratio of 2.2 and the fibrotic rate of 0.02, and MRM2 with the variance ratio of 4.2 and the fibrotic rate of 0.24, were adopted to increase from −1 to 1. In the case of the fourth-order moment, the moments from 2.021 to 2.720, which were also estimated from MRM1 and MRM2, were adopted to decrease from 1 to −1.
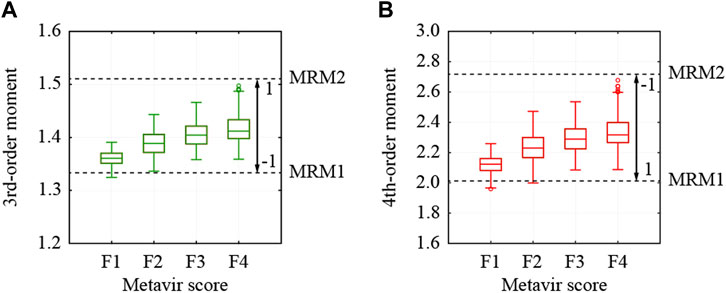
FIGURE 5. Moments estimated from all pixels in used ROI and thresholds to normalize moments; (A) 3rd- and (B) 4th-order moments.
For colorization, the ROIs were modulated using normalized third- and fourth-order moments. The modulated envelopes are expressed using Eqs 2, 3:
where
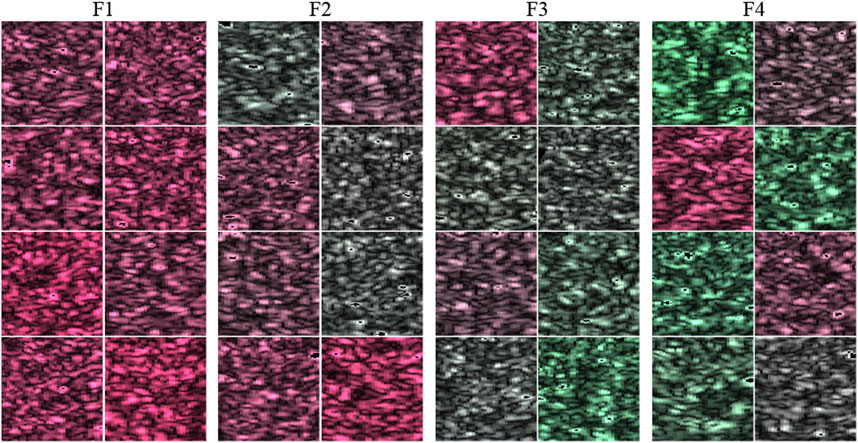
FIGURE 6. Example of colorized ROI in 32 cases.
The colorized and original ROIs were used for comparison to train, validate, and test the VGG-16 pretrained network. In this study, the VGG-16 in the Deep Learning Toolbox in MATLAB was used for CNN classification. VGG-16 comprises 13 convolution layers and three fully connected layers. To classify the METAVIR scores from F1 to F4, the last fully connected layer was replaced with a new layer (input: 4,096 and output: 4), as illustrated in Figure 7. The weights of the new layer (fully connected 8) were initialized using random numbers. In transfer learning, only the last two convolutional layers (convolution 5-2 and 5-3) and three fully connected layers (fully connected 6, 7, and 8) were trained to prevent early overfitting. Training was performed using a stochastic gradient descent with a mini-batch processing of 64 images. The dropouts between the fully connected layers were 70%. With a simple scheme for training, validation, and testing using different datasets, it is impossible to avoid the effects of dataset bias. Therefore, a five-fold cross-validation was performed. The 10,240 ROIs of 80 ultrasound images were divided into five sets, with 2,048 ROIs from 16 ultrasound images in each set. Three of the five sets were used as training sets with one used as a validation set and the remaining used as a test set. Data augmentation was performed on the training sets by horizontal flipping. The learning rates were randomly varied from
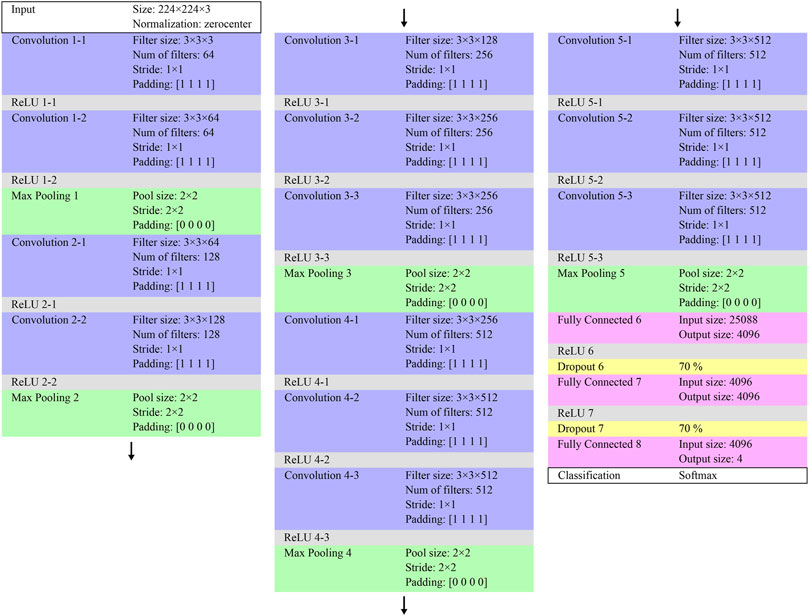
FIGURE 7. Architecture of the partly replaced VGG-16.
The results of the five-fold cross-validation for the CNN classification of the original and colorized ROIs are listed in Table 3. The confusion matrix of the predicted and true liver fibrosis stages for all ROIs is shown in Figure 8. The accuracies of the CNN classification of the original ROIs with the stages at F1, F2, F3, F4, and total were 48.24%, 38.52%, 24.65%, 37.27%, and 37.17%, respectively, and the colorized ROIs were 85.98%, 25.35%, 41.33%, 50.78%, and 50.76%, respectively. The correlation coefficients between the predicted and true stages of the original and colored ROIs were 0.349 and 0.665, respectively. The total accuracy and correlation coefficient were improved by colorization. The colorized ROIs of F1 were accurately classified, whereas those of F2 were poorly classified.
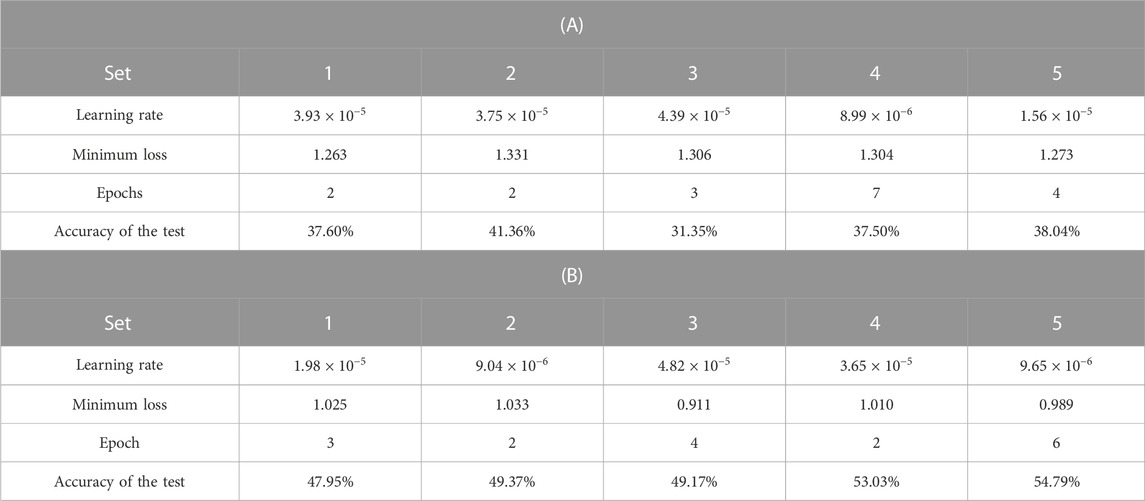
TABLE 3. Results of five-fold cross-validation for the CNN classification of ultrasound images by liver fibrosis stages; (A) original grayscale ROIs and (B) colorized ROIs.

FIGURE 8. Confusion matrix in the CNN classification of 10,240 ROIs by liver fibrosis stages; (A) original grayscale ROIs and (B) colorized ROIs.
To investigate the effect of colorization on CNN classification, the relationship between the predicted stages and third-order moments was examined. The abscissa axis indicates the third-order moment of each ROI, the ordinate axis indicates the number of ROIs, and the colors in the bar charts indicate the predicted stages, as shown in Figure 9. In the CNN classification of the original ROIs, the predicted stages and moments are almost uncorrelated, as shown in Figures 9A–D. Therefore, the echo-envelope statistics of the ultrasound images did not influence the CNN classification. The colorized ROIs were classified based on the colors corresponding to the moments, as shown in Figures 9E–H. The correlation coefficients between the predicted stages and the third-order moments increased from 0.440 to 0.806 after colorization. However, in terms of moments, the difficulty of the classifying F2 was confirmed. Some ROIs of F2 with low third-order moments were classified as F1, whereas those with high third-order moments were classified as F3.
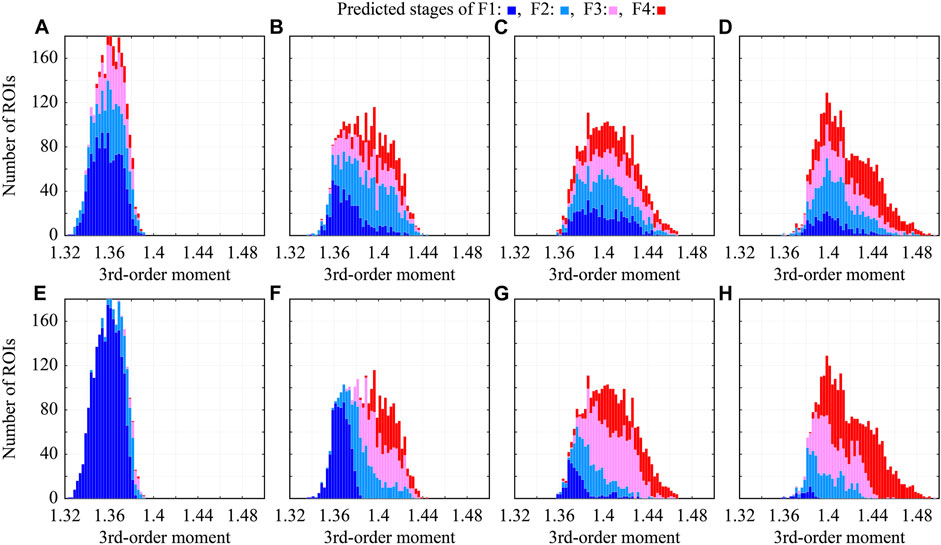
FIGURE 9. Relationship between predicted stages and third-order moments in CNN classification; (A–D) original grayscale ROIs, (E–H) colorized ROIs, (A,E) ROIs of F1, (B,F) ROIs of F2, (C,G) ROIs of F3, and (D,H) ROIs of F4.
In the proposed method, approximately 128 ROIs were extracted from one ultrasound image and classified according to the liver fibrosis stages. Therefore, voting for the predicted stages of all ROIs in each image can be performed. The stage of each ultrasound image was estimated by hard voting of the predicted original and colorized ROIs. The confusion matrix of the estimated and true liver fibrosis stages for all ultrasound images is shown in Figure 10. In the case of original ROIs, the accuracies of the images at the stages of F1, F2, F3, F4, and total were 65%, 50%, 25%, 50%, and 47.5%, respectively. In the case of colorized ROIs, they were 100%, 15%, 55%, 65%, and 58.75%, respectively. Except for the ultrasound images of F2, the accuracy was improved by hard voting.
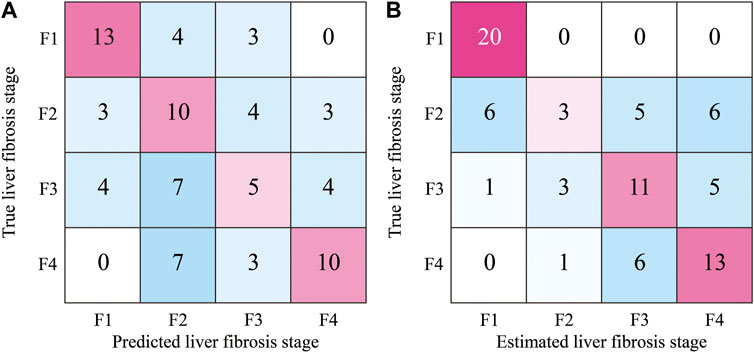
FIGURE 10. Confusion matrix of estimated stages of liver fibrosis of 80 ultrasound images by the hard voting of predicted ROIs; (A) original grayscale ROIs and (B) colorized ROIs.
The performance of the proposed method was compared to that of a previous method proposed by Huang et al. [21]. Both studies used raw echo data obtained from similar devices without log compression. The results, as the binary classification of stages of liver fibrosis, were calculated according to a previous study, as indicated in Table 4. The previous method, which uses radiofrequency signals, is superior to the proposed method, which uses a hard voting of ROIs. This was attributed to the larger dataset used in the previous method. However, the proposed method demonstrated superior specificity for ≥F2 and higher accuracy and sensitivity for ≥F3. This was attributed to the high accuracy of F1 in the proposed method and the low accuracy of F3 in the previous method.
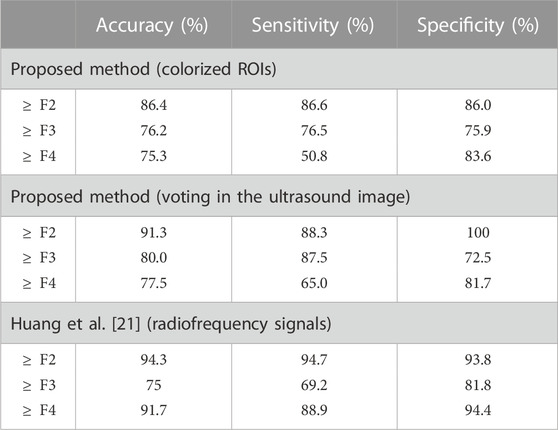
TABLE 4. Performance as the binary classification of ultrasound images by stages of liver fibrosis.
The only limitation to this study was that the amount of clinical data used was small. If the amount of data in each stage is different, a learning bias toward the large-data stage can occur. Therefore, the number of ultrasound images at each stage must be adjusted to match the stage with the fewest number of images. However, the contribution of this study was to investigate whether colorization using echo-envelope statistics improves the performance of CNN classification according to liver fibrosis stages. In this regard, it achieved its intended purpose.
The CNN classification of ultrasound images colorized by echo-envelope statistics has been proposed for the non-invasive and accurate quantitative diagnosis of liver fibrosis caused by diffuse liver disease. In this study, the ROIs extracted from the ultrasound images were modulated by the third- and fourth-order moments of the echo envelopes. Subsequently, the modulated and original ROIs were synthesized for the color image in the RGB representation. The colorized ROIs were classified by liver fibrosis stages from early fibrosis of F1 to cirrhosis of F4 via transfer learning using VGG-16. Finally, the stage of each ultrasound image was determined by hard voting, the predicted stages of all ROIs from the image. In the CNN classification of 80 ultrasound images, 20 ultrasound images at each stage, the accuracy could be improved from 47.5 % to 58.75% by the colorization of ROIs. Furthermore, as the binary classification of ≥F2,
The raw data supporting the conclusion of this article will be made available by the authors, without undue reservation.
The studies involving human participants were reviewed and approved by the Institutional Review Board of the Chang Gung Memorial Hospital, Taiwan. The patients/participants provided their written informed consent to participate in this study.
SH and AI performed the conceptual design of the study. Data curation was performed by D-IT and P-HT. Data were analyzed by AI and discussed by SH, AI, KY, and TY. The first draft of the manuscript was written by SH and revised by AI, KY, and TY. All authors contributed to the article and approved the submitted version.
This work was partly supported by the Takahashi Industrial and Economic Research Foundation and the Institute for Advanced Academic Research at Chiba University.
The authors declare that the research was conducted in the absence of any commercial or financial relationships that could be construed as a potential conflict of interest.
All claims expressed in this article are solely those of the authors and do not necessarily represent those of their affiliated organizations, or those of the publisher, the editors, and the reviewers. Any product that may be evaluated in this article, or claim that may be made by its manufacturer, is not guaranteed or endorsed by the publisher.
1. Tsukuma H, Hiyama T, Tanaka S, Nakao M, Yabuuchi T, Kitamura T, et al. Risk factors for hepatocellular carcinoma among patients with chronic liver disease. N Engl J Med (1993) 328:1797–801. doi:10.1056/NEJM199306243282501
2. Lok AS, Seeff LB, Morgan TR, di Bisceglie AM, Sterling RK, Curto TM, et al. Incidence of hepatocellular carcinoma and associated risk factors in hepatitis C-related advanced liver disease. Gastroenterology (2009) 136:138–48. doi:10.1053/j.gastro.2008.09.014
3. Khalifa A, Rockey DC. The utility of liver biopsy in 2020. Curr Opin Gastroenterol (2020) 36:184–91. doi:10.1097/MOG.0000000000000621
4. Seeff LB, Everson GT, Morgan TR, Curto TM, Lee WM, Ghany MG, et al. Complication rate of percutaneous liver biopsies among persons with advanced chronic liver disease in the HALT-C Trial. Clin Gastroenterol Hepatol (2010) 8:877–83. doi:10.1016/j.cgh.2010.03.025
5. Regev A, Berho M, Jeffers LJ, Milikowski C, Molina EG, Pyrsopoulos NT, et al. Sampling error and intraobserver variation in liver biopsy in patients with chronic HCV infection. Am J Gastroenterol (2002) 97:2614–8. doi:10.1111/j.1572-0241.2002.06038.x
6. Millonig G, Friedrich S, Adolf S, Fonouni H, Golriz M, Mehrabi A, et al. Liver stiffness is directly influenced by central venous pressure. J Hepatol (2010) 52:206–10. doi:10.1016/j.jhep.2009.11.018
7. Weng L, Reid JM, Shankar PM, Soetanto K. Ultrasound speckle analysis based on the K distribution. J Acoust Soc Am (1991) 89:2992–5. doi:10.1121/1.400818
8. Dutt V, Greenleaf JF. Ultrasound echo envelope analysis using a homodyned K distribution signal model. Ultrason Imaging (1994) 16:265–87. doi:10.1177/016173469401600404
9. Higuchi T, Hirata S, Yamaguchi T, Hachiya H. Quantitative evaluation of liver fibrosis using multi-Rayleigh model with hypoechoic component. Jpn J Appl Phys (2013) 52:07HF19. doi:10.7567/JJAP.52.07HF19
10. Mori S, Hirata S, Yamaguchi T, Hachiya H. Quantitative evaluation method for liver fibrosis based on multi-Rayleigh model with estimation of number of tissue components in ultrasound B-mode image. Jpn J Appl Phys (2018) 57:07LF17. doi:10.7567/JJAP.57.07LF17
11. Shankar PM. Ultrasonic tissue characterization using a generalized Nakagami model. IEEE Trans Ultrason Ferroelectr Freq Control (2001) 48:1716–20. doi:10.1109/58.971725
12. Fang F, Fang J, Li Q, Tai D-I, Wan YL, Tamura K, et al. Ultrasound assessment of hepatic steatosis by using the double nakagami distribution: A feasibility study. Diagnostics (2020) 10:557. doi:10.3390/diagnostics10080557
13. Isono H, Hirata S, Yamaguchi T, Hachiya H. Analysis of fluctuation for pixel-pair distance in co-occurrence matrix applied to ultrasonic images for diagnosis of liver fibrosis. J Med Ultrason (2017) 44:23–35. doi:10.1007/s10396-016-0741-x
14. Liu Z, Yang C, Huang J, Liu S, Zhuo Y, Lu X. Deep learning framework based on integration of S-Mask R-CNN and Inception-v3 for ultrasound image-aided diagnosis of prostate cancer. Future Gener Comput Syst (2021) 114:358–67. doi:10.1016/j.future.2020.08.015
15. Kassir HA, Zaharis ZD, Lazaridis PI, Kantartzis NV, Yioultsis TV, Xenos TD. A review of the state of the art and future challenges of deep learning-based beamforming. IEEE Access (2022) 10:80869–82. doi:10.1109/ACCESS.2022.3195299
16. Karaoglu O, Bilge SH, Uluer I. Removal of speckle noises from ultrasound images using five different deep learning networks. Eng Sci Technol Int J (2022) 29:101030. doi:10.1016/J.JESTCH.2021.06.010
17. Takagi R, Koseki Y. Noise reduction technique using deep learning for ultrasound imaging during high-intensity focused ultrasound treatment. Jpn J Appl Phys (2022) 61:SG1069. doi:10.35848/1347-4065/ac5292
18. Meng D, Zhang L, Cao G, Cao W, Hu B. Liver fibrosis classification based on transfer learning and FCNet for ultrasound images. IEEE Access (2017) 5:1–10. doi:10.1109/ACCESS.2017.2689058
19. Lee JH, Joo I, Kang TW, Paik YH, Sinn DH, Ha SY, et al. Deep learning with ultrasonography: Automated classification of liver fibrosis using a deep convolutional neural network. Eur Radiol (2020) 30:1264–73. doi:10.1007/s00330-019-06407-1
20. Saito R, Koizumi N, Nishiyama Y, Imaizumi T, Kusahara K, Yagasaki S, et al. Evaluation of ultrasonic fibrosis diagnostic system using convolutional network for ordinal regression. Int J Comput Assist Radiol Surg (2021) 16:1969–75. doi:10.1007/s11548-021-02491-1
21. Huang Y, Zeng Y, Bin G, Ding Q, Wu S, Tai DI, et al. Evaluation of hepatic fibrosis using ultrasound backscattered radiofrequency signals and one-dimensional convolutional neural networks. Diagnostics (2022) 12:2833. doi:10.3390/diagnostics12112833
22. Liu Z, Li W, Zhu Z, Wen H, Li M, Hou C, et al. A deep learning model with data integration of ultrasound contrast-enhanced micro-flow cines, B-mode images, and clinical parameters for diagnosing significant liver fibrosis in patients with chronic Hepatitis B. Eur Radiol (2023). doi:10.1007/s00330-023-09436-z
Keywords: diffuse liver disease, liver fibrosis, ultrasound image, texture analysis, echo-envelope statistics, convolutional neural network
Citation: Hirata S, Isshiki A, Tai D-I, Tsui P-H, Yoshida K and Yamaguchi T (2023) Convolutional neural network classification of ultrasound images by liver fibrosis stages based on echo-envelope statistics. Front. Phys. 11:1164622. doi: 10.3389/fphy.2023.1164622
Received: 13 February 2023; Accepted: 26 May 2023;
Published: 28 June 2023.
Edited by:
Maria Filomena Santarelli, National Research Council (CNR), ItalyReviewed by:
Vincenzo Positano, Gabriele Monasterio Tuscany Foundation (CNR), ItalyCopyright © 2023 Hirata, Isshiki, Tai, Tsui, Yoshida and Yamaguchi. This is an open-access article distributed under the terms of the Creative Commons Attribution License (CC BY). The use, distribution or reproduction in other forums is permitted, provided the original author(s) and the copyright owner(s) are credited and that the original publication in this journal is cited, in accordance with accepted academic practice. No use, distribution or reproduction is permitted which does not comply with these terms.
*Correspondence: Shinnosuke Hirata, c2hpbkBjaGliYS11Lmpw
Disclaimer: All claims expressed in this article are solely those of the authors and do not necessarily represent those of their affiliated organizations, or those of the publisher, the editors and the reviewers. Any product that may be evaluated in this article or claim that may be made by its manufacturer is not guaranteed or endorsed by the publisher.
Research integrity at Frontiers
Learn more about the work of our research integrity team to safeguard the quality of each article we publish.