 Sanchita Sarker
 Dhasarathan Vigneswaran
 Filip Studnička
- 1Department of Electronics and Telecommunication Engineering (ETE), Rajshahi University of Engineering and Technology (RUET), Rajshahi, Bangladesh
- 2Department of Physics, Faculty of Science, University of Hradec Králové, Hradec Králové, Czechia
- 3Department of Applied Cybernetics, Faculty of Science, University of Hradec Králové, Hradec Králové, Czechia
A simple two-layer refractive index sensor based on surface plasmon resonance has been proposed in this work, which evinces high sensitivity for detecting unknown analytes. This sensor design includes hexagonal- and octagonal-shaped air-hole rings, which have been introduced in the first and second layers, respectively. By performing this amalgamation of different types of air holes, this gold-coated plasmonic sensing scheme provides the broad sensing limit of the analyte, which is 1.32–1.40. The sensing performance has been examined by applying the finite element method, which is being used for modeling complex and irregular-shaped geometry. The wavelength interrogation method has demonstrated a maximal wavelength sensitivity of 9,000 nm/RIU (refractive index unit). The maximal amplitude sensitivity of 1902 RIU−1 has been exhibited in the y-polarized mode using the amplitude interrogation method. Moreover, the maximal sensor resolution of 1.11 × 10⁻⁵ RIU covers the entire sensing range. Furthermore, by adjusting the air-hole diameter, pitch, and depth of the gold layer coating, many more investigations have been demonstrated in this design. This highly sensitive sensor is very convincing to be used in many applications like chemical, biological, and also in physical sensing analyses.
Introduction
In the sensing technology, surface plasmon resonance (SPR) has been playing the leading role nowadays, especially for its label-free and real-time detection technique. In this SPR sensor, the phase-matching condition is a mandatory fact to ensure a relationship among the wavevectors of the interacting waves. In the course of the matching condition of frequency between light photons and surface electrons, SPR can be activated, causing the electrons to oscillate at a resonant frequency. This oscillation facilitates the resonance or phase-matching state, where a sharp loss peak forms, and the fluctuation of the loss peak is capable of detecting an unknown analyte [1–4]. They have been widely utilized in the detection of a wide range of physical, chemical, and biological components in areas such as food safety, medicine, biochemical analyte detection, and a variety of other day-to-day applications.
SPR technology, an effective sensing technology, has been developed from the very beginning of its creation; it is getting polished day by day. It was only theoretical in the 1950s and was not being commercially available until the 1990s. The prism coupling-based SPR sensor was first theoretically presented by Ritchies [5] in the 1950s using the Otto arrangement. Later, this has been improved by the Kretschmann setup [6] by reducing the gap between the metal layer and the prism, which was predominant in the previous Otto configuration. Later, experimental SPR was lodged by Liedberg [7] in 1983 for the gas and biosensing applications. However, this prism coupling-based SPR technique could not stand as a commercial candidate very long due to its massive size, which was caused by containing many mechanical and optical instruments. Moreover, these SPR sensors are not appropriate for remote sensing applications, and they are also not amenable to miniaturization or integration with other systems. To tackle these challenges, an SPR sensor containing photonic crystal fibers (PCFs) has been developed. PCFs are miniaturized, and it can be integrated easily. Moreover, the PCF sensor ensures a broad range of design flexibility, and the sensor’s sensitivity can be easily increased by altering the structural characteristics [8, 9]. Of the PCFs, R.C. Jorgenson proffered the first SPR sensor in 1993 [10], in which a part of the cladding made of fibers was removed and the fiber core was coated with a gold film to illustrate the plasmonic response. The PCF-based SPR sensor has gained much popularity in many applications such as the refractive index sensor, temperature sensor, gas sensor, and magnetic biosensor. For the miniscule variation in the RI of the analyte, it shows a huge shift in its wavelength, so the detection technique is very robust. The sensitivity also widely depends on the choice of plasmonic material. Commonly, gold (
Ying Lu et al. [11] proposed an SPR sensor with the graphene–Ag bimetallic layer coating to improve the signal-to-noise (SNR) ratio and to avoid adjacent interference. The maximum wavelength sensitivity had obtained a wavelength of up to 2,520 nm/RIU. Meanwhile, V. Kaur et al. [12] introduced a dual channel Au-coated PCF sensor that offers the utmost sensitivity of 3,750 nm/RIU. The sensor works inside wavelength spectra 1.30–1.40. However, the authors missed to investigate some crucial cholesterics such as amplitude sensitivity and sensor resolution. M. Erdmanis et al. [13] presented and numerically described a 5,000-nm/RIU H-shaped PCF-based SPR sensor. X. Yu et al. [14] presented an SPR-based selectively coated PCF, in which it can attain a high sensitivity of 5500 nm/RIU. Compared to wavelength sensitivity, amplitude sensitivity is easier and more cost effective. So it is advantageous to attain large values in terms of amplitude sensitivity. W. L. Ng et al. [15] presented a diamond ring fiber (DRF) sensor, where gold layers are being used. This DRF-based sensor has achieved the wavelength and amplitude sensitivity of 600 nm/RIU and 508,300 RIU−1. M.R Momota [16] presented a silver-coating SPR sensor, which attains a maximum wavelength and amplitude sensitivity of 4,200 nm/RIU and 300 RIU−1.
In this proposed work, a simple two-air hole-ring plasmonic sensor is being proposed, which shows great results in sensitivity within the RI sensing span from 1.32 to 1.40, which is tremendous, and any unknown analytes having these refractive indices can be determined easily. Plasmonic element gold is used in this sensor, which exhibits high sensitivity both in the wavelength and amplitude sensitivity of 9,000 nm/RIU and 1902 RIU−1. Plasmonic materials have been applied in the outer layer of the sensor; thus it reduces the fabrication complication. Moreover, different performance and structural parameters have been studied and investigated to optimize the fiber sensor. Thus, this straightforward and easily fabricable SPR sensor can be quite useful in biosensing applications.
Design theory of the proposed sensor
Figure 1A shows the cross-sectional 2D view of the proposed PCF sensor. This configuration comprises two air-hole rings, in which the primary layer is built in the shape of hexagon and the secondary layer is represented by the octagonal shape. In this multi-coating structure, two of the vertical air holes are omitted from the second ring of the sensor so that the light will strike the metal surface effortlessly and amasses the evanescent electromagnetic field at the direction of the missing air holes, which will amplify the sensitivity. The diameter of the first layer’s two air holes is kept larger to increase the imaginary field. In this design, we use a circular perfectly matched layer (PML), which is utilized to absorb the scattered light toward the surface and prevents reflection from the structure. As this boundary absorbs unwanted electromagnetic waves, it is also known as the absorption boundary condition (ABC). The thickness of this PML layer is 0.62 µm.
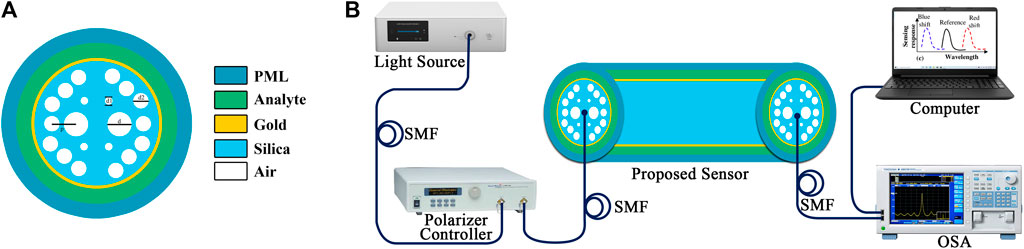
FIGURE 1. (A) Cross-sectional two-dimensional (2D) end face view of the computational model of the proposed biosensor in the x and y planes. Here, each and every region of the sensor is uniquely presented by distinct colors. Here, colors are taken here just for appearance. (B) The experimental setup for practical sensing with a typical SPR-sensing response curve is shown schematically.
For the practical application, the sensor needs to be fabricated. There are few very popular fiber techniques such as sol–gel, drilling, and die-cast. Using the sol–gel technique, the PCF can be easily fabricated because it offers low material loss during fiber fabrication. After the successful fabrication of the PCF, the plasmonic layer is then added. This can be added by using vapor deposition (CVD) methods. It is known that the pitch is the distance between the two air holes measured from center to center, which is 2 µm in this design and is indicated by p. The radius of the two large air holes in the first layer is chosen at 0.8 µm. The radius of the rest of the air holes in the first layer is chosen at 0.4 µm. The radius of each second-layer air hole is chosen as d2, which is 0.6 µm. Moreover, the depth of the gold layer is considered 30 nm. Outside of the gold layer, the analyte, which is familiar as a dielectric layer, is placed. The backdrop material of the proposed sensor is fused silica. By implementing the Sellmeier equation, the wavelength-dependent effective refractive index (neff) of fused silica can be obtained. The Sellmeier equation is denoted as
where λ is the wavelength, and depending on wavelength, n is the refractive index of fused silica. B1, B2, B3 and C1, C2, C3 are the Sellmeier constants. For fused silica, the empirical values of these constants are as B1 = 0.69616300, B2 = 0.407942600, B3 = 0.897479400, C1 = 0.00467914826 µm2, C2 = 0.0135120631 µm2, and C3 = 97.9340025 μm2 at temperature T = 25°C. A thin layer of gold (Au) on the nanometer scale has been inserted externally around the PCF structure. Surface plasmon resonance occurred with the presence of any plasmonic material. As a plasmonic material, gold has some extraordinary properties like resistance to corrosion, commercial availability, and lack of toxicity. Here, gold is selected. By using the Drude–Lorentz model [17], the dielectric constant of gold is taken here in Eq. 2).
where
Numerical analysis
Mesh analysis is another important part to evaluate sensor hysteresis. We have selected here finer mesh techniques, which divided the complex structure into a small triangular shape and gives more accurate results. The sensor model has 96 vertex elements, a total of 2,204 boundary elements, and 25,920 elements with a minimum quality of 0.5453. When wave guidance is not completely confined to the central core by the definite number of layers of holes in PCFs, leakage from the core to the outer matrix material occurs resulting in the loss of electromagnetic energy to the cladding. These losses are called confinement losses. The convergence error of 2.6578 × 10−08 is found in the model during the investigation time. Furthermore, the coupled-mode theory is the underlying principle employed for sensing. When the propagation constants of the core-guided mode and surface plasmon waves match at the resonant point, a loss of energy occurs. The quantifiable tool is a change in either the resonant wavelength or the intensity of two modes. The imaginary part of the complex refractive index (
where
To ensure effective sensor performance, sensitivity of any sensor must be evaluated. The resonance shift
Here,
Investigating amplitude sensitivity is an essential feature of this sensor. Since this offers sensor performance at a lower cost and without considering spectral changes, it will ensure the performance in an effective manner. Hence, the amplitude sensitivity is calculated through the following mathematical expression in [14].
where the entire propagation loss along the wavelength for a certain analyte refractive index is
Sensor resolution is another considerable parameter, which is computed through the following expression in [14].
Now, the results and discussion section is presented stepwise.
Results and discussion
As the y-polarization core-guided mode shows better performance than the x-polarization mode, in this work, y-polarization fundamental modes are analyzed. The dispersion relation and mode field distribution of the proposed sensor are presented in Figures 2A, B for na = 1.34. The real part of the SPP mode will alter due to a slight difference in analyte RI, which has an impact on the phase matching condition. Figure 2A also show that the effective refractive index of the y-polarized core-guided mode (at na = 1.34) intersects the neff of the SPP mode. This is called the phase-matching condition, and a sharp peak is observed at the resonance wavelength.
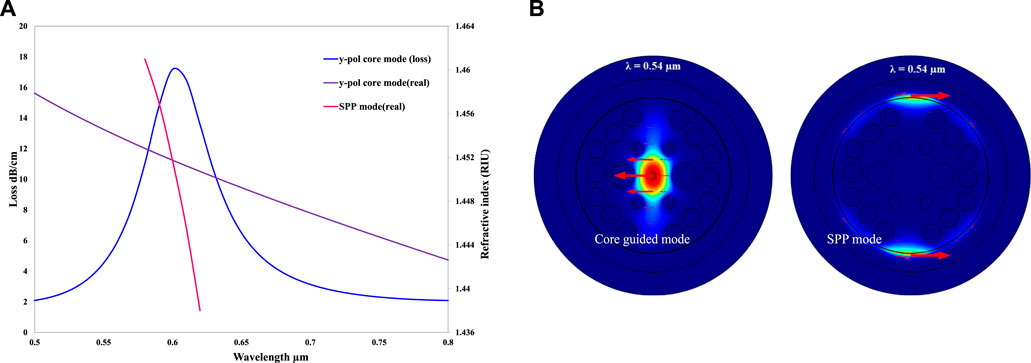
FIGURE 2. (A) Dispersion relation of the core and SPP modes of the introduced sensor when the RI of the analyte is set to na = 1.34. (B) Mode field distributions of the core and SPP modes at the operating wavelength λ = 0.54 μm when the RI of the analyte is set to na = 1.34.
By changing the analyte refractive index from 1.32 to 1.40, phase-matching changes are shown in Figure 3A. For changing the analyte refractive index, resonance wavelength shifting also occurs. In this study, for changing RI from 1.35 to 1.36, 1.36 to 1.37, 1.37 to 1.38, 1.38 to 1.39, and 1.39 to 1.40, the resonance wavelength shifting values are, respectively, 0.62 to 0.65, 0.65 to 0.68, 0.68 to 0.72, 0.72 to 0.77, and 0.77 to 0.86. Here, the pitch is selected at 2 µm, and the gold thickness is 30 nm. Since the confinement loss is a critical factor in determining sensor performance, it is noticeable from Figure 3A that the confinement loss is being augmented with the increase of the analyte refractive index along with wavelength shifting. The highest confinement loss is found at wavelength 0.86 with peak 303.4044 for the analyte refractive index 1.40.
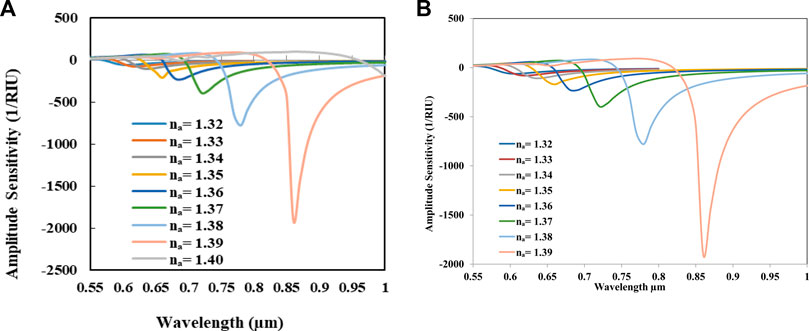
FIGURE 3. (A) For the increasing analyte refractive index from 1.32 to 1.40, fundamental loss changes. (B) Amplitude sensitivity as a function of operating wavelength for different analytes for RI 1.32 to 1.39.
As wavelength interpolation is not required in this procedure, amplitude sensitivity plays a crucial role in measuring sensitivity since it is straightforward and affordable. Here, the amplitude sensitivity for changing the analyte refractive index is shown in Figure 3B. For the presented sensor, the maximal amplitude sensitivity recorded is 1902 RIU−1 at the wavelength 0.86 for the analyte refractive index 1.39.
In this proposed sensor, the effect of changing the diameter of the two large air holes in the first layer is shown in Figure 4A. In this figure, the diameter values are varied as 1.5, 1.6, and 1.7 µm, respectively, for the analyte refractive index of 1.38 and 1.39. By observing the plot, it is seen that the loss depth has given better results for the analyte refractive index 1.39 than 1.38. Moreover, by scaling up the diameter of the two large air holes, loss depth also increases. This is because the variation between the core and cladding is decreased.
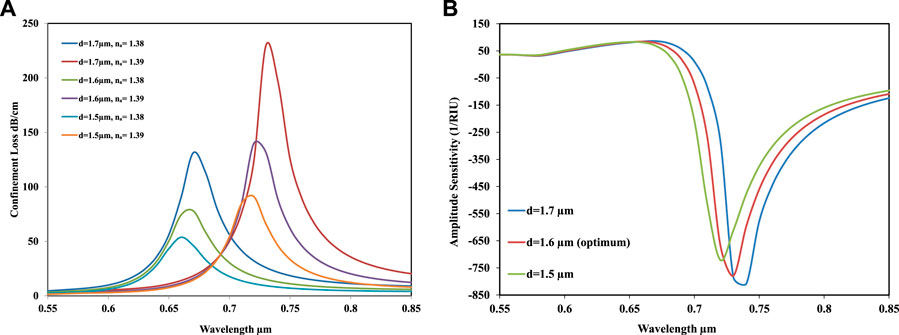
FIGURE 4. (A) Confinement loss versus the operating wavelength for the variation of d = 1.5 µm, d = 1.6 µm, and d = 1.7 µm for the targeted analyte na = 1.38 and na = 1.39. (B) Amplitude sensitivity for varying diameters of two large air holes in the first layer of the designed sensor.
Moreover, by observing the amplitude sensitivity for varying the air-hole diameter, as shown in Figure 4B, the obtained values of the amplitude sensitivity were 720.9414, 779.2115, and 808.7024
After getting the optimum value of the diameter of the two large air holes in the first layer, which is d = 1.6
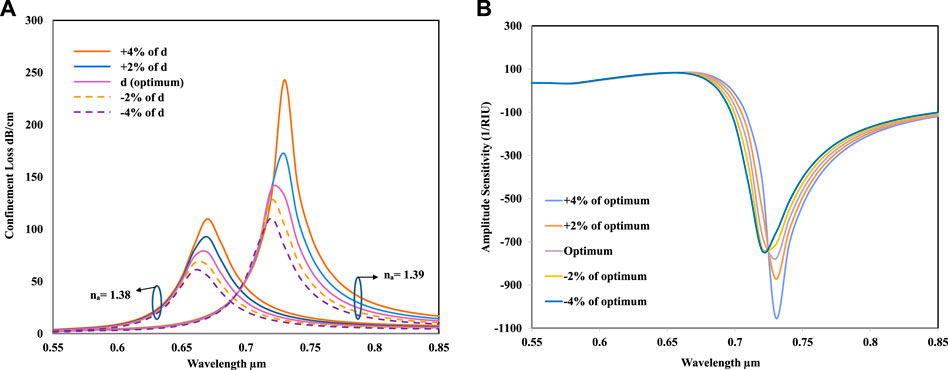
FIGURE 5. (A) Confinement loss versus operating wavelength for RI 1.38 and 1.39 during the variation (± 2% and ± 4%) of the air-hole diameter d. (B) Amplitude sensitivity for the varying air-hole diameter d of ±2% and ± 4% in the first layer.
Figure 5B shows that for +4% and 2% change in the diameter, the amplitude sensitivity is increased, and for −2% and −4% change in the diameter, amplitude sensitivity is decreased. In this figure, it has been observed that the maximum amplitude sensitivity is recorded for the + 4% change in the diameter, which is 1,050
After the two large air-hole investigation in the first layer, rest of the air hole analysis has also been conducted by varying their diameters and investigated through the loss depth and amplitude sensitivity. Figure 6A shows that by changing the diameter of the rest of the air holes in the first air-hole ring, the loss depth varies from the result of the optimum value. For the 2% and 4% of the optimum value, the loss depth is increased and vice versa. The highest loss depth is recorded for + 4% change in the diameter, which is 245 dB/cm. Figure 6B shows the amplitude sensitivity investigation for the changing value of the diameter by + 2%, +4%, −2%, and −4%. Amplitude sensitivity has been higher for the increase of the diameter than the optimum value and lower for the decreased value of the diameter than the optimum value. The highest value has been achieved for the + 4% increase, which is 1,070
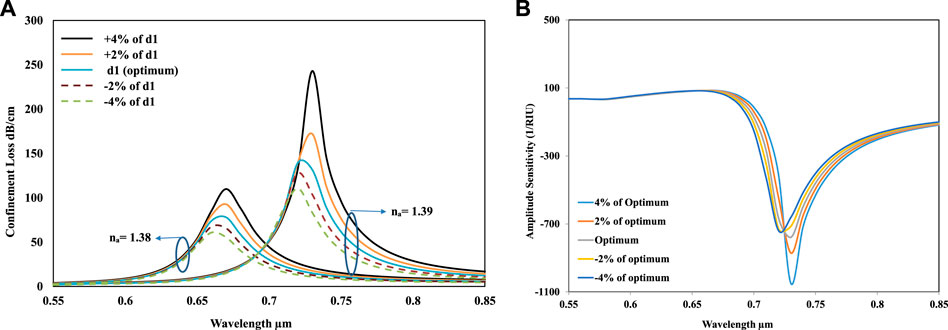
FIGURE 6. (A) Confinement loss versus the wavelength for changing the diameter of the air hole d1 when the RI of na = 1.38 and na = 1.39. (B) Amplitude sensitivity versus the applied wavelength for varying diameter of air hole d1.
In Figures 7A, B, for the change in the second-layer air-hole diameter, the loss depth and amplitude sensitivity are shown respectively. Figure 7A shows that for −4% change in the second-ring air-hole diameter, the loss depth has shown the highest value as 260 dB/cm. It has been shown that the low and high losses are found in +4% and −4% change in the proposed sensor parameters. From Figure 7B, the highest amplitude sensitivity is obtained for −4% change in the diameter, which is 1,100
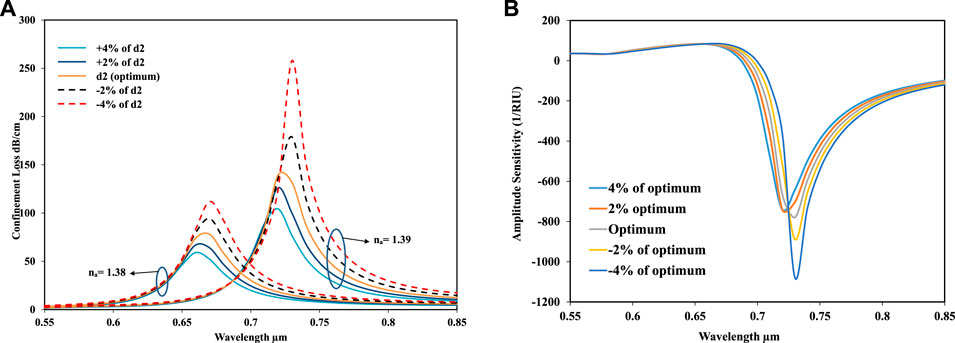
FIGURE 7. (A) Confinement loss versus the wavelength for changing the diameter of the air hole d2 when the RI of na = 1.38 and na = 1.39. (B) Amplitude sensitivity for the varying second-ring air-hole diameter of d2; the variation has been carried out at ± 4% and ± 2% over the proposed design.
In this work, the effect of modifying the gold layer thickness of the fiber was also studied. The gold layer thickness is varied for the analyte refractive index values of 1.38 and 1.39. By observing the wavelength sensitivity in Figure 8A, it is seen that the peak of the loss heads to the longer wavelength by increasing the analyte refractive index. Moreover, the change in the loss spectrum for the variation of the gold layer thicknesses of 25 nm, 30 nm and, 35 nm, respectively, has also been observed in Figure 8A.
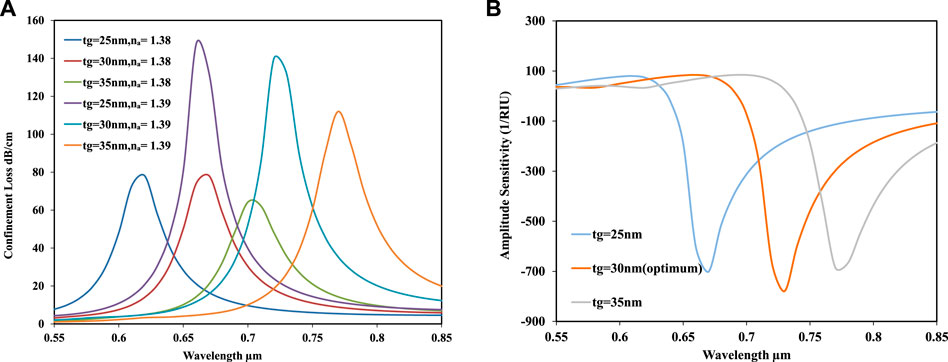
FIGURE 8. (A) Loss spectra versus the wavelength for RI 1.38 and 1.39 for the varying thickness of the gold layer. (B) Amplitude sensitivity versus the wavelength for varying gold layer thicknesses.
For any SPR-based sensor, there is a clear connection between the plasmonic material and the amplitude sensitivity. Figure 8B illustrates how to achieve amplitude sensitivity by adjusting the thickness of the gold layer that serves as the plasmonic material in this work. Herein, the gold layer thickness (tg) has been tuned in a brute force manner. By observing this figure, the amplitude sensitivity values of 701.4208, 779.2115, and 648.8763 RIU−1 have been achieved for the corresponding gold layer thicknesses of 25 nm, 30 nm, and 35 nm. Moreover, the sensor obtained the maximum amplitude sensitivity response of 780
Furthermore, after selecting the optimum value for the gold layer thickness (tg), it is further investigated by increasing and decreasing the optimum value by 2% and 4%, respectively. Figures 9A, B depict the effect on the loss spectrum and amplitude sensitivity, respectively. In Figure 9A, for analytes 1.38 and 1.39, the effect of the change in the gold thickness is given. From Figure 9A, it is analyzed that by increasing the gold layer thickness, the loss spectrum will decrease, and by decreasing the gold layer thickness, the loss depth will increase. The maximum loss depth is obtained as 164 dB/cm for −4% change in the optimum gold layer thickness. In Figure 9B, for changing the optimum value of the gold layer thickness (tg) value, the maximum amplitude sensitivity is recorded as 850
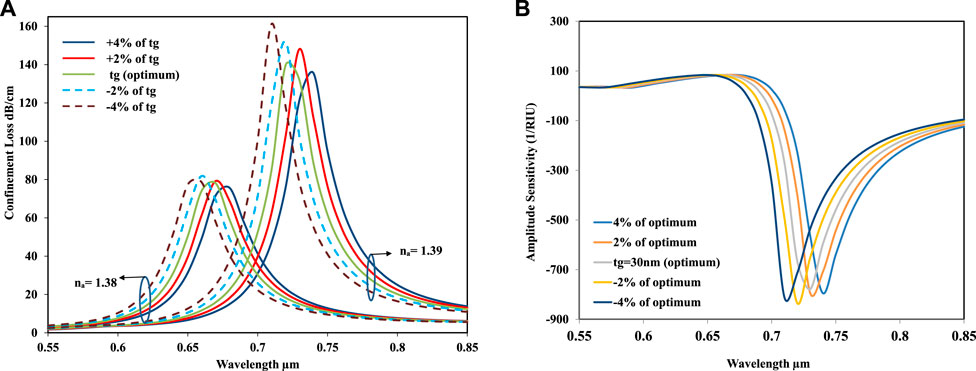
FIGURE 9. (A): Loss spectrum versus the controlling wavelength for na = 1.38 and na = 1.39 for varying gold layer thicknesses. (B) Amplitude sensitivity spectrum versus the controlling wavelength for varying gold layer thicknesses.
Figure 10A shows the effect of changing the pitch value. The sensor properties have been analyzed for pitch values of 1.9, 2, and 2.1
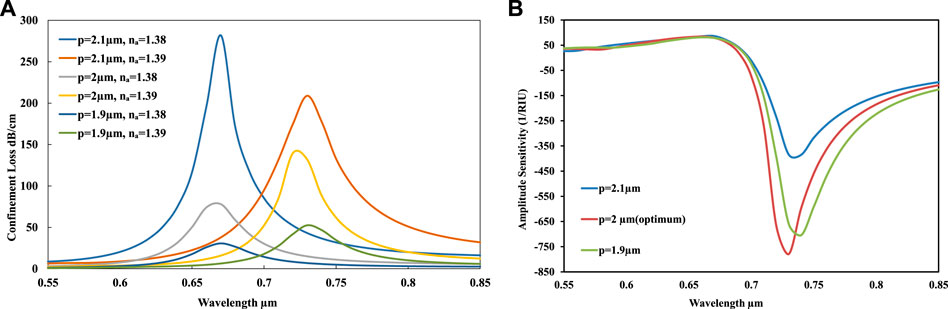
FIGURE 10. (A) Loss spectrum versus the wavelength for na = 1.38 and na = 1.39 for p = 1.9, p = 2.0, and p = 2.1, respectively, when other geometric parameters are kept constant. (B) Amplitude sensitivity versus the wavelength for p = 1.9, p = 2.0, and p = 2.1 when other geometric parameters are kept constant.
At this stage of the investigation, the optimum pitch value (p = 2.00 μm) has further been altered by +2%, +4%, −2%, and −4%, which is shown in Figure 11A. It can be discerned that the pitch value is being increased for the positive change from the optimum value and being decreased for the negative change. Thus, the lowest and highest loss depths are measured for the −4% and +4% change of the optimum pitch value. The highest loss depth is depicted as 237 db/cm. Apart from the loss of depth, the amplitude sensitivity is also being varied through the pitch value by a similar measurement, which is observed in Figure 11B. Here, a satisfying fact is observed that the varied pitch values are very close to the optimum value of the pitch, which will lead to the robustness of the sensor.
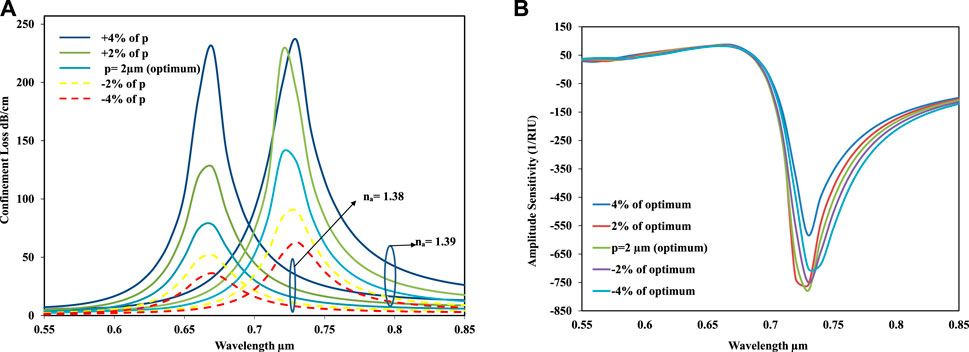
FIGURE 11. (A) Loss spectrum versus the wavelength for the varying (± 2% and ± 4%) pitch value when the other geometric parameters are kept constant. (B) Amplitude sensitivity spectrum versus the wavelength for the varying (± 2% and ± 4%) pitch value when the other geometric parameters are kept constant.
Finally, the regression line of the resonance wavelength has been inquired for the proposed design. A linear fitting curve plays a significant role as it ensures the optimization of the sensor for a certain range of wavelengths. The linear features between the analyte RI and the resonance wavelength have guaranteed the sensor’s accuracy for high RI analytes. The successful calibration rate of a sensor is increased by augmenting the linear fitting characteristics. This is due to the fact that improving the linear fitting features will also improve the model’s average sensitivity and resolution, which will enhance the sensor’s overall performance. Thus, it is expected for any sensor to ensure the most linear characteristics and avoid non-linearity because this will set up a huge distinction between the sensor resolution and the average sensitivity. From Figure 12, it is observed that the linear fitting coefficient is R2 = 0.9911 for y-polarization; this result is very satisfying for a model to be successfully fabricated, and it also has great prospects in the sensing area.
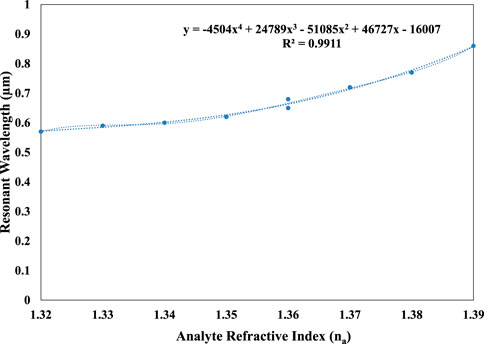
FIGURE 12. Resonance wavelength’s regression line as a function of analyte RI.
Several sensor designs having the amplitude and wavelength sensitivity along with the sensor resolution are presented in Table 1. In this comparison table, it is noticeable that this proposed sensor has exhibited better performance in terms of both sensitivities. The sensor resolution of the proposed sensor is also satisfactory. Moreover, this sensor also ensures better linear characteristics among the sensors that have recently been published.
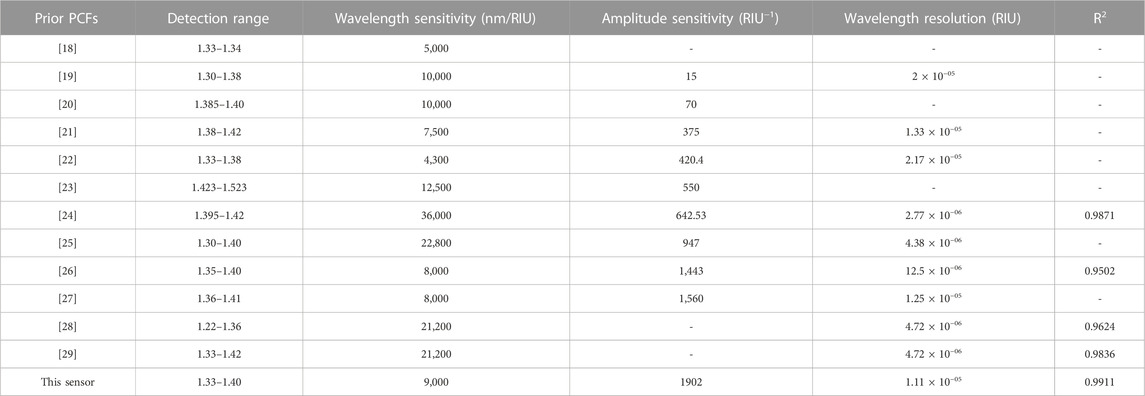
TABLE 1. Comparative performance analysis of this plasmonic sensor with existing works.
Scope of the proposed sensor
This novel SPR sensor has huge utilitarian applications in fields such as genomics, medical diagnostics, environmental monitoring, food analysis, and security. Moreover, it has great expectancy for detecting preservatives in many commercial low-fat milks, which are available in different countries. Preservatives are widely used in liquid milk to prevent the spoilage conducted by various microorganisms. However, some dealers are not aware of the harmful effects of adding preservatives, so they use various chemicals such as formaldehyde, hydrogen peroxide, and sodium carbonate without proper permission from the government. For this reason, quality control and level detection of these harmful preservatives are a must. This can be easily performed using SPR technology, which is a level-free technology. This SPR has additional advantages such as robustness, compactness, and low cost. Concentration of preservatives added in milk can vary from 0% to 14.3%. For this minimum (0%) and maximum (14.3%) concentration of the preservatives, the refractive index differences are obtained between 1.34550 and 1.35093. This sensor’s refractive index range for unknown analytes is 1.33–1.40, and sensor resolution of this model is 1.11 × 10⁻⁵ or 0.00005. This means that the sensor can have the ability to detect the analyte for refractive index changes of 0.00005. To conclude, it will detect various detrimental preservatives added to commercially available milk in an implicit manner. Nevertheless, it will also be applicable for detecting preservatives in soft drinks and many more real-life applications.
Conclusion
Practically, the implantable simple SPR-based refractive index sensor is proposed to ensure a high level of sensitivity and low-loss characteristics. The finite element approach is used to investigate the performance parameters numerically. In the wider refractive index (RI) sensing range of 1.32–1.40, numerical research is carried out in the y-polarized mode. Gold, as the plasmonic material, is applied on the outermost layer of the structure, which declines the fabrication obstacles. The influence of the air-hole sizes of the PCF and the thickness of the gold layer on the performance of the designed sensor using wavelength and amplitude interrogation were analyzed. After adjusting all structural and functional parameters, sensitivity was assessed and found to be higher than that of the prevalent bimetallic structure. With a sensor resolution of 1.11 × 10⁻⁵ and a maximum amplitude sensitivity of 1902 RIU−1, the designed sensor had a wavelength sensitivity of 9,000 nm/RIU. The flexible design and distinctive structure of this sensor allow it to be beneficial in the era of biosensing applications.
Data availability statement
The raw data supporting the conclusion of this article will be made available by the authors, without undue reservation.
Author contributions
Conceptualization: SS; methodology: SS and DV; software: SS; validation: SS and DV; formal analysis: SS; investigation: SS; resources: DV; data curation: SS and DV; writing—original draft preparation: SS; writing—review and editing: DV; visualization: SS and DV; supervision: DV; funding acquisition: DV. Validation of results and organizing the manuscript: FS. All authors contributed to the article and approved the submitted version.
Acknowledgments
The authors deliver their great acknowledgement who were directly or indirectly involved in contributing to this research work. They are highly grateful to Ministry of ICT, Dhaka, Bangladesh, for their research support.
Conflict of interest
The authors declare that the research was conducted in the absence of any commercial or financial relationships that could be construed as a potential conflict of interest.
Publisher’s note
All claims expressed in this article are solely those of the authors and do not necessarily represent those of their affiliated organizations, or those of the publisher, the editors, and the reviewers. Any product that may be evaluated in this article, or claim that may be made by its manufacturer, is not guaranteed or endorsed by the publisher.
References
1. Homola J, Yee SS, Gauglitz G Surface plasmon resonance sensors: Review. Sensors actuators B: Chem (1999) 54(1-2):3–15. doi:10.1016/s0925-4005(98)00321-9
2. Gupta BD, Verma RK, 2009. Surface plasmon resonance-based fiber optic sensors: Principle, probe designs, and some applications. J sensors, 2009, 1, 12. doi:10.1155/2009/979761
3. Wang W, Mai Z, Chen Y, Wang J, Li L, Su Q, et al. A label-free fiber optic SPR biosensor for specific detection of C-reactive protein. Scientific Rep (2017) 7(1):16904. doi:10.1038/s41598-017-17276-3
4. Šípová H, Zhang S, Dudley AM, Galas D, Wang K, Homola J Surface plasmon resonance biosensor for rapid label-free detection of microribonucleic acid at subfemtomole level. Anal Chem (2010) 82(24):10110–5. doi:10.1021/ac102131s
5. Ritchie RH Plasma losses by fast electrons in thin films. Phys Rev (1957) 106(5):874–81. doi:10.1103/physrev.106.874
6. Kretschmann E, Raether H Notizen: Radiative decay of non radiative surface plasmons excited by light. Z für Naturforschung A (1968) 23(12):2135–6. doi:10.1515/zna-1968-1247
7. Liedberg B, Nylander C, Lunström I Surface plasmon resonance for gas detection and biosensing. Sensors and actuators (1983) 4:299–304. doi:10.1016/0250-6874(83)85036-7
8. Ahmmed R, Ahmed R, Razzak SA Design of large negative dispersion and modal analysis for hexagonal, square, FCC and BCC photonic crystal fibers. In: 2013 international conference on informatics, Electronics and vision (ICIEV). IEEE (2013). p. 1–6.
9. Aoni RA, Ahmed R, Razzak SA, Tu2 . Design and simulation of duel-concentric-core photonic crystal fiber for dispersion compensation. In: CIOMP-OSA summer session on optical engineering, Design and manufacturing. Optical Society of America (2013).
10. Jorgenson RC, Yee SS A fiber-optic chemical sensor based on surface plasmon resonance. Sensors Actuators B: Chem (1993) 12(3):213–20. doi:10.1016/0925-4005(93)80021-3
11. Yang X, Lu Y, Liu B, Yao J Analysis of graphene-based photonic crystal fiber sensor using birefringence and surface plasmon resonance. Plasmonics (2017) 12(2):489–96. doi:10.1007/s11468-016-0289-z
12. Kaur V, Singh S A dual-channel surface plasmon resonance biosensor based on a photonic crystal fiber for multianalyte sensing. J Comput Electron (2019) 18:319–28. doi:10.1007/s10825-019-01305-7
13. Erdmanis M, Viegas D, Hautakorpi M, Novotny S, Santos JL, Ludvigsen H Comprehensive numerical analysis of a surface-plasmon-resonance sensor based on an H-shaped optical fiber. Opt express (2011) 19(15):13980–8. doi:10.1364/oe.19.013980
14. Yu X, Zhang Y, Pan S, Shum P, Yan M, Leviatan Y, et al. A selectively coated photonic crystal fiber based surface plasmon resonance sensor. J Opt (2009) 12(1):015005. doi:10.1088/2040-8978/12/1/015005
15. Ng WL, Rifat AA, Wong WR, Mahdiraji GA, Mahamd Adikan FR A novel diamond ring fiber-based surface plasmon resonance sensor. Plasmonics (2018) 13(4):1165–70. doi:10.1007/s11468-017-0617-y
16. Momota MR, Hasan MR Hollow-core silver coated photonic crystal fiber plasmonic sensor. Opt Mater (2018) 76:287–94. doi:10.1016/j.optmat.2017.12.049
17. Kheirandish A, Sepehri Javan N, Mohammadzadeh H Modified Drude model for small gold nanoparticles surface plasmon resonance based on the role of classical confinement. Scientific Rep (2020) 10(1):6517–0. doi:10.1038/s41598-020-63066-9
18. Kaur V, Singh S Performance analysis of multichannel surface plasmon resonance sensor with dual coating of conducting metal oxide. J Nanophotonics (2018) 12(1):1–016012. doi:10.1117/1.jnp.12.016012
19. Kaur V, Singh S Design of D-Shaped PCF-SPR sensor with dual coating of ITO and ZnO conducting metal oxide. Optik (2020) 220:165135. doi:10.1016/j.ijleo.2020.165135
20. Kaur V, Singh S Design of titanium nitride coated PCF-SPR sensor for liquid sensing applications. Opt Fiber Technol (2019) 48:159–64. doi:10.1016/j.yofte.2018.12.015
21. Liu C, Yang L, Su W, Wang F, Sun T, Liu Q, et al. Numerical analysis of a photonic crystal fiber based on a surface plasmon resonance sensor with an annular analyte channel. Opt Commun (2017) 382:162–6. doi:10.1016/j.optcom.2016.07.031
22. Hasan MR, Akter S, Rifat AA, Rana S, Ahmed K, Ahmed R, et al. Spiral photonic crystal fiber-based dual-polarized surface plasmon resonance biosensor. IEEE Sensors J (2017) 18(1):133–40. doi:10.1109/jsen.2017.2769720
23. Liao J, Ding Z, Xie Y, Wang X, Zeng Z, Huang T Ultra-broadband and highly sensitive surface plasmon resonance sensor based on four-core photonic crystal fibers. Opt Fiber Technol (2020) 60:102316. doi:10.1016/j.yofte.2020.102316
24. Rahman KM, Alam MS, Islam MA Highly sensitive gold-coated surface plasmon resonance photonic crystal fiber sensor in near-infrared region. Results Opt (2022) 7:100223. doi:10.1016/j.rio.2022.100223
25. Ramani U, Kumar H, Singh BK, Pandey PC Design of surface plasmon resonance based both side polished photonic crystal fiber for highly efficient refractive index sensor. Optik (2021) 248:168062. doi:10.1016/j.ijleo.2021.168062
26. Zuhayer A, Shafkat A Design and analysis of a gold-coated dual-core photonic crystal fiber bio-sensor using surface plasmon resonance. Sensing Bio-Sensing Res (2021) 33:100432. doi:10.1016/j.sbsr.2021.100432
27. Hasan MR, Akter S, Ahmed K, Abbott D Plasmonic refractive index sensor employing niobium nanofilm on photonic crystal fiber. IEEE Photon Technol Lett (2017) 30(4):315–8. doi:10.1109/lpt.2017.2786475
28. Fu Y, Liu M, Shum P, Chu L An ultrahighly sensitive photonic crystal fiber-based surface plasmon resonance sensor. Optik (2020) 212:164649. doi:10.1016/j.ijleo.2020.164649
Keywords: surface plasmon resonance, photonic crystal fiber, sensitivity, photonic biosensor, amplitude sensitivity, sensor resolution
Citation: Sarker S, Vigneswaran D and Studnička F (2023) Design of a nanoscale gold-coated photonic crystal fiber biosensor. Front. Phys. 11:1164255. doi: 10.3389/fphy.2023.1164255
Received: 12 February 2023; Accepted: 14 April 2023;
Published: 26 June 2023.
Edited by:
Sofyan Taya, Islamic University of Gaza, PalestineReviewed by:
Fnu Shariful, University of North Florida, United StatesVeerpal Kaur, University of Victoria, Canada
Copyright © 2023 Sarker, Vigneswaran and Studnička. This is an open-access article distributed under the terms of the Creative Commons Attribution License (CC BY). The use, distribution or reproduction in other forums is permitted, provided the original author(s) and the copyright owner(s) are credited and that the original publication in this journal is cited, in accordance with accepted academic practice. No use, distribution or reproduction is permitted which does not comply with these terms.
*Correspondence: Dhasarathan Vigneswaran, ZGhhc2F2aTFAdWhrLmN6