
94% of researchers rate our articles as excellent or good
Learn more about the work of our research integrity team to safeguard the quality of each article we publish.
Find out more
ORIGINAL RESEARCH article
Front. Phys., 19 April 2023
Sec. Optics and Photonics
Volume 11 - 2023 | https://doi.org/10.3389/fphy.2023.1159504
This article is part of the Research TopicAdvances in BiophotonicsView all 5 articles
Introduction: Escaping whole blood exhibits biochemical and physical coupled mechanisms such as coagulation and drying. However, there is no method for simultaneously monitoring the coagulation and drying procedure.
Methods: In this study, a new method based on optical coherence tomography (OCT) combined with speckle variance and thickness is presented for simultaneously capturing spatially high-resolved characteristics of coagulation and drying of whole blood during the procedure. Deep learning based on a convolutional neural network (CNN) is employed for collecting OCT images with a resolution of micron order and quantitatively obtaining pixel-wise information of whole blood.
Results and discussion: Then, the pixel-wise thickness map provides high-resolved temporal–spatial dynamics of whole blood during the drying procedure, and the corresponding speckle variance can uncover information of whole blood coagulation. The results demonstrate that coagulation and drying of whole blood have spatially inhomogeneous features. This method could provide the potential for revealing the coupling mechanism between coagulation and drying.
Blood is a complex system which displays certain chemical and physical phenomena when it is removed from the body, such as blood coagulation [1, 2] and evaporation [3, 4]. Blood coagulation is a defense mechanism for blocking blood vessels by a series of reactions that involve the intrinsic and extrinsic pathways [2, 5]. Blood coagulation monitoring has become crucial to diagnosing causes of hemorrhages, developing anticoagulant drugs, and assessing bleeding risk in extensive surgical procedures.
The most commonly used routine laboratory-based coagulation tests based on the intrinsic and extrinsic pathways include prothrombin time/international normalized ratio (PT), activated partial thromboplastin time (aPTT) [6, 7], and platelet testing [8]. However, these clinical tests require much time to separate plasma and platelets. Thus, these traditional tests do not reflect the whole dynamic process of blood coagulation and are not efficient enough to obtain the coagulation results.
In order to overcome the aforementioned drawbacks, a number of methods have been presented for coagulation assessment in whole blood, including thromboelastometry (TEG) [9, 10], laser speckle rheology (LSR) [11–14], brightfield microscopy combined with image processing techniques [15], electrical impedance measurement based on a microfluidic chip [16], OCT-based measurement including penetration depth [17, 18], magnetomotive optical coherence tomography [19], optical coherence elastography [20], and autocorrelation analysis [21]. However, these techniques cannot provide the spatial heterogeneity of whole blood during the coagulation procedure since blood coagulation is a spatially non-uniform and non-random process [22]. Furthermore, the physical process of whole blood such as drying was not considered in these techniques.
The evaporation of blood also induces the spatial heterogeneity of dried patterns from blood droplets [4, 23] and has recently gained immense attention because of its potential application in diagnostic medicine [24, 25] and forensic science [23, 26]. Mass, volume, and size are quantified for blood during the drying procedure [3], and the feature of the image of a blood droplet is employed for characterizing whole blood [26, 27]. However, these parameters cannot provide spatial distribution in blood.
In this work, a novel method based on OCT is presented for high-resolved imaging spatial heterogeneity of whole blood during natural evaporation and coagulation. The tests were conducted using whole blood from a healthy rat obtained by finger pricking without added reagents. In this method, the pixel-wise thickness and speckle variance of whole blood is used to characterize the whole blood based on OCT combined with a convolutional neural network (CNN) for revealing biochemical and physical coupled mechanisms.
Fresh blood is obtained from healthy male Sprague–Dawley rats (National Rodent Laboratory Animal Resources, Shanghai Branch). The area is cleaned with alcohol, and a sterilized lancet is used to puncture the vein in the leg. The first drop of blood is wiped with a sterilized cotton ball, and the second drop of blood is placed on the glass slide. Figure 1D shows the whole blood drop, and the thickness of the blood drop is thinner at the right than at the left. The OCT scanning area is along the line on the whole blood, as shown in Figure 1D. The first OCT images for whole blood are collected within 30 s. Experiments are conducted at an ambient room temperature of 15.5°C and relative humidity (RH) of 72%. The cross-sectional OCT images are collected every 3 min during natural evaporation and coagulation processes. Furthermore, the animal use protocol has been reviewed and approved by the Animal Ethical and Welfare Committee (AEWC) of Affiliated Hospital of Putian University.
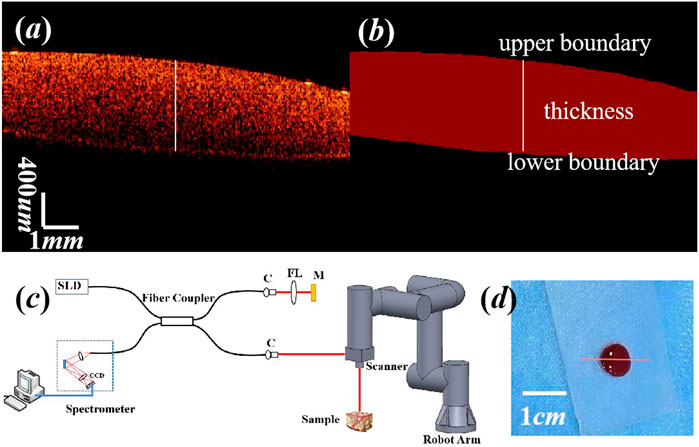
FIGURE 1. (A) Cross-sectional OCT image of whole blood and (B) manual label of the whole blood area. Image area was 3 mm (z) × 10 mm(x). White line shows the thickness of whole blood at the local position. (C) Schematic of the experimental setup. SLD, superluminescent diode; C, collimator; M, mirror; FL, focusing lens. (D) Scanning area along the line on whole blood. The thickness of the blood drop is thinner at the right than at the left.
The schematic of the OCT system (OPINTECH Co., Ltd.) based on a fiber-optic Michelson interferometer is shown in Figure 1C. The system consists of a polarized broadband superluminescent light-emitting diode (SLD) with a central wavelength of 1304.7 nm, a full width at half maxima (FWHM) of 96.3 nm, and a power of 9.4 mW. The light from the SLD is split into the sample arm and the reference arm with a power of 75% and 25%, respectively. The axial and lateral resolutions are 7.8 um and 18.2 um in theory, respectively. The acquisition rate of a cross-sectional OCT image is 20 fps (0.05 s per frame). The sample arm is placed on the robotic arm to flexibly measure the medium. The successive 400 cross-sectional OCT images are sampled at the 3-min interval until the whole blood is completely coagulated. Figure 1A shows the cross-sectional OCT image of the whole blood, and it demonstrates that the OCT image could completely detect the depth-resolved blood region.
In order to quantify the whole blood features during the coagulation and drying processes, the areas of the whole blood are segmented from cross-sectional OCT images based on CNN which uses the U-net network [28] as the backbone network. During this procedure, 7,200 cross-sectional OCT images are obtained with a total of 18 sets of valid data. Among them, 180 cross-sectional OCT images are selected for the manual label, as shown in Figure 1B, and they were randomly divided into training datasets (90%) and validation sets (10%) to improve the robustness of the model. Then, the remaining images are selected as the test set. In addition, the Adam optimizer is employed [29] to optimize the model. The learning rate is initially set to 0.0001, and the decay rate is set to 0.995. Figure 2 demonstrates that the coincidence degree of the target box and prediction box is high due to the mean intersection over union (MIoU) score of 98.17. Then, the trained model is applied to segment whole blood regions during blood coagulation and drying processes, and the boundaries of whole blood regions are recorded to further quantitatively analyze the dynamics of whole blood.
The thickness of whole blood is employed to quantify the morphological feature. The thickness is determined by the pixel difference between the upper and lower boundaries of whole blood in OCT images in the same column, as shown in Figure 1B. Thus, the lateral pixel-resolved thickness can be determined using the following formula:
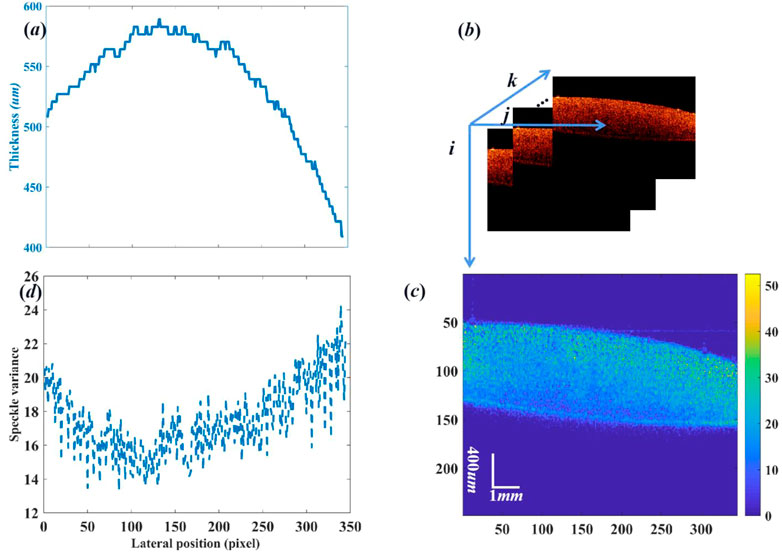
FIGURE 3. (A) Lateral distribution of the pixel-wise thickness, (B) successive cross-sectional OCT images, (C) speckle variance image, and (D) lateral distribution of the pixel-wise median of speckle variance of the whole blood.
Furthermore, speckle variance is obtained by calculating the interframe variance (SVi,j) of the number (N) of cross-sectional OCT structural pixel intensity (Ii,j,k) at the same region of interest (ROI) based on the following equation [30, 31]:
where i, j, and k indicate the depth location, lateral location, and indices of the cross-sectional OCT image, respectively, as shown in Figure 3B.
Subsequently, the lateral pixel-wise thickness and median speckle variance are employed for high-resolved characterization of the whole blood during the coagulation and drying processes. In addition, the first derivative is based on central difference and is defined as the weighted difference of adjacent pixels, which is given as follows: dI/dt = [I(t+1) - I(t-1)]/2, where I denotes thickness or speckle variance and t denotes time.
Figure 4 shows the cross-sectional OCT image of the whole blood during the coagulation and drying processes. The whole blood slowly loses area in the OCT image with delay time until complete clotting of the whole blood occurs due to evaporation. This is because whole blood consists of 44.55% red blood cells (RBCs), 0.45% white blood cells and platelets, and 55% blood plasma, and water is the main component since the volume fraction of RBCs (fRBC) = 0.66 and the volume fraction of plasma (fplasma) = 0.90 [32].
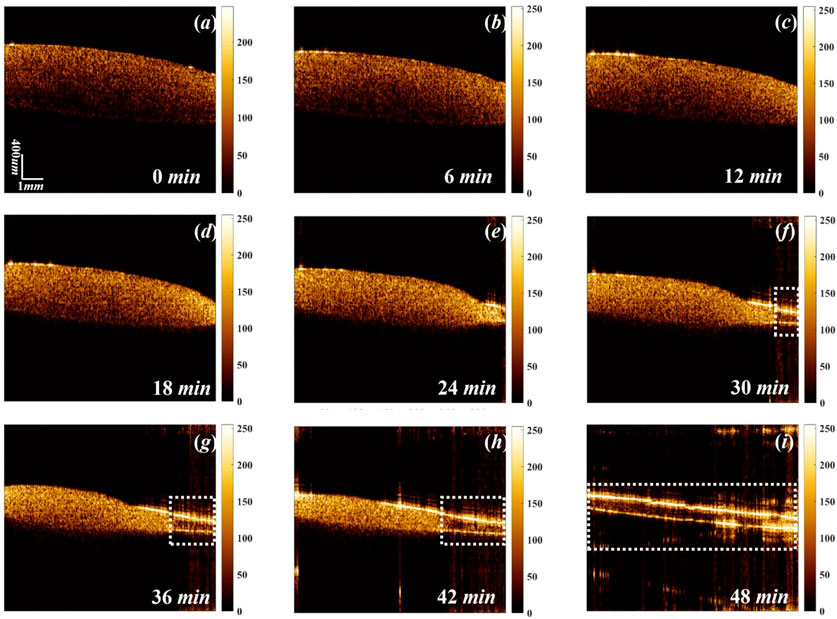
FIGURE 4. Cross-sectional OCT image of whole blood during coagulation and drying processes with different delaying times of (A) 0 min, (B) 6 min, (C) 12 min, (D) 18 min, (E)24 min, (F) 30 min, (G) 36 min, (H) 42 min, and (I) 48 min. White dot rectangles denotes the complete clot regions.
Additionally, Figure 4 also reveals that the clotting starts from the right side, and the complete clot region is gradually enlarged to the entire area with delaying time during the coagulation and drying processes, which demonstrates that the whole blood does not dry and coagulate in a uniform manner, which is consistent with the results of Smith [23]. These phenomena are mainly due to evaporation, and the right edge of the whole blood drop is thinner than the left edge. The whole blood begins to coagulate first and then its clotting factors diffuse [1], which induces clotting of blood from the right side to the left side. Thus, the areas of the whole blood are correlated to the drying process.
Figure 5 shows the corresponding speckle variance image of whole blood with CNN segmentation during the coagulation and drying processes. Speckle variance of whole blood decreases with the delaying time, mainly because of the coagulation of whole blood, in which the contact pathway of triggering blood clotting plays an important role in clot formation in vitro [33]. In addition, Figure 6C shows that there is strong noise in the speckle variance image of whole blood since speckle variance is sensitive to noise, as shown in Figure 6A, and the statistical distribution of OCT signals [34]. Figure 6B demonstrates that the speckle variance image combined with CNN segmentation can overcome the problem of speckle variance noise. Thus, the advantage of deep learning is that it can effectively extract regions of interest, such as the location of whole blood, and effectively reduce noise.

FIGURE 5. Corresponding cross-sectional speckle variance OCT image of whole blood during coagulation and drying processes with different delaying times of (A) 0 min, (B) 6 min, (C) 12 min, (D) 18 min, (E) 24 min, (F) 30 min, (G) 36 min, (H) 42 min, and (I)48 min.

FIGURE 6. (A) Cross-sectional OCT image of whole blood, (B) corresponding speckle variance with CNN segmentation, and (C) corresponding speckle variance without CNN segmentation.
At first, the whole blood is in the liquid state, and the RBCs are the dominant scattering particles. The viscosity of the whole blood is relatively low, and the small RBCs undergo rapid motion. This is due to the fact that the Brownian motion of light scattering centers is directly related to the viscoelastic properties of the medium [35]. During blood coagulation, the blood progressively turns into a gel state because fibrinogen is converted into fibrin through a coagulation cascade reaction [2, 5]. The RBCs can aggregate and are dominant scattering particles. The size of red blood cell aggregation (RBCA) increases, and its motion slows down because of the viscoelastic properties of the clot, which restricts Brownian displacements of scatterers within whole blood. Consequently, coagulated blood alters the rate of OCT intensity fluctuations compared to liquid blood [11], which results in a decrease in speckle variance. Therefore, speckle variance could be used to quantify the coagulation state of the whole blood.
However, the areas could not provide the spatial heterogeneity of whole blood during this procedure. The pixel-wise thickness is employed to characterize the spatial heterogeneity of whole blood throughout the drying process since the areas can be calculated by the sum of the pixel-wise thickness. Figure 7 shows the plot of the thickness and its first derivative vs. delaying time, and three stages, namely, regime I, transition regime, and regime II can be identified based on the first derivative of thickness. These three stages are consistent with those found by Sobac et.al [3]. Regime I is defined as the region between the initial position and the valley in the first derivative curve of thickness. The occurrence time of the valley in the first derivative could be regarded as the desiccation time (TD). Then, the transition regime is located between the valley and peak in the first derivative curve, which is characterized by a sharp decrease in thickness. Finally, regime II is defined as the region from the peak in the first derivative, in which the thickness presents an approximately horizontal tendency, meaning a very slow drying rate. The occurrence time of the peak of the first derivative is defined as the complete evaporation time (Tf), during which the thickness no longer changes with time during the entire drying process [36].
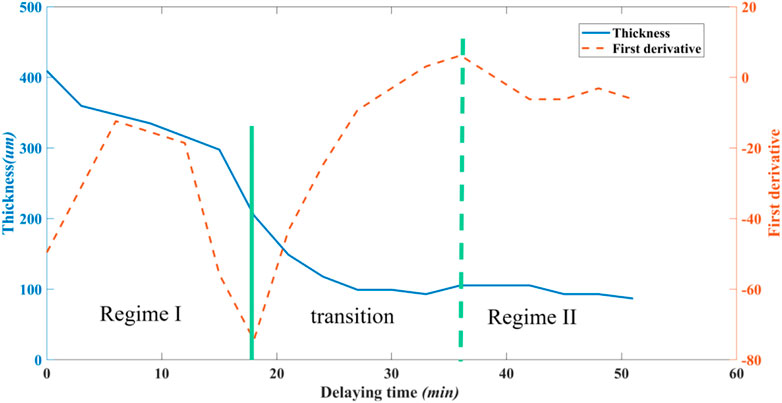
FIGURE 7. Thickness at the right edge of the OCT image and its first derivative versus decaying time. Solid green line represents the valley, and dot green line represents the peak of the first derivative.
As the Brownian motion is different at the beginning and the end of coagulation of the whole blood, the first derivative of speckle variance is employed for the calculation of coagulation metrics, as shown in Figure 8. The process could also be divided into three stages. The occurrence time of the valley in the first derivative curve is defined as the coagulation reaction time (TC). Furthermore, the occurrence time of the peak in the first derivative curve is defined as the gelation time (TG), which has been taken as the time at the end of the sol–gel transition.
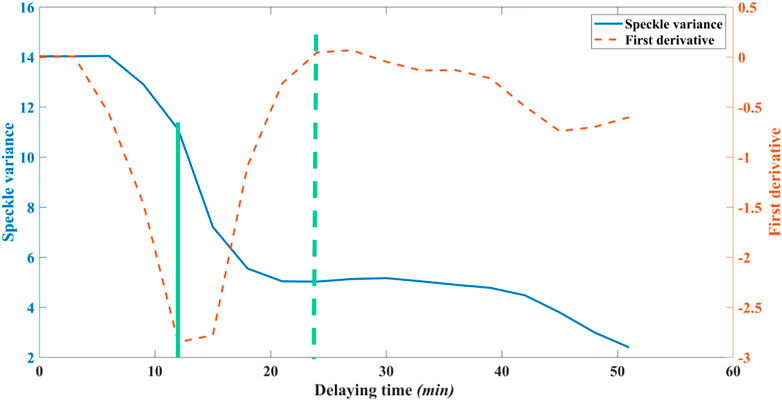
FIGURE 8. Median speckle variance at the right edge of the OCT image and its first derivative versus delaying time. Solid green line represents the valley, and dot green line represents the peak of the first derivative.
The comparison between Figure 7 and Figure 8 gives the following relationship: the coagulation reaction time (TC) < the desiccation time (TD) < the gelation time (TG) < the complete evaporation time (Tf). The coagulation reaction time is TC ∼12 min, whose order of magnitude is same as that of static whole blood without kaolin [21]. In addition, the desiccation time (TD) has the order of magnitude same as that of the gelation time (TG) since TG/TD∼1.33, which is similar to the value of 1.25 in [3]. This is because any escaping blood is first in a liquid state exhibiting Brownian motion, then the liquid blood turns rapidly into a coagulated state, and finally, it converts into a gel state. During the coagulation procedure, the thickness of whole blood decreases due to removal of water by evaporation. After the complete gelation, the thickness of whole blood still decreases due to continuous evaporation.
Figure 9 and Figure 10 show the pixel-wise thickness map and speckle variance map of whole blood and their first derivative during coagulation and drying processes, which are composed of thickness and median speckle variance of 345 points in the whole blood, respectively. Figure 11 shows the pixel-wise desiccation time and coagulation reaction time extracted by Figures 9, 10 based on the valley and peak of the corresponding first derivative, respectively, and demonstrates the different states experienced in the same location for quantitative characterization of whole blood. These figures demonstrate that coagulation and drying of whole blood have spatially inhomogeneous features. As the escaping whole blood begins to evaporate, RBC particles collect at the blood–air interface. The RBC concentration near the interface continues to grow as the whole blood continues to lose water. Meanwhile, RBCs aggregate and their size becomes larger, the viscosity increases, and the diffusivity decreases. Thus, this study provides a new method for analyzing the coagulation and drying processes of whole blood.
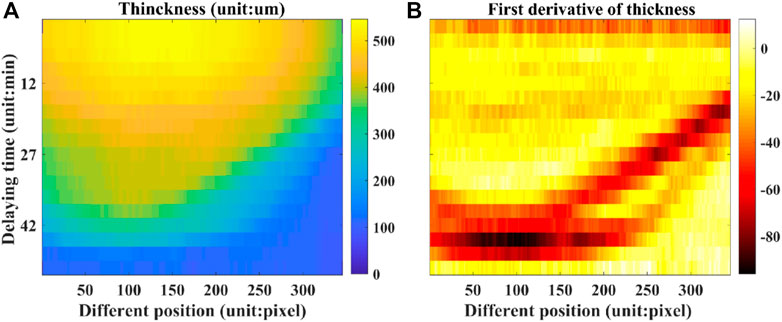
FIGURE 9. (A) Pixel-wise thickness map and (B) corresponding first derivative of whole blood during coagulation and drying processes.
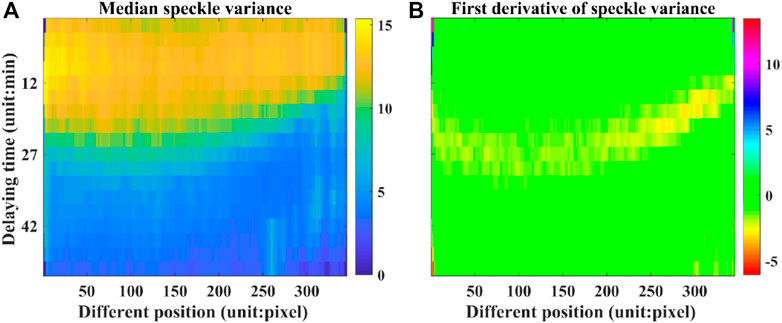
FIGURE 10. (A) Pixel-wise speckle variance map and (B) corresponding first derivative of whole blood during coagulation and drying processes.
In this study, a novel method based on OCT reveals biochemical and physical coupled mechanisms of whole blood. The shape of the blood pool is critical in the dynamics of whole blood, and there are multiple quantization parameters for shape, including the radius of a drop, capillary length, thickness, volume, and contact angle with the surface [23]. Their relationship between shape and dynamics will be explored, and quantitative data combined with statistical analysis will be further presented in the following work. In addition, this method could be further extended to study the effects of several parameters on pattern formation in whole blood, such as temperature [37], relative humidity (RH) of the evaporation environment [38], air velocity [39], the presence of a surfactant [40], and the size [41] and chemical composition [42] of the particles.
In this study, a new method based on optical coherence tomography is presented for simultaneously measuring spatially high-resolved characteristics of coagulation and drying of whole blood during the procedure. The principle of this method is to combine speckle variance with the thickness of whole blood based on high-resolved OCT images, in which a convolutional neural network is employed for obtaining quantitative pixel-wise information. The results indicate that the pixel-wise thickness map provides high-resolved temporal–spatial dynamics of whole blood during the drying procedure, due to the decrease in thickness of whole blood during evaporation. Moreover, the corresponding speckle variance uncovers information on whole blood’s coagulation procedure since Brownian motion decreases with the increasing size of RBCA. Then, the method could provide desiccation time and coagulation reaction time information for quantitative characterization of drying and coagulation, respectively. Additionally, the results demonstrate that coagulation and drying of whole blood have spatially inhomogeneous features. This method could provide a potential for revealing biochemical and physical coupled mechanisms.
The raw data supporting the conclusion of this article will be made available by the authors, without undue reservation.
The animal study was reviewed and approved by the Animal Ethical and Welfare Committee (AEWC) of Affiliated Hospital of Putian University.
Conceptualization, KC and ZL; methodology, experiments, and analysis, SZ, ML, and ZL; writing, KC, SZ, and ZL. All authors have read and agreed to the published version of the manuscript.
This work was supported by the Natural Science Foundation of Putian City (2020S3F002).
The authors declare that the research was conducted in the absence of any commercial or financial relationships that could be construed as a potential conflict of interest.
All claims expressed in this article are solely those of the authors and do not necessarily represent those of their affiliated organizations, or those of the publisher, the editors and the reviewers. Any product that may be evaluated in this article, or claim that may be made by its manufacturer, is not guaranteed or endorsed by the publisher.
1. Panteleev MA, Ovanesov MV, Kireev DA, Shibeko AM, Sinauridze EI, Ananyeva NM, et al. Spatial propagation and localization of blood coagulation are regulated by intrinsic and protein C pathways, respectively. Biophysical J (2006) 90:1489–500. doi:10.1529/biophysj.105.069062
2. Dahlback B. Blood coagulation. The Lancet (2000) 355(9215):1627–32. doi:10.1016/S0140-6736(00)02225-X
3. Sobac B, Brutin D. Structural and evaporative evolutions in desiccating sessile drops of blood. Phys Rev E (2011) 84:011603. doi:10.1103/PhysRevE.84.011603
4. Zeid WB, Brutin D. Influence of relative humidity on spreading, pattern formation and adhesion of a drying drop of whole blood. Colloids Surf A: Physicochemical Eng Aspects (2013) 430:1–7. doi:10.1016/j.colsurfa.2013.03.019
5. Butenas S, Mann KG, Butenas . Blood coagulation. Biochemistry (2002) 67(1):3–12. doi:10.1023/a:1013985911759
6. Monroe DM, Hoffman M. What does it take to make the perfect clot? Arteriosclerosis, Thromb Vasc Biol (2006) 26(1):41–8. doi:10.1161/01.ATV.0000193624.28251.83
7. Harris LF, Castro-Lopez V, Killard AJ. Coagulation monitoring devices: Past, present, and future at the point of care. Trends Anal Chem (2013) 50:85–95. doi:10.1016/j.trac.2013.05.009
8. Paniccia R, Priora R, Liotta AA, Abbate R. Platelet function tests: A comparative review. Vasc Health Risk Manag (2015) 11:133–48. doi:10.2147/VHRM.S44469
9. Bolliger D, Seeberger MD, Tanaka KA. Principles and practice of thromboelastography in clinical coagulation management and transfusion practice. Transfus Med Rev (2012) 26(1):1–13. doi:10.1016/j.tmrv.2011.07.005
10. Wu G, Krebs CR, Lin F-C, Wolberg AS, Oldenburg AL. High sensitivity micro-elastometry: Applications in blood coagulopathy. Ann Biomed Eng (2013) 41:2120–9. doi:10.1007/s10439-013-0817-3
11. Tripathi MM, Hajjarian Z, Van Cott EM, Nadkarni KN. Assessing blood coagulation status with laser speckle rheology. Biomed Opt Express (2014) 5(3):817–31. doi:10.1364/BOE.5.000817
12. Boas DA, Dunn AK. Laser speckle contrast imaging in biomedical optics. J Biomed Opt (2010) 15(1):011109. doi:10.1117/1.3285504
13. Tripathi MM, Egawa S, Wirth AG, Tshikudi DM, Van CottNadkarni EMSK. Clinical evaluation of whole blood prothrombin time (PT) and international normalized ratio (INR) using a Laser Speckle Rheology sensor. Scientific Rep (2017) 7:9169. doi:10.1038/s41598-017-08693-5
14. Gong J, Zhang Y, Zhang H, Li Q, Ren G, Lu W, et al. Evaluation of blood coagulation by optical vortex tracking. Sensors (2022) 22:4793. doi:10.3390/s22134793
15. Louka M, Kaliviotis E. Development of an optical method for the evaluation of whole blood coagulation. Biosensors (2021) 11(4):113. doi:10.3390/bios11040113
16. Lei KF, Chen K-H, Tsui P-H, Tsang N-M. Real-time electrical impedimetric monitoring of blood coagulation process under temperature and hematocrit variations conducted in a microfluidic chip. PLoS ONE (2013) 8(10):e76243. doi:10.1371/journal.pone.0076243
17. Xu X, Lin J, Fu F. Optical coherence tomography to investigate optical properties of blood during coagulation. J Biomed Opt (2011) 16(9):096002. doi:10.1117/1.3615667
18. Liu B, Liu Y, Wei H, Yang X, Wu G, Guo Z, et al. Effects of haemodilution on the optical properties of blood during coagulation studied by optical coherence tomography. Quan Elect (2016) 46(11):1055–60. doi:10.1070/QEL16185
19. Oldenburg AL, Wu G, Spivak D, Tsui F, Wolberg AS, Fischer TH. Imaging and elastometry of blood clots using magnetomotive optical coherence tomography and labeled platelets. IEEE J Selected Toptics Quan Elect (2012) 18(3):1100–9. doi:10.1109/JSTQE.2011.2162580
20. Xu X, Zhu J, Chen Z. Dynamic and quantitative assessment of blood coagulation using optical coherence elastography. Scientific Rep (2016) 6:24294. doi:10.1038/srep24294
21. Tang Y, Zhu J, Zhu L, Fan F, Ma Z, Zhang F. Blood coagulation monitoring under static and flow conditions with optical coherence tomography autocorrelation analysis. Appl Phys Lett (2022) 120:163702. doi:10.1063/5.0090725
22. Sfredel MD, Burada E, Catalin B, Dinescu V, Tartea G, Iancau M, et al. Blood coagulation following an acute ischemic stroke. Curr Health Sci J (2018) 44(2):118–21. doi:10.12865/CHSJ.44.02.04
23. Smith FR, Nicloux C, Brutin D. A new forensic tool to date human blood pools. Scientific Rep (2020) 10:8598. doi:10.1038/s41598-020-65465-4
24. Hamadeh L, Imran S, Bencsik M, Sharpe GR, Johnson MA, Fairhurst DJ. Machine learning analysis for quantitative discrimination of dried blood droplets. Scientific Rep (2020) 10:3313. doi:10.1038/s41598-020-59847-x
25. Sefiane K. Patterns from drying drops. Adv Colloid Interf Sci (2014) 206:372–81. doi:10.1016/j.cis.2013.05.002
26. Attinger D, Brabanter KD, Champod C. Using the likelihood ratio in bloodstain pattern analysis. J Forensic Sci (2022) 67(1):33–43. doi:10.1111/1556-4029.14899
27. Hertaeg MJ, Tabor RF, Routh AF, Garnier G. Pattern formation in drying blood drops. Philosophical Trans R Soc A (2021) 379:20200391. doi:10.1098/rsta.2020.0391
28. Ronneberger O, FischerU-Net PBT. Convolutional networks for biomedical image segmentation. In: N Navab, J Hornegger, W Wells, and A Frangi, editors Medical image computing and computer-assisted intervention -MICCAI 2015. MICCAI 2015. Lecture Notes in Computer Science, 9351 (2015). Cham: Springer. doi:10.1007/978-3-319-24574-4_28
29. Zhou Y, Zhang M, Zhu J, Zheng R, Wu Q. A randomized block-coordinate adam online learning optimization algorithm. Neural Comput Appl (2020) 32:12671–84. doi:10.1007/s00521-020-04718-9
30. Guo S, Wei S, Lee S, Sheu M, Kang S, Kang JU. Intraoperative speckle variance optical coherence tomography for tissue temperature monitoring during cutaneous laser therapy. IEEE J Translational Eng Health Med (2019) 7:1–8. doi:10.1109/JTEHM.2019.2943317
31. Mariampillai A, Leung MKK, Jarvi M, Standish BA, Lee K, Wilson BC, et al. Optimized speckle variance OCT imaging of microvasculature. Opt Lett (2010) 35(8):1257–9. doi:10.1364/OL.35.001257
32. Roggan A, Friebel M, Dorschel K, Hahn A, Mueller GJ. Optical properties of circulating human blood in the wavelength range 400–2500 nm. J Biomed Opt (1999) 4(1):36–46. doi:10.1117/1.429919
33. Smith SA, Travers RJ, Morrissey JH. How it all starts: Initiation of the clotting cascade. Crit Rev Biochem Mol Biol (2015) 5(4):326–36. doi:10.3109/10409238.2015.1050550
34. Li Z, Li H, He Y, Cai S, Xie S. A model of speckle contrast in optical coherence tomography for characterizing the scattering coefficient of homogenous tissues. Phys Med Biol (2008) 53(20):5859–66. doi:10.1088/0031-9155/53/20/020
35. Dasgupta BR, Weitz DA. Microrheology of cross-linked polyacrylamide networks. Physical Reviewer E (2005) 71:021504. doi:10.1103/PhysRevE.71.021504
36. Zeid WB, Vicente J, Brutin D. Influence of evaporation rate on cracks’ formation of a drying drop of whole blood. Colloids Surf A: Physicochemical Eng Aspects (2013) 432:139–46. doi:10.1016/j.colsurfa.2013.04.044
37. Gauthier G, Lazarus V, Pauchard L. Shrinkage star-shaped cracks: Explaining the transition from 90 degrees to 120 degrees. Europhysics Lett (2010) 89:26002. doi:10.1209/0295-5075/89/26002
38. Dragnevski KI, Routh AF, Murray MW, Donald AM. Cracking of drying latex films: An ESEM experiment. Langmuir (2010) 26(11):7747–51. doi:10.1021/la904512q
39. Goehring L, Clegg WJ, Routh AF. Solidification and ordering during directional drying of a colloidal dispersion. Langmuir (2010) 26:9269–75. doi:10.1021/la100125v
40. Deegan RD. Pattern formation in drying drops. Phys Reviewer E (2000) 61(1):475–85. doi:10.1103/PhysRevE.61.475
41. Dufresne ER, Corwin EI, Greenblatt NA, Ashmore J, Wang DY, Dinsmore AD, et al. Flow and fracture in drying nanoparticle suspensions. Phys Rev Lett (2003) 91(22):224501. doi:10.1103/PhysRevLett.91.224501
Keywords: whole blood, optical coherence tomography, speckle variance, convolutional neural network, drying, coagulation
Citation: Zhuo S, Li M, Lu Z and Chen K (2023) High-resolution characterization of the coagulation and drying processes of whole blood based on optical coherence tomography. Front. Phys. 11:1159504. doi: 10.3389/fphy.2023.1159504
Received: 06 February 2023; Accepted: 24 March 2023;
Published: 19 April 2023.
Edited by:
Zhifang Li, Fujian Normal University, ChinaCopyright © 2023 Zhuo, Li, Lu and Chen. This is an open-access article distributed under the terms of the Creative Commons Attribution License (CC BY). The use, distribution or reproduction in other forums is permitted, provided the original author(s) and the copyright owner(s) are credited and that the original publication in this journal is cited, in accordance with accepted academic practice. No use, distribution or reproduction is permitted which does not comply with these terms.
*Correspondence: Zenghai Lu, Wi5MdTJAaHVkLmFjLnVr; Kaihong Cheng, Y2toMTEwMTc4QGZqcGl0LmVkdS5jbg==
Disclaimer: All claims expressed in this article are solely those of the authors and do not necessarily represent those of their affiliated organizations, or those of the publisher, the editors and the reviewers. Any product that may be evaluated in this article or claim that may be made by its manufacturer is not guaranteed or endorsed by the publisher.
Research integrity at Frontiers

Learn more about the work of our research integrity team to safeguard the quality of each article we publish.