 Noureddine Mahdhi
 Norah Salem Alsaiari2
 Abdelfattah Amari
94% of researchers rate our articles as excellent or good
Learn more about the work of our research integrity team to safeguard the quality of each article we publish.
Find out more
ORIGINAL RESEARCH article
Front. Phys., 18 April 2023
Sec. Interdisciplinary Physics
Volume 11 - 2023 | https://doi.org/10.3389/fphy.2023.1159306
This study reports the enhancement of the physical adsorption of some insoluble lead compounds, from drinking water, onto polylactic acid (PLA) polymer and graphene oxide (GO) by filling with molybdenum disulfide (MoS2) nanoparticles (NPs). Based on the Lifshitz theory, we demonstrate the attractive nature of the van der Waals (vdW) interactions that are responsible for the physical adsorption between the cerussite (PbCO3), the pyromorphite (Pb5(PO4)3Cl), and the lead dioxide (PbO2) insoluble adsorbates and the GO/MoS2 and PLA/MoS2 adsorbent nanocomposites in water medium. Subsequently, we show an increase in the physical adsorption, at close and large separation distances (<100 nm) in the water medium, between the lead-insoluble adsorbate and the adsorbent GO/MoS2 and PLA/MoS2 nanocomposites by increasing the filling ratios (0%, 10%, 20%, and 30%) of MoS2 NPs. Moreover, for each lead-insoluble adsorbate, we demonstrate that the vdW adsorption potential and force were more important for GO/MoS2 than for PLA/MoS2 adsorbent. However, for a fixed filling rate, the physical adsorption was more important in the order PbO2 > Pb5(PO4)3Cl > PbCO3. Interestingly, we demonstrate that the physical adsorption strongly depended on the GO/MoS2 and PLA/MoS2 adsorbent type and weakly dependent to the lead compound adsorbates. For all “PbO2, Pb5(PO4)3Cl, and PbCO3” adsorbates, we demonstrate that the vdW adsorption potential and force were higher ∼6, ∼3.1, ∼2.2, and ∼1.9 times for GO than for PLA adsorbent for, respectively, filling ratios 0%, 10%, 20%, and 30% of MoS2 NPs.
Despite the implementation of filtration and purification processes for drinking water, some lead-insoluble compounds remain persisting in domestic drinking water [1–3]. Recently, cerussite (PbCO3), pyromorphite (Pb5(PO4)3Cl), and lead dioxide (PbO2) are among the most hazardous insoluble lead compounds that persist in drinking water distribution systems [2–4]. They are leached in drinking water primarily from corrosive water effects on the household plumbing systems containing lead in pipes, solder, or fittings or from the service connections to homes, galvanic corrosion [4–6]. According to the World Human Organization (WHO), the presence of lead and lead compounds in drinking water causes many hazardous human health diseases, such as neurotoxicity, mutagenicity, and carcinogenicity [7].
There are many physic-chemical purification processes for drinking water, such as photocatalysis, chemical adsorption, reverse osmosis, and chemical coagulation [8, 9]. However, these processes include some disadvantages, essentially high cost-effectiveness and energy consumption [10, 11], lack of solar sensitivity and lower efficiency [11], precipitation of insoluble substances during coagulation-flocculation [12], and removal of the essential multivalent and all monovalent minerals ions required for the human body [13]. In addition to their insolubility in the water medium, the PbO2, PbCO3, and Pb5(PO4)3Cl compounds require higher decomposition temperatures of 588 K, 613 K, and 1,373 K, respectively [14, 15], which makes it very difficult to remove these compounds from drinking water by the previous processes. Moreover, these processes generally comprise the chemical procedure, which may allow the release of a secondary product and the rise in temperature and consequently affect the drinking water quality.
Adequately, physical adsorption is a suitable purification process for this case study. In fact, physical adsorption allows the removal of solid contaminants from water at room temperature and pressure and can operate simultaneously with other purification processes [16, 17]. In contrast to the previously cited process, physical adsorption is low-cost, simple, and easy to design, and no activation energy is necessary. It possesses high running speed compared to other purification processes, is of reversible nature, occurs on many solid surfaces, can remove multimolecular layers, and is performed under normal temperature and pressure conditions [16–18]. In addition, the physical adsorption process can be implemented essentially in a gravity microfilter, which allows the purification of the drinking water without any additional energy.
Nowadays, graphene oxide (GO), polylactic acid (PLA), and molybdenum disulfide (MoS2) have received much attention in the research area of the water purification community. The purification efficiency of drinking water has been largely investigated by photocatalysis and membrane separation [19–21]. In fact, GO, PLA, and MoS2 are promising materials for the application in the physical adsorption process because their natural abundantly, biocompatibility, wide variety of preparation procedures with different size and shape particles [22–24].
Currently, no previous research has investigated the examination of the physical adsorption of the insoluble lead compounds, “PbCO3, Pb5(PO4)3Cl, and PbO2,” onto PLA and GO filled with MoS2 NPs in the water medium.
In this work, we examine the physical adsorption of the lead compounds “PbCO3, Pb5(PO4)3Cl, PbO2” onto GO, PLA matrixes filled with MoS2 NPs in the water medium. First, using the Lifshitz theory, we evaluate the strength and type of van der Waals (vdW) interactions responsible for the physical adsorption by the calculation of the Hamaker constant at large and close separation distance between lead adsorbate and (GO/MoS2, PLA/MoS2) nanocomposites in water medium. Afterward, the investigation of the vdW adsorption potential and force as a function of the filling rates of the MoS2 NPs of the GO and PLA matrix and the lead adsorbate type were made. Later, an enhancement of the adsorption by increasing the refractive index of the adsorbate and adsorbent in a water medium will be demonstrated. Eventually, a comparative study demonstrates that physical adsorption is highly sensitive to the adsorbent type and poorly depends on the adsorbate type.
Adsorbent materials investigated in this study are the PLA polymer and GO filled with MoS2 NPs. The thickness of the adsorbent nanocomposites is considered to be above 1 µm to ensure that the nanoparticle fillers, with an average size of a few nanometers (∼5 nm), were uniformly dispersed in the PLA and GO matrixes. The volume fraction Φ = (0%, 10%, 20%, and 30%) is defined as the percent volume fraction of the MoS2 NPs of the total volume of the nanocomposite mixture. The adsorbates examined in this study are the water-insoluble lead compounds PbCO3, PbO2, and Pb5(PO4)3Cl.
Hereafter, the proposed rates of volume fraction of MoS2 NPs added to PLA and GO matrixes are designated and summarized in Table 1.
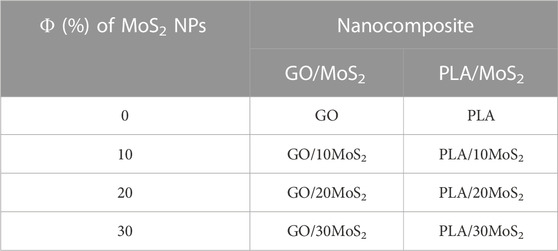
TABLE 1. Designation of GO/MoS2 and PLA/MoS2 nanocomposites as a function of volume fraction of MoS2 filler rates.
In this work, physical adsorption designs the adhesion of the lead compound particles onto a nanocomposite surface in a water medium under the action of intermolecular surface forces. Essentially, physical adsorption is driven by hydrogen binding, hydrophobic interactions, and vdW intermolecular forces, which include Keesom, Debye, and London forces [16–18, 25].
However, in the aqueous medium, the water molecules are expected to occupy a large portion of the H-bonding sites [26]. Consequently, the hydrogen binding is reasonably ignored because the adsorbent and adsorbate were fully hydrated by extending their contact with water [27]. Additionally, for water-insoluble compounds, the hydrophobic interactions are much larger. Then, the higher the affinity, the greater the extent of the adsorption with other near materials [28]. Consequently, the insolubility of such lead compounds constitutes a favor factor for their physical adsorption onto PLA/MoS2 and PLA/MoS2 nanocomposite adsorbent from water medium.
Therefore, the physical adsorption of the insoluble lead compound onto the surface of PLA/MoS2 and PLA/MoS2 nanocomposites is driven solely by the vdW forces in a water medium. Hence, the physical adsorption was called vdW adsorption. Subsequently, the essential purpose of this study is to evaluate the type and strength of the vdW interaction potential and force between the insoluble lead compound and the GO/MoS2 and PLA/MoS2 nanocomposite adsorbate in the water medium.
As shown in Figure 1, the lead compound particle is assimilated to a spherical particle of a radius Rp (adsorbate) that reign in a water medium near a flat surface of the composites (adsorbent) at the distance x << Rp.
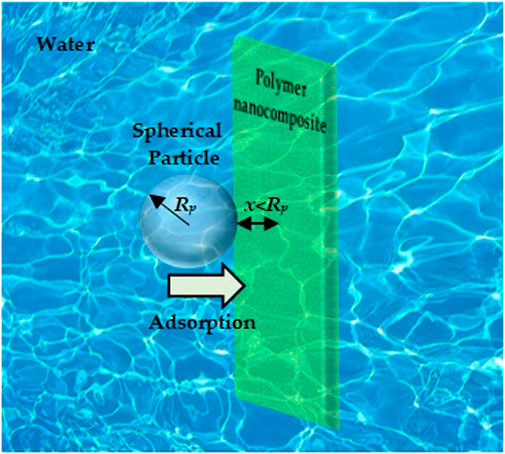
FIGURE 1. Schematic illustration of the physical adsorption: spherical particle adsorbate with radius Rp located near flat adsorbent nanocomposite surface in a water medium at separation distance (x << Rp).
For the evaluation of the vdW interactions, we used the computational methods that have demonstrated good accordance between theoretical and experimental results by many recent studies for evaluating the intermolecular vdW interactions either for accounting for the adhesion force and energy and the adsorption of a variety of materials liquids in aqueous media [25, 29–31].
According to Figure 1, the fully vdW potential involving the adsorption along the separation distance (x ≤ 100 nm) is given as follows [31]:
where
In contrast,
Once the spherical lead particle is submitted to the attractive vdW interactions from the nanocomposite surface in a water medium, it will be adsorbed onto the nanocomposite surface under the action of the vdW adhesion energy expressed analytically by [31]:
where x0 is the closet separation distance between adsorbent and adsorbate molecules after adsorption. It is called the cut-off distance and typically equals 0.165 nm.
The correspondent adhesion force involved by the vdW interactions responsible for the physical adsorption is expressed as [31]:
The Hamaker constant was calculated using the Lifshitz theory, allowing for easy and rigorous analytical calculation of vdW interactions between any two macroscopic media 1 and 2 interacting across medium 3. In such a theory, the influence of neighboring atoms on the interaction between any pair of atoms is ignored, and the materials are treated as continuous media with the same absorption frequencies [31].
The polar Hamaker constant is expressed as a function of the static dielectric constant dominated by the Keesom and Debye interactions of the interacting media:
where kB is the Boltzmann constant, T is the temperature,
In contrast, the dispersive part of the Hamaker constant is expressed as a function of the refractive index of the three interacting media as follows [25]:
where νe is the main electronic absorption frequency in the UV, typically around 3 × 10¹⁵ s−1 [25], h is the Planck constant, and
In fact, the refractive index is the root square of the dielectric constant at optical frequencies (
In Table 2, the dielectric constant and the refractive index for the calculation of the Hamaker constants are obtained from the bibliography.
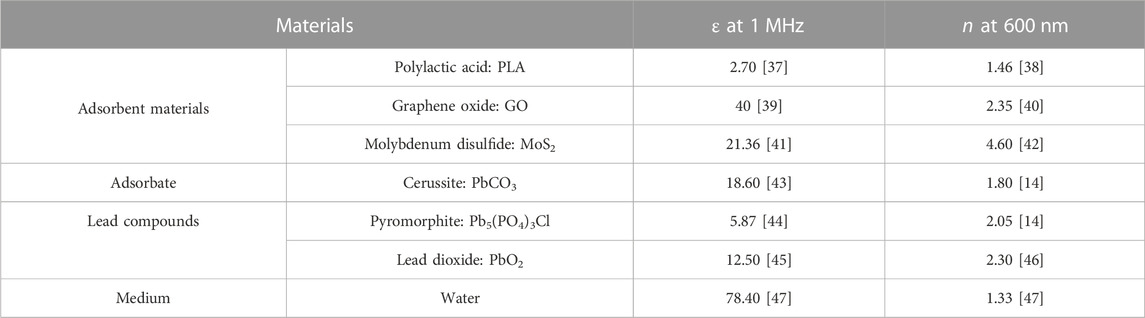
TABLE 2. Dielectric constants and refractive indexes of adsorbent (PLA, GO, and MoS2) and lead-insoluble adsorbate “PbCO3, Pb5(PO4)3Cl, PbO2” and water at room temperature (298 K).
The dielectric constant of the nanocomposite materials is calculated using the Looyenga formula by considering that the nanoparticle filler has a spherical form and is uniformly dispersed in the continuous polymer matrix [48]:
where Φ is the volume fraction (%) of the filler and
The refractive index of the nanocomposites is calculated using the mixing theory of Maxwell Garnet as follows [49]:
where
All the theoretical calculations and discussions of the results were performed under normal conditions of temperature (298 K) and pressure (100 kPa). Hypothetically, the refractive index and the dielectric constant, which are intensive physical properties, are independent of the materials’ size and shape and are considered isotropic for all media.
To obtain the non-retarded Hamaker on the basis of the Lifshitz theory, we first calculated the dielectric constant (Eq. 6) and the refractive index (Eq. 7) of the GO and PLA matrices at volume fraction Φ = (0%, 10%, 20%, and 30%) of the MoS2 NPs filler. As summarized in Table 2, the n of the GO/MoS2 and PLA/MoS2 increases notably with the volume fraction of the MoS2 NPs filler. As it can interpret from equation 7, this is explained by the elevated value of the refractive index of MoS2 NPs compared to GO and PLA matrices.
However, the ε decreases for GO/MoS2 and increases for PLA/MoS2 nanocomposites during filling with MoS2 NPs. This fact is explained by the higher ε of the GO and the lower ε of PLA compared to that for MoS2 NPs.
Therefore, referring to Tables 2, 3, the non-retarded Hamaker constants
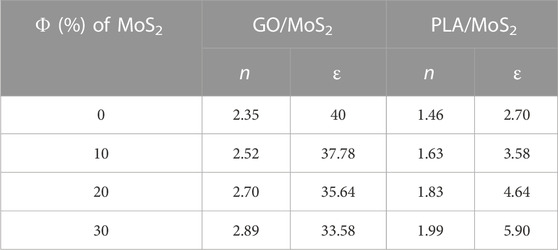
TABLE 3. Refractive index “n” and dielectric constant “ε” of nanocomposites GO/MoS2 and PLA/MoS2 as a function of the volume fraction (Φ) of MoS2 NPs.
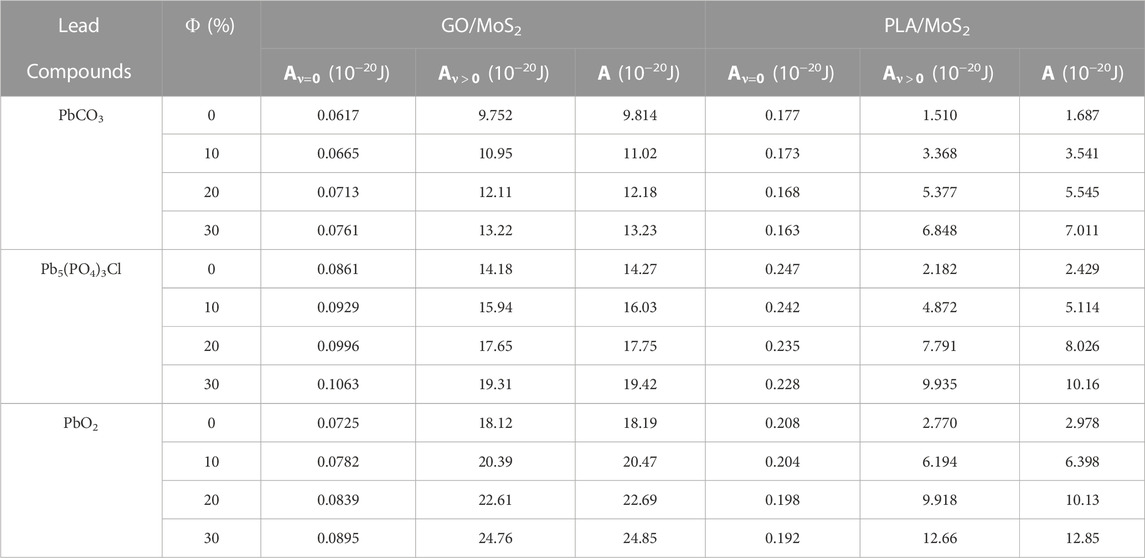
TABLE 4. Non-retarded Hamaker constants for the interactions between adsorbent nanocomposites (GO/MoS2 and PLA/MoS2) and the lead-insoluble adsorbates (PbCO3, Pb5(PO4)3Cl, and PbO2) in a water medium at 298 K.
As shown in Table 4, all the non-retarded Hamaker constants are in good accordance with the order of magnitude of the Hamaker constant, which ranges about ×10−20 J [31]. Effectively, this demonstrates the preciseness of our used theoretical methods for the estimation of the vdW intermolecular interactions. Remarkably, the positive values of the non-retarded Hamaker constant demonstrate the attractive nature of the vdW intermolecular interaction between the nanocomposite adsorbents “GO/MoS2 and PLA/MoS2” and the “PbCO3, Pb5(PO4)3Cl, and PbO2” adsorbates in the water medium. Interestingly, this demonstrates that the physical adsorption of the insoluble lead compounds onto the nanocomposite surface in the water medium is driven by the non-retarded vdW interactions. The findings are consistent with recent findings by Sato et al. [25] and Aoyama et al. [29], demonstrating that the vdW interactions are sufficiently strong to drive the adsorption of colloidal particle adsorption onto polymer gels in the water medium without any other special interaction.
Moreover, the non-retarded Hamaker constant (A) was dominated over >90% by the
Now let us discuss the evolution of the corresponding retarded Hamaker constant at a large separation distance (x ≤ 100 nm). For depicting the contribution of the London dispersion forces and the polar Keesom–Debye on the retarded Hamaker constant, we have drawn
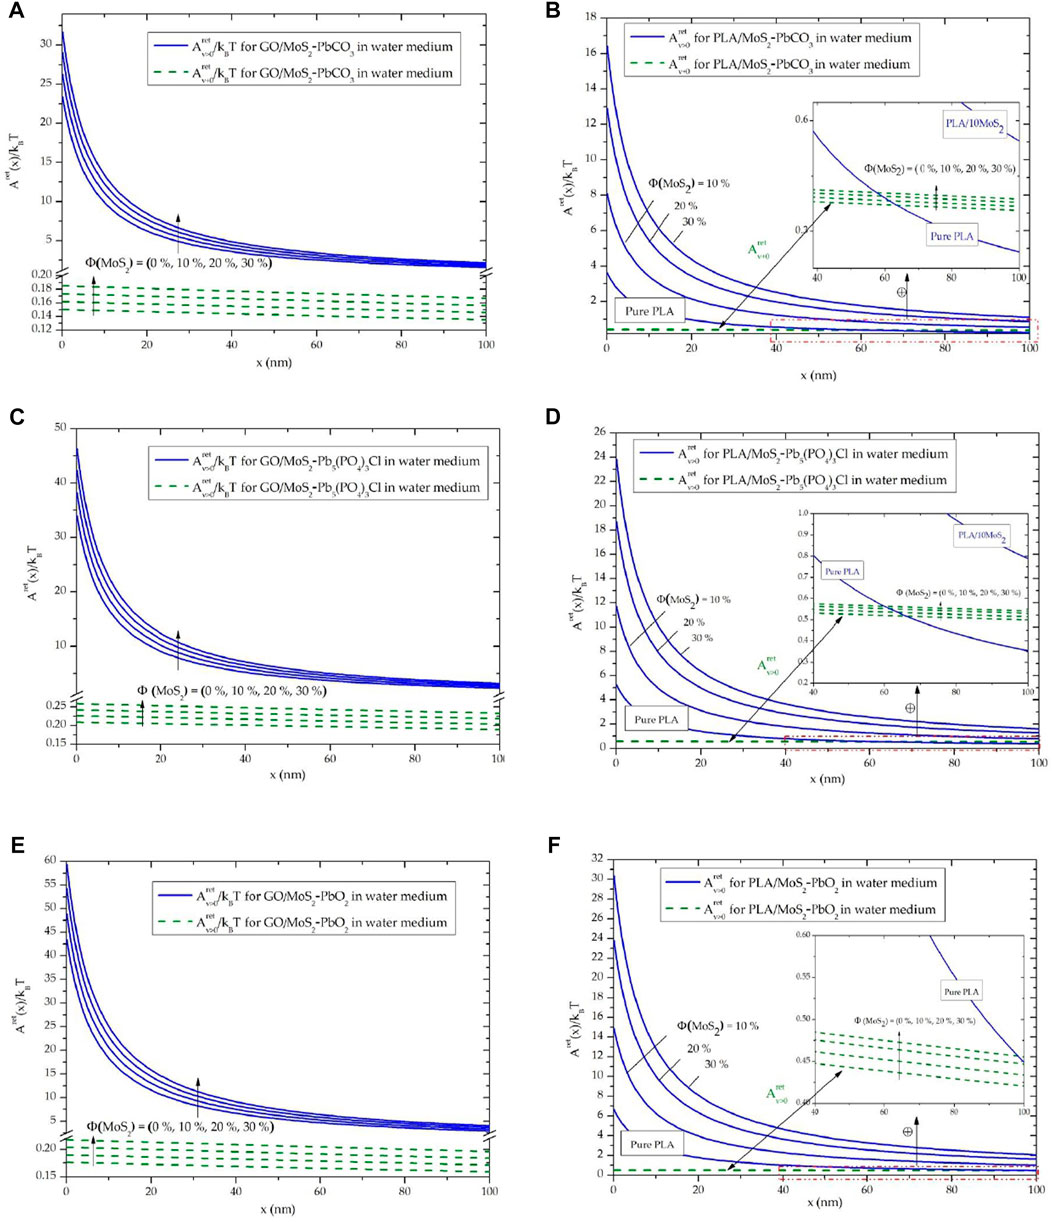
FIGURE 2. Evolution of the retarded Hamaker constant in a water medium between adsorbents and adsorbates: (A) GO/MoS2-PbCO3, (B) PLA/MoS2-PbCO3, (C) GO/MoS2-Pb5(PO4)3Cl, (D) PLA/MoS2-Pb5(PO4)3Cl, (E) GO/MoS2-PbO2, and (F) PLA/MoS2-PbO2.
Subsequently, Figure 2 shows an increase in the vdW interactions, for all adsorbents and adsorbates in the water medium, by increasing the filling with MoS2 NPs. This fact was more important for the interactions between PLA/MoS2 adsorbent, and it can be identified by the dispersion, as the separation becomes closer, of the curves of PLA/MoS2 adsorbent for Φ = (0%, 10%, 20%, and 30%) (Figures 2B–F). From these results, it is important to depict the enhancement of the vdW interactions for PLA and GO adsorbent by increasing the filling rate of MoS2 NPs.
Particularly, at large separation distances (40–100 nm), the dispersive
Hereafter, the adsorption potential, adhesion energy, and force of lead particles onto GO/MoS2 and PLA/MoS2 adsorbent surfaces in the water medium are reported from the Hamaker constant. As presented in Figure 1, we consider the lead particles, with spherical shape with radius Rp = 200 nm, located near the flat adsorbent nanocomposite surface at separation distance (x = 100 nm) << Rp.
The evolution of the vdW potential was calculated from the retarded Hamaker constant using Eq. 1. Figure 3 depicts the evolution of
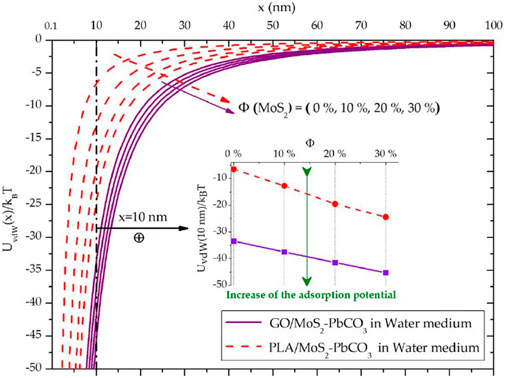
FIGURE 3. Effect of the filling rates with MoS2 NPs on the evolution of the vdW adsorption potential between Cerussite “PbCO3” adsorbate and GO/MoS2 and PLA/MoS2 nanocomposite adsorbents in water medium.
For both GO/MoS2 and PLA/MoS2 nanocomposites, an enhancement of the vdW potential (translating from left to right in Figure 3) with increasing the filling ratios of the MoS2 NPs is remarked. Homogeneously, this result is attributed to the greater refractive index of the MoS2 NPs (n = 4.6) compared with the refractive index of the GO (n = 2.35) and PLA (n = 1.46) (Table 1), which consequently involves an increase in the vdW dispersion forces that drive over 90% of the vdW interactions. As mentioned in Figure 3, for x = 10 nm, we demonstrate the enhancement of the adsorption potential
Analogically, the increase in the retarded Hamaker constant with Φ of the MoS2 NPs, for the interacting systems “GO/MoS2-Pb5(PO4)3Cl,” “PLA/MoS2-Pb5(PO4)3Cl,” “GO/MoS2-PbO2,” and “PLA/MoS2-PbO2” in the water medium (cf. Section 3.1), involves an enhancement of the corresponding vdW adsorption potentials.
To examine the effect of the adsorbent type on the vdW adsorption potential, we have collected, in Figure 4, the evolution of
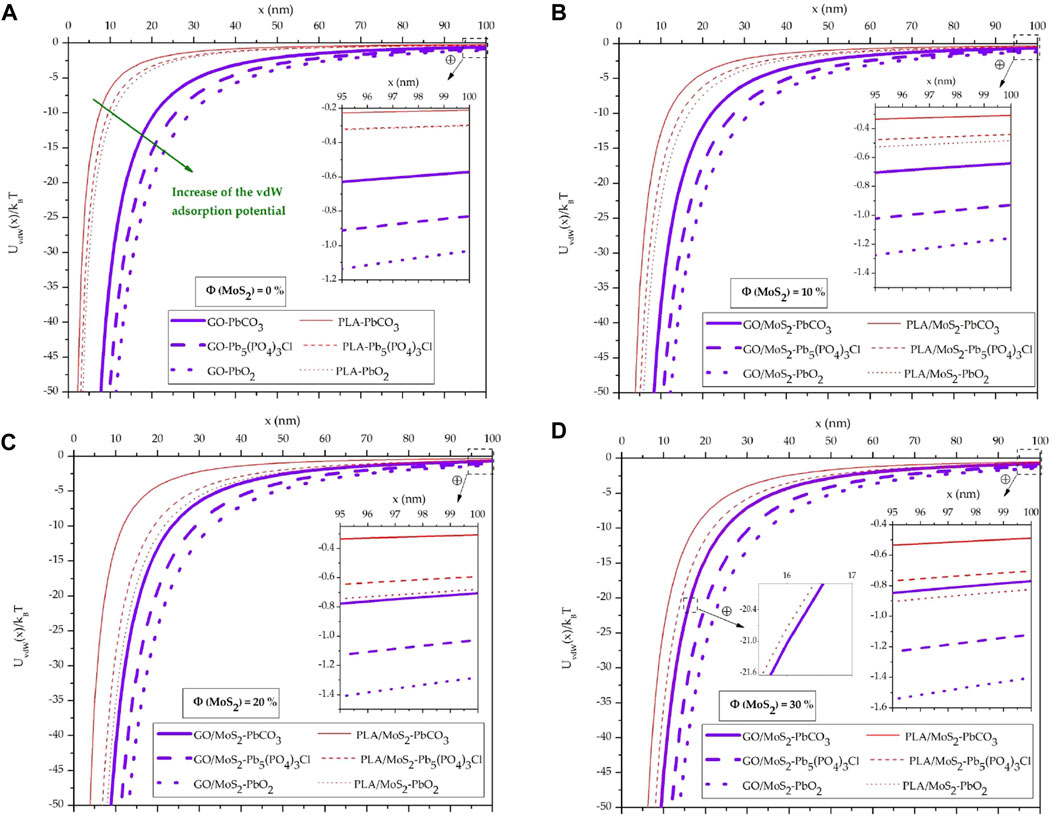
FIGURE 4. Evolution of the vdW adsorption potential between the GO/MoS2 and PLA/MoS2 nanocomposite adsorbents and the “PbCO3, Pb5(PO4)3Cl, and PbO2” lead adsorbates in a water medium: (A) Φ = 0%, (B) Φ = 10%, (C) Φ = 20%, and (D) Φ = 30%.
Qualitatively, these findings indicate that the physical adsorption of the lead compounds is higher on the GO/MoS2 nanocomposite surface than the PLA/MoS2 one. However, for Φ = 30% and at x > 28.4 nm (Figure 4D),
Particularly, this result highlights that despite the poor contribution of the polar Keesom–Debye interactions to the total vdW interactions at close separation, it becomes the driving force for the physical adsorption at large separation.
Thereafter, we examine the strength of the adhesion energy and force that corresponds to the vdW adsorption. The adhesion energy and force of the lead compounds with GO/MoS2 and PLA/MoS2 nanocomposites surface were calculated using Eqs 2, 3. As shown in Figure 5, the vdW adhesion energy and force are, respectively, in the order of ×1,000.kBT and ×100 nN. This is in good agreement with the order of magnitude of the non-covalent interactions scales of the microscopic systems [31] and then demonstrates the accuracy of our used analytics methods.
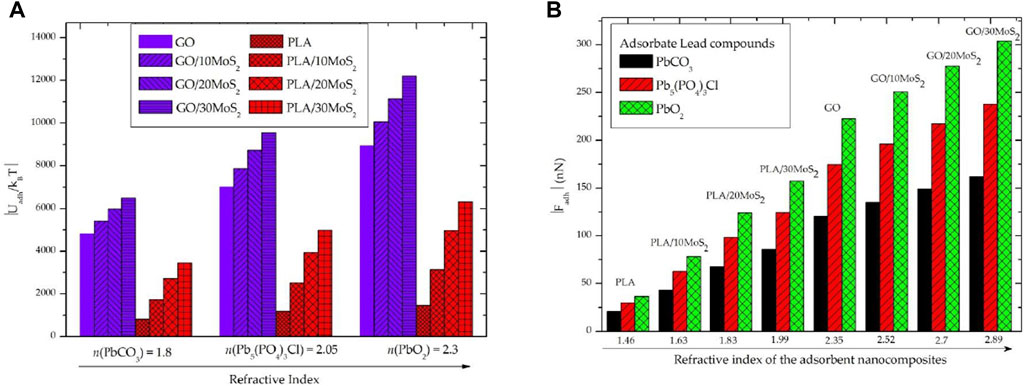
FIGURE 5. Evolution of the vdW adhesion energy and force corresponding to the physical adsorption of the “PbCO3, Pb5(PO4)3Cl, and PbO2” lead compound adsorbates onto “GO/MoS2 and PLA/MoS2” nanocomposite adsorbents in a water medium as a function of the refractive index: (A) adhesion energy and (B) adhesion force.
However, for each adsorbate type of lead compounds,
As shown in Figure 4, for the same nanocomposite adsorbent (GO/MoS2 or PLA/MoS2), we found that
So far, it has been shown that vdW adsorption in the water medium is enhanced by increasing London dispersion interactions for either the adsorbent or the adsorbate or both.
Eventually, it is important to find which interacting medium (adsorbent or adsorbate) has the greatest contribution to the physical vdW adsorption in the water medium. To this purpose, it is efficient to scale the vdW adhesion energy and force of the GO/MOS2 to the PLA/MoS2 nanocomposites for each given lead compound (at Rp = cte) and filling rate of the MoS2 NPs as follows:
As shown in Figure 6, there is little difference between
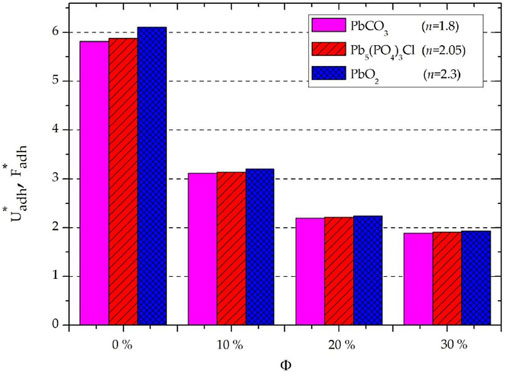
FIGURE 6. Scaled vdW energy and force using Eq. 8 with the same lead adsorbate radius Rp = cte.
Eventually, for all “PbO2, Pb5(PO4)3Cl, and PbCO3” adsorbates,
Effectively, the decrease in the
Figure 7 compiles the evolution of
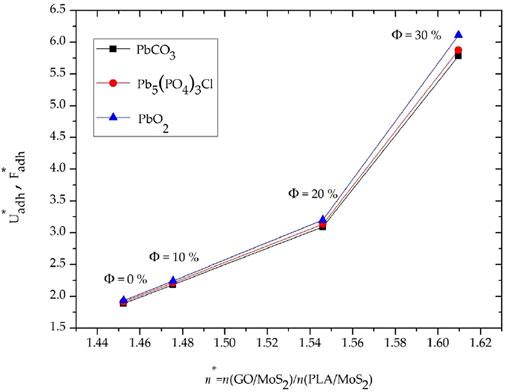
FIGURE 7. Evolution of the scaled energy and force as a function of the refractive index ratio n* considering the lead compounds have the same radius Rp = Cte.
Overall, it is observed in Figure 7 that
Future studies could investigate the vdW adsorption for higher filling rates (Φ > 30%), in which
Furthermore, it is important to note that the adhesion energy and force (Figure 6) constitute the threshold adhesion for the desorption of the lead compounds that may occur under the action of the water flow during nanofiltration or purification processes. Consequently, future theoretical and experimental research should be devoted to valorizing the findings of this study to examine the effect of the water velocity on the desorption of insoluble lead compounds during the nano/microfiltration process.
In summary, the physical adsorption of the PbCO3, PbO2, and Pb5(PO4)3Cl compounds from water onto GO/MoS2 and PLA/MoS2 nanocomposite surface were theoretically investigated on the basis of the Lifshitz theory. The physical adsorption behavior was analyzed in terms of the Hamaker constant, vdW adsorption potential, vdW adhesion energy, and force.
From the analysis of the Hamaker constant at a large separating distance, it is shown that the vdW interactions, which are responsible for the physical adsorption of the insoluble compounds, are dominated over 90% by the London disperse interactions tuned by the refractive index of the adsorbent and adsorbate.
Collectively, for PLA and GO matrixes, it was demonstrated that the physical adsorption of the lead compounds from water was greater on the GO surface, which exhibits a higher refractive index. However, under the filling of the PLA and GO matrixes with MoS2 nanoparticles, a significant enhancement of the Hamaker constant, vdW adsorption potential, vdW adhesion energy, and force was demonstrated.
Overall, the physical adsorption is essentially enhanced by increasing the refractive index of the PLA/MoS2 and GO/MoS2 adsorbents, which can be allowed using an MoS2 nanoparticle.
These findings provide potential qualitative and quantitative recommendations for future experimental studies for the removal of lead compounds from water using GO/MoS2 and PLA/MoS2 nanocomposites.
The original contributions presented in the study are included in the article/supplementary material. Further inquiries can be directed to the corresponding authors.
Conceptualization: NM, AA, and NA; methodology: NM and AA; software: NM; validation: NM and AA; formal analysis: NM, HO, and SH; investigation: NM and AA; resources: NM and NA; data curation: NM; writing—original draft preparation: NM, NA, and AA; writing—review and editing: NM, SH, AA, and HO; visualization: NM; supervision: NM, NA, SH, and AA; project administration: NM, NA, and AA; funding acquisition: NA and AA. All authors have read and agreed to the published version of the manuscript.
This research was funded by the Deanship of Scientific Research at King Khalid University under Grant no. RGP.2/182/43. Additionally, this research was funded by Princess Nourah Bint Abdulrahman University Researchers Supporting Project number (PNURSP2023R19), Princess Nourah Bint Abdulrahman University, Riyadh, Saudi Arabia.
The authors extend their appreciation to the Deanship of Scientific Research at King Khalid University for funding this work through Large Groups Project under Grant no. RGP.2/182/43. Also, the authors express their gratitude to Princess Nourah bint Abdulrahman University Researchers Supporting Project number (PNURSP2023R19), Princess Nourah bint Abdulrahman University, Riyadh, Saudi Arabia.
The authors declare that the research was conducted in the absence of any commercial or financial relationships that could be construed as a potential conflict of interest.
All claims expressed in this article are solely those of the authors and do not necessarily represent those of their affiliated organizations or those of the publisher, the editors, and the reviewers. Any product that may be evaluated in this article, or claim that may be made by its manufacturer, is not guaranteed or endorsed by the publisher.
1. Darren L, Michael S, Casey F, Christina B-S, Stephen H, Mallikarjuna N, et al. Lead particle size fractionation and identification in newark, newersey’s drinking water. Environ Sci Tech (2020) 54(21):13672–9. doi:10.1021/acs.est.0c03797
2. Shu C, Lu C, King C, Joseph L, John F, Kelvin K. Unraveling the causes of excess lead in drinking water supply systems of densely populated high-rise buildings in Hong Kong. Environ Sci Tech (2020) 54(22). doi:10.1021/acs.est.0c03232
3. Yan Z, Yuanyuan Z, Yi-Pin L. Fast detection of lead Dioxide (PbO2) in chlorinated drinking water by a two-stage iodometric method. Environ Sci Tech (2010) 2 44(4):1347–52. doi:10.1021/es902299b
4. Yu-Cheng P, Yi-Fang L, Yi-Pin L. Release of particulate lead from four lead corrosion products in drinking water: A laboratory study coupled with microscopic observations and computational fluid dynamics. Environ Sci Tech (2022) 56(17):12218–27. doi:10.1021/acs.est.2c02461
5. Jing L, Jian-su M. Risk assessment of lead emissions from anthropogenic cycle. Trans Nonferrous Met Soc China (2016) 26:248–55. doi:10.1016/S1003-6326(16)64148-1
6. Lu C, Joseph L, Fung Y. Prediction of lead leaching from galvanic corrosion of lead containing components in copper pipe drinking water supply systems. J Hazard Mater (2022) 436:129169. doi:10.1016/j.jhazmat.2022.129169
7.World Human Organization. Lead in drinking-water: Health risks, monitoring and corrective actions. WHO TEAM Environment, Clim Change Health Water Sanitation, Hyg Health (2022) 1–26. Available at: https://www.who.int/publications/i/item/9789240020863 [Accessed January 15, 2023]
8. Alberto F, Mir D, Ali G. 4 - application of nanotechnology in drinking water purification” in Water Purification. Cambridge, USA: Elsevier Academic Press (2017). 119–67. doi:10.1016/B978-0-12-804300-4.00004-6
9. Satinder A. Chapter 1 - overview of advances in water purification techniques. In: Advances in water purification techniques. Calabash, NC, United States: Elsevier (2019). 1–15. doi:10.1016/B978-0-12-814790-0.00001-6
10. Antonio G, Luis G, Miguel V. Applications of advanced oxidation processes (AOPs) in drinking water treatment. In: The handbook of environmental chemistry. Cham, Switzerland: Springer Nature (2019). 66–149. doi:10.1007/978-3-319-76882-3
11. Iervolino G, Zammit I, Vaiano V, Luigi R. Limitations and prospects for wastewater treatment by UV and visible-light-active heterogeneous photocatalysis: A critical review. Top Curr Chem (2020) 378:7. doi:10.1007/s41061-019-0272-1
12. Muhammad H, Farwa N, Muhammad Z, Farkhanda K, Asma H, Muhammad A. Chapter 23 - applications of coagulation-flocculation and nanotechnology in water treatment. In: Micro and nano technologies, aquananotechnology. Elsevier (2021). 533–58. doi:10.1016/B978-0-12-821141-0.00012-4
13. Yang Z, Zhou Y, Feng Z, Rui X, Zhang T, Zhang Z. A review on reverse osmosis and nanofiltration membranes for water purification. Polymers (2019) 11:1252. doi:10.3390/polym11081252
14. Lide DR. CRC handbook of chemistry and physics. 88Th ed. Boca Raton, FL: CRC Press, Taylor & Francis (2007). 4–64/65.
15. Gu T, Qin S, Wu X. Thermal behavior of pyromorphite (Pb10(PO4)6Cl2): In situ high temperature powder X-ray diffraction study. Crystals (2020) 10:1070. doi:10.3390/cryst10121070
16. Pouran P, Ali T, Mohsen T, Mehrorang G, Sepahdar H. Chapter 1 - fundamentals of adsorption technology” in interface science and technology. Elsevier (2021) 33:1–70. doi:10.1016/B978-0-12-818805-7.00001-1
17. Tawfik S. Chapter 2 - adsorption technology and surface science” in interface science and technology. Elsevier (2022) 34:39–64. doi:10.1016/B978-0-12-849876-7.00006-3
18. James C. Chapter 1 - an overview and some uninteresting history of physisorption. In: Surface area and porosity determinations by physisorption. 2nd ed. Elsevier (2020). 1–57. doi:10.1016/B978-0-12-818785-2.00001-5
19. Arunima N, Brij B, Nupur K, Shreya K. Chapter 5 - graphene oxides and its composites as new generation adsorbents for remediation of toxic pollutants from water: An overview” in Sustainable Materials for Sensing and Remediation of Noxious Pollutants. Elsevier (2022). 65–85. doi:10.1016/B978-0-323-99425-5.00014-1
20. Souravi B, Shubham R, Mousumi M, Sukhen D. 22 - metal oxide/graphene nanocomposites and their biomedical applications. In: Metal oxides, metal oxides for biomedical and biosensor applications. Elsevier (2022). 569–84. doi:10.1016/B978-0-12-823033-6.00020-X
21. Luc A. 9—Synthesis, properties, environmental and biomedical applications of polylactic acid. In: Plastics design library, handbook of biopolymers and biodegradable plastics. New York: William Andrew Publishing (2013). 171–88. doi:10.1016/B978-1-4557-2834-3.00009-4
22. Ashutosh P, Ranjna S, Sudha U, Mitali M, Virendra K, Lalit S, et al. Chapter 12 - production and applications of polylactic acid” in biomass, biofuels. Biochemicals, Elsevier (2021) 309–57. doi:10.1016/B978-0-12-821888-4.00013-7
23. Levna C, Aswini P, Kumar. V, Aneesh P. Chapter 19 - MoS2, a new perspective beyond graphene. In: Micro and nano technologies, fundamentals and properties of multifunctional nanomaterials. Elsevier (2021). 499–541. doi:10.1016/B978-0-12-822352-9.00018-3
24. Chang L, Qingmiao W, Feifei J, Shaoxian S. Adsorption of heavy metals on molybdenum disulfide in water: A critical review. J Mol Liquids (2019) 292:111390. doi:10.1016/j.molliq.2019.111390
25. Sato N, Aoyama Y, Yamanaka J, Toyotama A, Okuzono T. Particle adsorption on hydrogel surfaces in aqueous media due to van der Waals attraction. Sci Rep (2017) 7:6099. doi:10.1038/s41598-017-06257-1
26. Antonius A, Meret A, Ronald J, Dominik R, Thérèse S, Tamar K, et al. Viruses at solid–water interfaces: A systematic assessment of interactions driving adsorption. A Syst Assess Interactions Driving Adsorption Environ Sci Tech (2016) 50:732–43. doi:10.1021/acs.est.5b04644
27. Emily M, Kenneth R, Jacob I. Recent progress in understanding hydrophobic interactions. PNAS (2006) 103:15739–46. doi:10.1073/pnas.0606422103
28. Christian W, Maria S. Effect of surface hydrophobicity on adsorption and relaxation kinetics of albumin and fibrinogen: Single-species and competitive behavior. Langmuir (2001) 17(10):3006–16. doi:10.1021/la0017781
29. Yurina A, Naoko S, Akiko T, Tohru O, Junpei Y. Particle adsorption on polymer gel surface driven by van der Waals attraction. Chem Soc Jpn (2022) 95. 2. doi:10.1246/bcsj.20210356
30. Mahdhi N, Alsaiari NS, Alzahrani M, Katubi M, Amari A, Hammami S. Theoretical investigation of the adsorption of cadmium iodide from water using polyaniline polymer filled with TiO2 and ZnO nanoparticles. Water MDPI (2021) 13:2591. doi:10.3390/w13182591
31. Israelachvili J. Intermolecular and surface forces. 3rd ed. Burlington, NJ, USA: Academic Press (2011). p. 107–316.
32. Keesom H. The cohesion forces in the theory of Van der Waals. Proc Ser B Phys Sci (1921) 23:943–8. Available at: https://ui.adsabs.harvard.edu/abs/1921KNAB.23.943K (Accessed January 15, 2023).
33. Rimai D, Quesnel D. Chapter 3 - particle adhesion. In: Adhesion science and engineering. Elsevier Science B.V (2002). p. 139–91. doi:10.1016/B978-044451140-9/50003-2
34. Russel W, Saville D, Schowalter W. Dispersion forces. In: Colloidal dispersions, cambridge monographs on mechanics. Cambridge: Cambridge University Press (1989). p. 129–61. doi:10.1017/CBO9780511608810.0081
35. London F. The general theory of molecular forces. Trans Faraday Soc (1937) 33:8–26. doi:10.1039/TF937330008B
36. John G. Approximate expressions for retarded van der waals interaction. J Colloid Interf Sci (1981) 83(1):138–45. doi:10.1016/0021-9797(81)90018-7
37. Nicolás R, Francisco C, Valeria T, Claudio J, Ricardo F, Leonardo B. Complex dielectric permittivity of engineering and 3D-printing polymers at Q-band. J Infrared Milli Terahz Waves (2018) 39:1140–7. doi:10.1007/s10762-018-0528-9
38. Si-Ting S, Hang W, Dong H, Ying-Li D, Yang Z, Dong-Po S, et al. Refractive index engineering as a novel strategy toward highly transparent and tough sustainable polymer blends. Chin J Polym Sci (2020) 38:1335–44. doi:10.1007/s10118-020-2439-1
39. Prokhorov E, Barquera-Bibiano Z, Manzano-Ramírez A, Luna-Barcenas G, Kovalenko Y, Hernández-Landaverde A, et al. New insights in graphene oxide dielectric constant. Mater Res Express (2019) 6:085622. doi:10.1088/2053-1591/ab22f0
40. Politano G, Versace C, Vena C, Castriota M, Ciuchi F, Fasanella A, et al. Physical investigation of electrophoretically deposited graphene oxide and reduced graphene oxide thin films. J Appl Phys (2016) 120:195307. doi:10.1063/1.4968000
41. Beal R, Hughes H. Kramers-Kronig analysis of the reflectivity spectra of 2H-MoS2, 2H-MoSe2 and 2H-MoTe2. J Phys C: Solid State Phys (1979) 12:881–90. doi:10.1088/0022-3719/12/5/017
42. Hui Z, Yaoguang M, Yi W, Xin R, Ziang X, Wei W, et al. Measuring the refractive index of highly crystalline monolayer MoS2 with high confidence. Sci Rep (2015) 5:8440. doi:10.1038/srep08440
43. Young K, Frederikse H. Compilation of the static dielectric constant of inorganic solids. J Phys Chem Reference Data (1973) 2:313–410. doi:10.1063/1.3253121
44. Joseph R, Dudley S. “The dielectric constant of mineral powders: Rensselaer polytechnic institute engineering and science series, No. 52,” in The American Mineralogist. Montana, United States: Literary Licensing, LLC (2013) 21 (2), 118.
45. Raza A, Faizan M, Sultana I, Ghulam M, Shahid A, Aneeqa B, et al. Morphology and dielectric studies of natural fibers and PbO2 based flexible composite sheets for potential energy storage applications. J Electron Mater (2020) 49:1896–903. doi:10.1007/s11664-019-07877-1
46. Weast RC. Handbook of chemistry and physics. 68th ed. Boca Raton, Florida: CRC Press Inc. (1987). B-100.
47. Fernández P, Mulev Y, Goodwin H, Sengers L. A database for the static dielectric constant of water and steam. J Phys Chem Ref Data (1995) 24:33–70. doi:10.1063/1.555977
48. Karkkainen K, Sihvola A, Nikoskinen K. Effective permittivity of mixtures: Numerical validation by the FDTD method. IEEE Trans Geosci Remote Sensing (2000) 38:1303–8. doi:10.1109/36.843023
Keywords: physical adsorption, polylactic acid, graphene oxide, molybdenum disulfide, lead compounds, insoluble, drinking water
Citation: Mahdhi N, Alsaiari NS, Amari A, Osman H and Hammami S (2023) Enhancement of the physical adsorption of some insoluble lead compounds from drinking water onto polylactic acid and graphene oxide using molybdenum disulfide nanoparticles: Theoretical investigation. Front. Phys. 11:1159306. doi: 10.3389/fphy.2023.1159306
Received: 05 February 2023; Accepted: 20 March 2023;
Published: 18 April 2023.
Edited by:
Nirpendra Singh, Khalifa University, United Arab EmiratesReviewed by:
Manish Pratap Singh, Veer Bahadur Singh Purvanchal University, IndiaCopyright © 2023 Mahdhi, Alsaiari, Amari, Osman and Hammami. This is an open-access article distributed under the terms of the Creative Commons Attribution License (CC BY). The use, distribution or reproduction in other forums is permitted, provided the original author(s) and the copyright owner(s) are credited and that the original publication in this journal is cited, in accordance with accepted academic practice. No use, distribution or reproduction is permitted which does not comply with these terms.
*Correspondence: Noureddine Mahdhi, bm91cmVkZGluZS5tYWFkaGlAZnN0LnJudS50bg==; Saber Hammami, c2FiZXIuaGFtbWFtaUBjcmhlYS5jbnJzLmZy
Disclaimer: All claims expressed in this article are solely those of the authors and do not necessarily represent those of their affiliated organizations, or those of the publisher, the editors and the reviewers. Any product that may be evaluated in this article or claim that may be made by its manufacturer is not guaranteed or endorsed by the publisher.
Research integrity at Frontiers
Learn more about the work of our research integrity team to safeguard the quality of each article we publish.