 Fengsong Ye1
 Hui Wang
94% of researchers rate our articles as excellent or good
Learn more about the work of our research integrity team to safeguard the quality of each article we publish.
Find out more
ORIGINAL RESEARCH article
Front. Phys., 09 May 2023
Sec. Medical Physics and Imaging
Volume 11 - 2023 | https://doi.org/10.3389/fphy.2023.1152676
This article is part of the Research TopicAdvances of Synchrotron Radiation-Based X-Ray Imaging in Biomedical ResearchView all 6 articles
Purpose: To investigate the feasibility of dual-modal on-board spectral-CT/CBCT imaging using a CZT photon-counting detector mounted on a Linac by Monte Carlo simulations.
Methods: In this proof-of-concept study, the Monte Carlo software platform of Geant4 Application for Tomography Emission (GATE) and a high-performance computing hardware platform were utilized to design and validate the novel on-board spectral-CT and conventional CBCT imaging system using a single CZT detector integrated into a Linac. Through the combined use of the Monte Carlo simulation and the charge transportation model based on a diffusion equation, we simulated x-ray energy spectra of the CZT detector with pixel sizes ranging of 200–1,000 μm, based on which the optimized pixel size of the detector was determined. Spatial resolution of the CBCT imaging of the system was evaluated by oversampling a tilted tungsten wire. A PMMA phantom, containing calcium and contrast elements of iodine, gadolinium, and gold, was simulated to demonstrate the spectral CT imaging capability of the system by using the K-edge spectral imaging method.
Results: Considering the trade-off between the photon-peak efficiency and spatial resolution of the detector, the pixel size of the CZT detector was determined to be 400 µm. The spatial resolution of the CBCT imaging of the system was estimated to be 19.2 lp/cm@10% modulation transfer function. The CBCT imaging of the system provided sufficient structural details of the phantom with a high image contrast. Compared to the CBCT image of the phantom, the K-edge spectral CT images differentiated the four elements contained within the phantom very well.
Conclusion: The simulation results demonstrated the feasibility of dual-modal on-board spectral-CT/CBCT imaging by using a single CZT photon counting detector in a Linac.
Radiation therapy (RT) has become an indispensable tool for treatment of most cancers, with approximately half of cancer patients receiving radiotherapy during the course of cancer treatment upon the curative or palliative treatment intention [1]. Image guided radiation therapy (IGRT) is currently the mostly adopted RT technique globally, with the purpose of improving target accuracy and precision through imaging of targets during the course of RT treatment [2]. Among the imaging modalities for guiding therapeutic radiation beam delivery, the x-ray imaging, including megavoltage and kilovoltage (MV/kV) planar and volumetric imaging, is the main-stream imaging technique utilized in the RT practice [2, 3]. Based on a survey on IGRT practice patterns in US, replacing portal or planar imaging, cone-beam CT (CBCT) has been the most prevalent modality for pretreatment image guidance due to the improved soft-tissue contrast for monitoring anatomic changes of treatment targets [2]. Currently, daily CBCT is performed for multiple disease sites worldwide with the benefit of reducing planning treatment volume (PTV) margins through addressing geometric and anatomic uncertainties.
However, the well-known drawbacks of the conventional poly-energetic CBCT include metal artifacts and/or beam harden effects, insufficient image contrast for soft tissues (e.g., for abdominal tissues), the lack of functional and/or molecular information about treatment targets, and so forth. These limitations of CBCT make the delineation of treatment targets and the monitoring of treatment responses suboptimized or very challenging, and can therefore compromise the efficacy of RT treatment [4, 5].
Through addressing these limitations, spectral-CT (i.e., dual- or multiple-energy CT) has gained increasing interests in radiation oncology with improved structure delineation, quantitative parameter decomposition, and dose calculation [6]. It can provide quantitative material decomposition images, such as electron density images, iodine maps (e.g., for perfusion blood volume maps that assist in delineation of highly vascularized tumor and aid in visualizing lung function), and so on. These images offer additional value to the treatment planning processes, treatment response monitoring, and differentiation of recurrence from treatment-related changes of tumors [4, 5, 7]. For example, spectral-CT has clinical potential as a complement to PET in patients with certain tumors [8, 9].
In this context, we propose to replace the conventional energy integrated detector (EID) used for CBCT imaging in Linacs with a single CZT photon counting detector (PCD) to realize spectral CT and conventional CBCT for improved IGRT. To the best of our knowledge, there are no PCD-based flat panels used in clinically available Linacs. In this study, we investigated the feasibility of this novel design for on-board spectral-CT/CBCT imaging in a Monte Carlo study by using simulated phantom experiments.
The Monte Carlo software platform of Geant4 Application for Tomography Emission (GATE) Version 6.2 [10] and a high-performance computing hardware platform (Cray CX-1000, Cray Inc.) were utilized to design and validate the designed on-board spectral-CT/CBCT imaging system in a Linac. The computer cluster-based parallel simulations were conducted with the typical 150–200 CPU cores involved concurrently. The independent simulations were performed with random seeds automatically generated each time the GATE was run.
The physics models, including photoelectric effect; Compton scattering; Rayleigh scattering; multiple-electron scattering; ionization; Bremsstrahlung radiation; radioactive decay; and positron annihilation, were used to simulate each photon interaction with phantoms and detector materials, etc. To account for the scattering from the surrounding media to the detector crystals, we also modeled the lead shielding of the CZT detector in the simulations. The energy depositions from each photon in each pixel of the detector were summed by the readout module/digitizer in GATE [11]. The energy blurring of the detector was modeled based on the previous experimental measurements [12]. The energy threshold electronics of the detector were modeled to allocate each detected photon into a specific energy bin data. As summarized in Figure 1, a chain of modules (i.e., a signal process chain) that begin with the readout and end with the signal were modeled in the simulations. The detector output signals realistically simulated the physical observables of a detector response to a particle interacting with it.
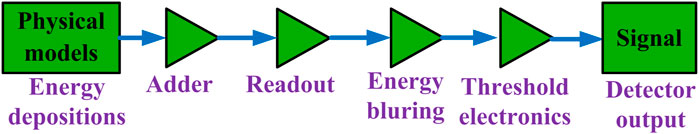
FIGURE 1. A chain of modules that begin with the Adder and end with the Signal that represents the physical observable from the detector.
Conventional CT detectors, also referred to as EIDs, utilize an indirect conversion detection technology, in which a upper layer of scintillators convert the incident x-ray photons into transient visible light and a lower layer of photodiodes further convert the visible light into electronic signals (Figure 2A). Each output signal corresponds to the integrated energy from all the detected x-ray photons, which smears out the energy information of detected photons and then the energy-dependent x-ray attenuation information (i.e., spectral information) of imaged objects. In contrast, PCDs utilize a direct conversion technology, in which a layer of semiconductor detection material directly converts x-ray photons into electron-hole pairs that travel to the corresponding electrodes with a bias voltage applied to them [13, 14]. The electronic signals are directly generated by collecting the charge carriers (i.e., mainly electrons) by the anode (Figure 2B). Each output electronic pulse is proportional to the energy of an incident photon, and the PCDs count individual photons based on the preset energy levels or thresholds. The final energy-bin datasets were obtained by the subtraction of one threshold data with a low threshold from another threshold data with a high threshold.
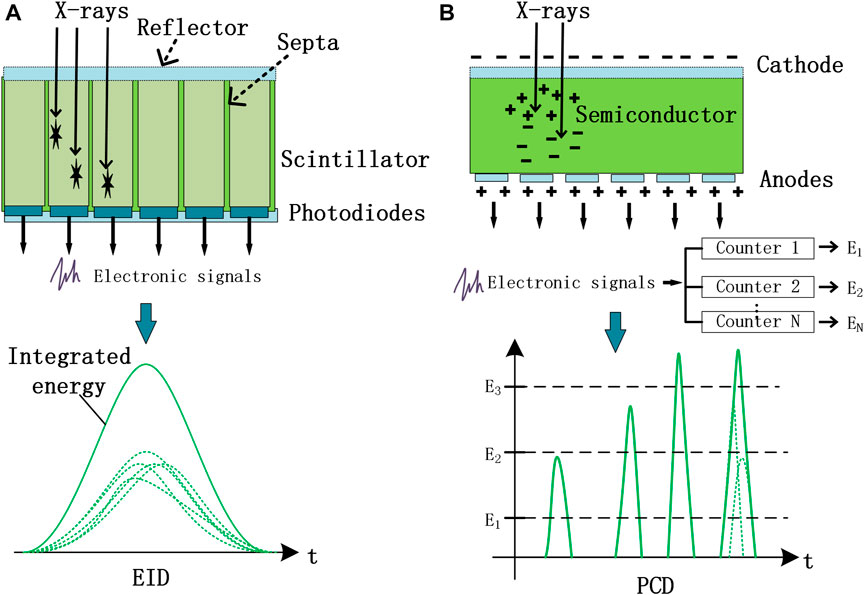
FIGURE 2. Schematic illustration of the principle differences between EID (A) and PCD (B) technologies.
In the ideal case of PCD measurements, one photon will generate one electronic pulse, that is, proportional to the energy of the photon by photoelectric effect, as shown in Figure 3A. However, the energy dispersion in PCD measurements usually occurs by charge sharing effect or secondary photons generated by Compton scatter or K-fluorescence x-ray escape, in which a photon may be registered as two or more pulses by adjacent detector pixels with incorrect energies, especially for a small pixel size of detectors (Figure 3B). This leads to various degradations in both energy spectra and recorded counts (e.g., detection peak efficiency).
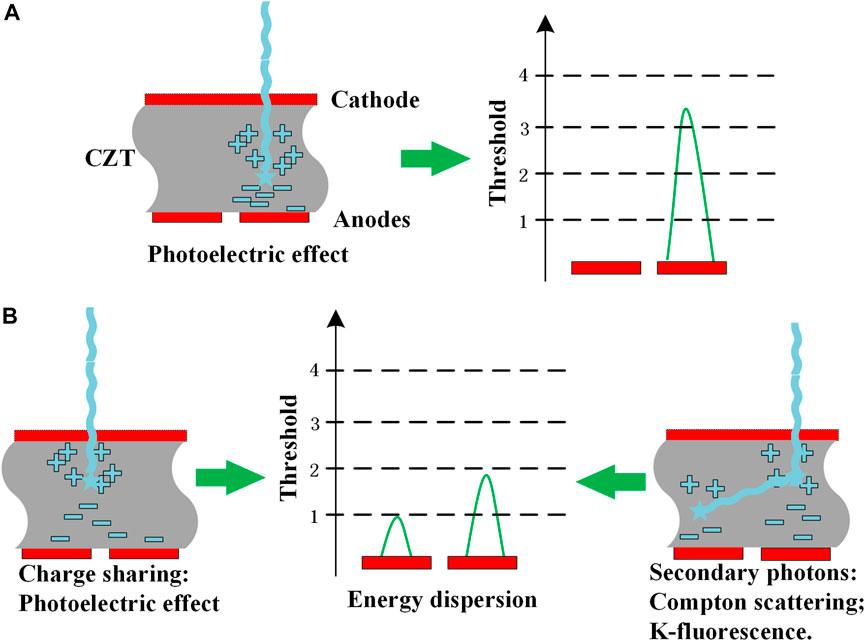
FIGURE 3. Schematic illustration of detection processes of PCDs. (A): proportional to the energy of the photon by photoelectric effect (B): photon may be registered as two or more pulses by adjacent detector pixels with incorrect energies.
To obtain theoretically optimized detector pixel size design, we simulated x-ray energy spectra of the CZT detector with pixel sizes ranging of 200–1,000 μm, through combined using the Monte Carlo simulation and the charge transportation model based on a diffusion equation. The physics interactions of x-ray photons with the CZT detector crystals were simulated using the GATE Monte Carlo code, in which the photoelectric effect and Compton scatter effect mainly contribute to the energy transfer from photons to the CZT conversion medium. The mobile charge carriers (i.e., electrons and holes), generated by the local energy depositions in the CZT bulk, drift toward the detector electrodes under the applied electric field. The deposited energy and interaction position at each interaction site of a photon calculated in the Monte Carlo simulation were recorded for the following charge transportation simulation.
Charge transportation in the CZT bulk was simulated based on the solution of a diffusion equation [15]. After charges with the number of
Because the poor hole transportation characteristic of the semiconductor detector, most of the detection electronics of the CZT detector utilize the electron collection mode. As such, the simulation only considered collecting electrons at the detector electrodes, with the integration time set to allow almost all the produced electrons to arrive at the electrodes. The pixel signals were produced by integrating the collected electrons per incident photon over the pixel surface area. The parameters of the CZT crystal for the simulation were referred to a previous study [15]. The simulation was performed with an equivalent monoenergy x-ray pencil beam impinging on a 2-mm-thick CZT detector. We simulated detection spectra of the CZT detector with four different pixel sizes: 1,000, 500, 400, 200 μm, and the pencil beam was adjusted to hit the CZT detector at the center of the pixel.
Considering the peak detection efficiency of the CZT detector obtained from the simulated spectra and the spatial resolution of the on-board imaging system, we chose the pixel size of 400 µm of the CZT detector with a thickness of 2 mm as a trade-off between detection efficiency and spatial resolution of the detector. This pixel size is the same as that of the XRD 1640 AL digital x-ray detector used in the Elekta Linac in our center.
The schematic view of the designed spectral-CT/CBCT on-board imaging system in a typical Linac is shown in Figure 4. The imaging system consists of a kV x-ray beam source and a pixelated CZT flat panel detector, which are mounted on the gantry and aligned orthogonally to the MV beam direction in the Linac. The geometric configuration of the on-board imaging system was set similar to the VXI on-board imaging system of the Elekta Linac used in our center. The source to detector distance (SDD) and source to rotation axis (isocenter) distance (SAD) of the system were 100.0 cm and 150.0 cm, respectively. The CZT detector panel was modeled with 1024 × 1024 pixels at a resolution of 400 μm, resulting in an active area of 409.6 × 409.6 mm2. As such, the transverse and axial field of view (FOV) of the imaging system using the central detector position were both 27.3 cm.
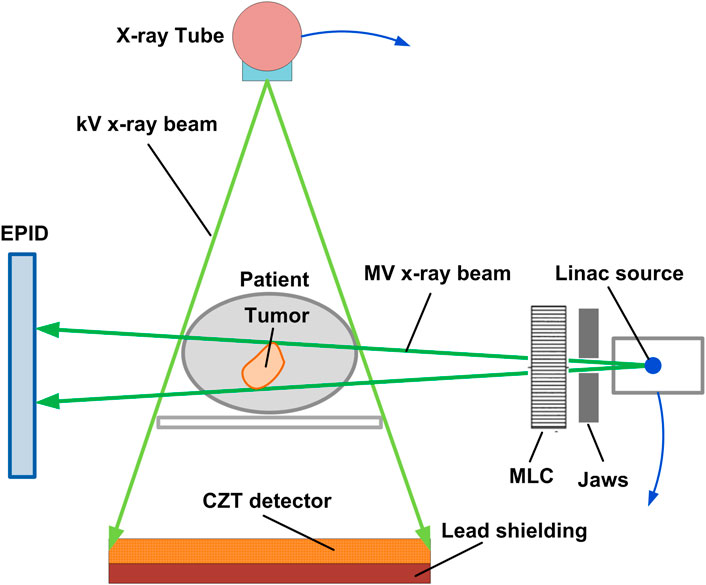
FIGURE 4. Schematic view of a spectral-CT/CBCT on-board imaging system in a Linac.
The x-ray tube was modeled with an anode angle of 14°, a focal spot size of 0.4 mm, and the maximum tube voltage of 140 KV. The x-ray tungsten spectrum was analytically calculated by the spectrum simulator of the SpekCalc. As shown in Figure 5, the spectrum of the x-ray source was generated using an energy interval of 1 keV at 140 kVp, with the 8-mm aluminum and 0.3-mm copper filters as well as the 0.8-mm beryllium inherent filter utilized.
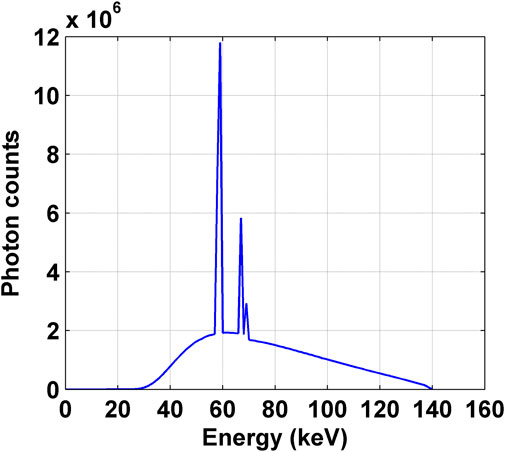
FIGURE 5. The spectrum of x-ray source produced using the SpekCalc software.
Orthogonal to the KV x-ray imaging system, the MV x-ray imaging system (i.e., MV portal imaging or MV CBCT), using an EPID integrated into the Linac, can be used as an effective IGRT tool for specific RT applications.
The wire-based oversampling method was used to estimate the spatial resolution of CBCT imaging the system, through calculating the modulation transfer function (MTF) from the oversampled line spread function (LSF) of the system [16]. A 50-µm-diameter tungsten wire was located in air along the rotation axis with an offset of 3 cm from the rotation center. To obtain the oversampled LSF, the wire was inclined 3° from the rotation axis. Four hundred projections of the wire were acquired with an increment of 0.9° over 360° using the full-energy window of 30–140 keV. The CBCT image of the wire was reconstructed with a voxel size of 0.1 × 0.1 × 0.1 mm by using the FDK algorithm with a Hamming filter from the projection data. From the reconstructed image of the wire, the oversampled LSF was calculated, and then the MTF was obtained by applying a fast Fourier transform to the LSF. In the final step, the MTF was further normalized to zero frequency.
To demonstrate the spectral CT imaging capability of the on-board imaging system, we used the K-edge spectral CT imaging method to differentiate calcium and the high-Z contrast elements of iodine, gadolinium, gold from multiple energy-bin measuments.
In the diagnostic x-ray energy range, the total linear attenuation coefficient, denoted as
where
When a tissue medium uptakes a high-Z element based contrast agent, such as an iodine, gadolinium, or gold based contrast agent, the linear attenuation coefficient
where
Iodine, gadolinium and gold are the three main contrast elements that have been actively investigated in medical imaging and radiotherapy fields, either as an untargeted/targeted contrast agent or a radiosensitizer [18, 19]. Therefore, we mainly focused on these elements in the spectral CT imaging in this study. The curves of linear attenuation coefficients of these elements as well as calcium and the PMMA material in the diagnostic energy range are shown in Figure 6, in which the K-edge energies of iodine, gadolinium and gold are 33.2, 50.2, and 80.7 keV, respectively.
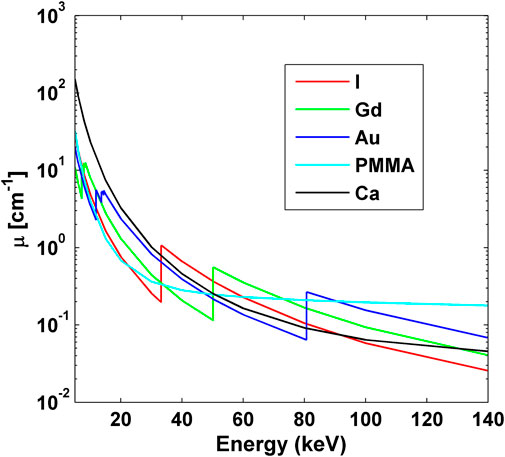
FIGURE 6. Linear attenuation coefficients of the elements of iodine, gadolinium, gold (all 30 mg/cm3), calcium (250 mg/cm3), and the mixture of PMMA (1.195 g/cm3). The K-edge energies of iodine, gadolinium and gold are 33.2, 50.2, and 80.7 keV, respectively.
As shown in Figure 6, iodine shows sharply increased x-ray attenuation after its K-edge energy of 33.2 keV, which is higher than those of gadolinium and gold until the K-edge energy of gadolinium. Similarly, gadolinium shows sharply increased x-ray attenuation after its K-edge energy of 50.2 keV, which is higher than those of iodine and gold until the K-edge energy of gold. In the same way, gold’s x-ray attenuation is higher than those of iodine and gadolinium after the K-edge energy of 80.7 keV of gold. Therefore, the energy bins of 30–50, 50–80, and 80–140 keV were chosen to image iodine, gadolinium and gold, respectively.
To demonstrate the spectral CT and CBCT imaging of the on-board imaging system, a cylindrical PMMA phantom was designed with the inserts filled with different high-Z element based imaging probes or agents. As shown in Figure 7, the PMMA phantom with a diameter of 16 cm and a height of 20 cm contained four groups of inserts with a diameter of 16 mm. The inserts were filled with aqueous solutions containing iodine, gadolinium, gold (all are 30 mg/mL), and calcium (250 mg/mL), respectively. Using the K-edge spectral CT imaging method, the iodine-, gadolinium-, and gold-based probes in the phantom can be distinguished.
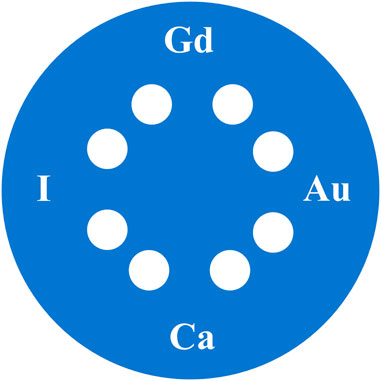
FIGURE 7. A cylindrical PMMA phantom (16 cm in diameter and 20 cm in length) consist of inserts with a diameter of 16 mm, which were filled with aqueous solutions containing iodine, gadolinium, gold (all 30 mg/mL), and calcium (250 mg/mL), respectively.
The PMMA phantom was scanned with 400 projection angles over 360° with data collection time of 0.1 s each step without considering the mechanical rotation time of the gantry. The resulting photon count rate of the CZT detector was roughly 4.42 × 10⁴ counts/s/mm2 without phantoms included in the x-ray beam. As mentioned above, the three energy bins were chosen to differentiate the different probes in the phantom. The K-edge energy-bin spectral CT images and the CBCT image of the phantom were reconstructed by using the FDK algorithm with the Hamming filter from the energy-bin projection dataset and the whole energy range (30–140 keV) projection data, which were normalized by their maximum values (i.e., normalized by air attenuation), respectively. The reconstructed voxel size was 0.2 × 0.2 × 0.2 mm, and the displayed images were the average of several central slices with a total thickness of 4 mm. The subsequent image analysis was based on these averages images.
To differentiate various materials in the reconstructed images, the contrast-to-noises (CNRs) of the images were calculated as
where
The simulated photon detection spectra of the CZT detector with pixel sizes ranging from 200 to 1,000 µm were shown in Figure 8. The spectra were obtained by calculating the energy depositions of 12000 photons of 74 keV in the CZT detector crystal with a thickness of 2 mm, with the electric field of 2000 V/cm applied to the detector electrodes. To simulate the electric noise, a normally distributed zero-mean noise with a standard deviation of 200 electrons was added to each pixel of the CZT detector. It can be observed that the photon-peak of the spectrum of the detector increases with the increased pixel size of the detector. The photon-peak value of the spectrum of the detector with the pixel size of 1,000 µm was 2.47 times of the value for the detector with the smallest pixel size of 200 μm, and was slightly higher than that for the detector size of 400 µm (1.22 times) and 500 µm (1.02 times).
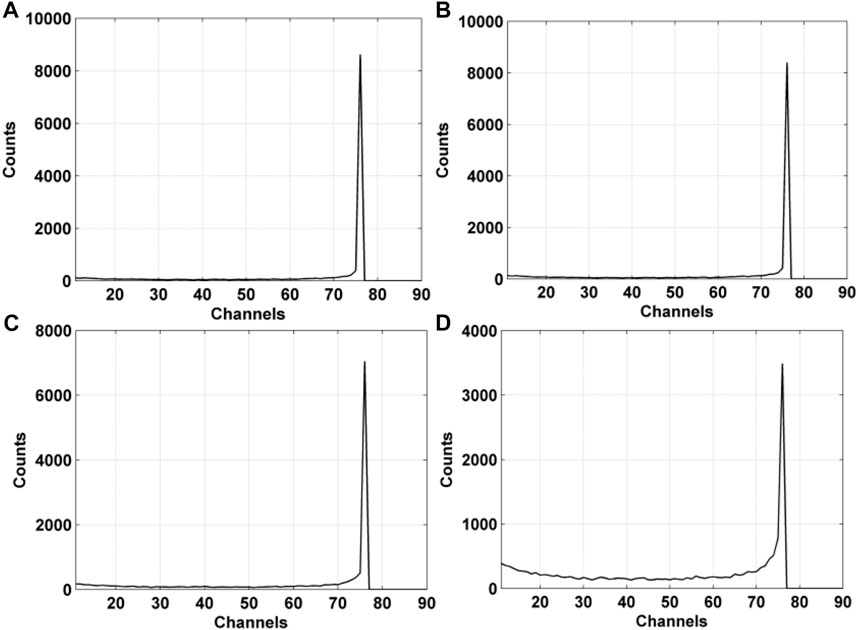
FIGURE 8. Simulated 74-keV photon detection spectra of the CZT detector with various pixel sizes: (A) 1,000 μm; (B) 500 μm; (C) 400 μm; (D) 200 µm.
As shown in Figure 9, the spatial resolution of CBCT imaging of the system was estimated by calculating the MTF from the oversampled LSF of a tungsten wire with a diameter of 50 µm. The result suggested that the system spatial resolution was 19.2 lp/cm at 10% MTF.

FIGURE 9. The measured MTF of CBCT imaging of the system by oversampling a tungsten wire.
The reconstructed CBCT image and K-edge spectral CT images of the phantom (Figure 7) were shown in Figure 10. The K-edge spectral CT images were generated from the projection dataset with three energy bins.
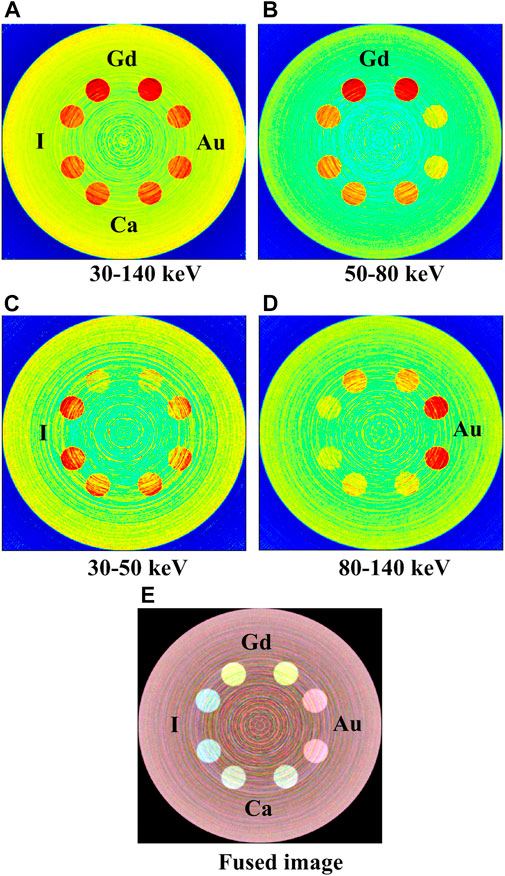
FIGURE 10. Central cross-section images of the PMMA phantom using the K-edge spectral CT imaging method. (A) The CBCT image with the full energy range of 30–140 keV; The K-edge spectral-CT images reconstructed from energy bins of 50–80 keV (B), 30–50 keV (C), 80–140 keV (D), respectively. All images (A–D) are displayed with different color scales (“High” and “Low” indicate high and low attenuation values, respectively). (E) The fused image of K-edge energy-bin images of (B–D). (Color figure can be viewed online).
In the CBCT image (Figure 10A) formed from the full energy range of 30–140 keV, all the inserts were displayed with sufficient structural details. The inserts with gadolinium showed the highest visible image contrasts because of their highest average x-ray attenuation compared to the other inserts in the full energy range. As such, the gadolinium inserts can be easily distinguished from the other inserts. However, the differentiation of the other three kinds of inserts filled with calcium, iodine and gold was unachievable, due to the similar average x-ray attenuation of them in the full energy range. The intensity gradient from the edge to the center of the image, known as cup artifact, is primarily caused by the uncorrected cone-beam scatter effect that occurs during the image reconstruction process.
In contrast, the differentiation of these inserts with different elements was possible in the K-edge spectral CT images, due to the different x-ray attenuation profiles of these elements across the three energy bins (Figure 6). In the image generated from the energy bin of 50–80 keV (Figure 10B), the gadolinium inserts were easily differentiated from other inserts. This is attributable to the highest average x-ray attenuation of gadolinium compared to other elements in the energy bin of 50–80 keV, which can be observed from the linear attenuation coefficient curves shown in Figure 6.
In the image generated from the energy bin of 30–50 keV (Figure 10C), iodine inserts were distinguished from the others due to the highest average x-ray attenuation of iodine compared to other elements. Similarly, in the image formed from the energy bin of 80–140 keV (Figure 10D), the gold inserts distinguished well from the others. The fused image from three energy-bin images of Figures 10B–D was shown in Figure 10E, which was rendered as the superposition of three channel (i.e., red, green, blue) images (i.e., energy-bin images). Although the calcium inserts were not differentiated apparently in the energy-bin images, they were distinguished well in the fused image, due to the different x-ray attenuation profiles across the three energy bins compared to other inserts. In the fused image, four elements can be discerned well.
The calculated CNRs of inserts in the images shown in Figures 10A–D were displayed in Figure 11. It can be observed that CNRs of different inserts changed differently across the energy bins. The CNRs of inserts of iodine, gadolinium, and gold showed highest values in the corresponding energy bin of 30–50, 50–80, and 80–140 keV (i.e., K-edge energy bins), respectively, as compared to other elements. This made the differentiation of iodine, gadolinium and gold from other elements feasible. Although the CNR values of calcium and gold inserts were similar in the energy bin of 30–50 keV, they were considerably different in the energy bins of 50–80 and 80–140 keV, which made the differentiation of calcium inserts from gold inserts viable. As such, the four elements were distinguished well in the K-edge spectral CT images.
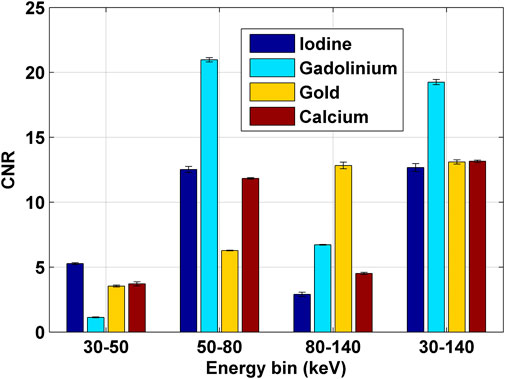
FIGURE 11. The CNRs of inserts of iodine, gadolinium, gold and calcium in the PMMA phantom calculated from the images shown in Figures 10A–D.
From CNRs of inserts calculated from the image of full energy bin (i.e., 30–140 keV), it can be observed that CNR values of all inserts were relatively uniform except for the gadolinium insert, which made the differentiation of different elements difficult. However, the overall CNR values of all inserts were relatively high, which suggested that the CBCT imaging of the system provided high-quality structural imaging of the phantom.
Through using the simulated phantom experiments, the feasibility of dual-modal spectral-CT/CBCT functional/molecular on-board imaging by using a single CZT photon-counting detector in a Linac was demonstrated. The CBCT imaging of the system provides high-quality structural images of treatment targets; the spectral CT imaging of the system offers the capability of functional/molecular imaging of tumors, which adds more dimensions of information about tumors for more accurate IGRT or even biologically guided RT.
In addition to conventional CBCT, as a standard on-board imaging device for IGRT in Linacs, contrast-enhanced spectral CT was added to power up the image-guidance capability in RT processes. Although conventional on-board CBCT performs well for localization of bony anatomical structures, it is soft tissue localization performance is inferior due to low soft tissue contrast and lack of biological information related to tumor microenvironment changes during the course radiation treatment. Instead, contrast-enhanced spectral CT helps improve soft tissue visualization and thereby facilitates delineation and localization of target volumes, especially for highly vascularized tissues, such as kidney, liver, and lung, etc. Moreover, spectral-CT/CBCT provides functional/molecular information of tumors that helps visualize the heterogeneous response of the tumor to radiation, and especially identifies the interfraction variations of highly radiation-resistant volumes for potential adaption or update of the treatment plans and/or irradiation fields in real time, thus improving local tumor control and therefore the treatment outcome.
In the patient setup step, on-board contrast-enhanced CBCT/spectral-CT would be mainly used instead of conventional CBCT if needed for localization and verification of target volumes. Due to the intrinsic geometry registration of the CBCT and spectral-CT images, it is convenient to fuse the spectral-CT image with the CBCT image, which helps better verification of the target volume changes and the functional/molecular changes within the tumor, and better identification of the interfraction variations of highly radiation-resistant regions for online adaptive RT.
Offline spectral CT (e.g., dual-energy spectral CT) can be placed in or next to the treatment room to do anatomic/functional IGRT for adaptive radiation therapy (ART) purpose. However, they are usually incompatible with the current treatment machines with challenges in the practical implementations, such as unknown internal organ (especially soft tissue) motion in the couch-to-couch or room-to-room shifting of the patient, re-positioning error, and so on. Therefore, on-board/online imaging with the patient on the treatment position would be desirable for IGRT or ART processes. The CZT photon counting detector was designed to replace the current on-board integration detector in Linacs. In addition to conventional CBCT, it provides on-board spectral CT functional/molecular imaging capability, which enable online functional IGRT for ART.
Furthermore, on-board CBCT based on EIDs can hardly address the material-specific and energy-dependent x-ray spectral attenuation, which indicates the material compositions of tissues related to functional-level changes within tumors. Contrast-enhanced spectral CT can provide high-resolution functional and molecular imaging with the help of biomarker-tagged contrast agents. The distribution of the contrast agent reveals the functional and molecular information within tumors. And the quantification of contrast agent fraction and underlying tissue characteristics based on the contrast-enhanced spectral CT helps delineation, localization and verification of functional changes during the fractionated IGRT/ART processes in a timely manner [6, 20].
The overall good performance of the dual-modal imaging of the system relied on the optimized detector design, in which the detector material and geometrical parameters, such as detector pixel size and thickness, are the critical factors to be optimized according to the specific applications.
Many attractive properties of direct-conversion semiconductor materials make them the desirable detection media for various applications, especially for medical detection applications [15, 21]. CZT is currently a widely used room-temperature semiconductor material for x-ray and gamma ray detection in medical applications. In addition to high spatial and energy resolutions of CZT detectors, the inherent high resistivity of CZT allows detection of x-ray photons with a low noise level. Moreover, the inherent high yield of charge carriers (i.e., e-h pairs) of CZT crystal ensures the high detection efficiency for x-ray photons [15]. Compared to the scintillator-based indirect-conversion detectors, the high photon counting capability of CZT detectors enables energy-resolved multi-energy photon counting CT or spectral CT imaging. Therefore, we chose CZT as detector material for spectral-CT/CBCT imaging of the system.
For pixelated semiconductor detectors, the detector pixel size and thickness are the two important parameters that determine most imaging metrics of the system. There are mainly two physics processes involved in the detection of x-ray radiation using semiconductor detectors: 1) the electromagnetic interactions between the incident photons and the detector crystal materials; 2) the transportation of charge carriers (i.e., electrons and holes) produced by electromagnetic energy depositions upon the voltage applied to the detector electrodes. As mentioned above, the photoelectric effect and Compton scattering effect mainly account for the energy transfer from photons to the semiconductor detector crystal. The produced electrons and holes move toward the according electrodes and induced detectable electronics signals.
The charge transportation effects, such as the charge-sharing effect between adjacent pixels, polarization effect and pulse pile-up effect under high flux photon irradiation, can deteriorate the performance of the detectors [21]. On one hand, the inherent high spatial resolution and enhanced small-pixel effect of semiconductor detectors can be achieved using the small pixel size design, partly due to the improved electron collection efficiency with minimized poor hole collections. In addition, the pulse pile-up effect can be reduced with the small pixel size of the detector. On the other hand, the charge-sharing effect of the detector will be dominant with the small pixel size of the detector, which deteriorates the energy response and spatial resolution of the detector if this effect were not compensated for by an anti-charge-sharing circuit (i.e., charge-summing circuit).
We set the photon count rate of the CZT detector as low as about 4.4 × 10⁴ counts/s/mm2 in data acquisitions. The polarization and pulse pile-up effects of the detector under this low-flux x-ray irradiation should be negligible. Furthermore, the polarization of the detector can be further suppressed by optimizing the detector operating parameters, such as bias voltage applied to the detector electrodes, operating temperature of the detector, and so on.
The design of detector thickness is a trade-off among major performance parameters of the semiconductor detector. While the attenuation length at certain energy range of the semiconductor material is the main factor to determine the theoretical thickness of the detector with sufficient detection efficiency, the volume or thickness of the semiconductor crystal that can be fabricated with high quality in real situations should be taken into account. To maintain high spatial and energy resolutions of the detector, the thickness of the detector crystal should be limited considering the charge transportation effects, which can restrain the detection efficiency of the detector. As the thickness of the detector increases with increased detection efficiency, charge transportation effects of the detector become more significant due to the longer transportation time of charges within the detector crystal, which could compromise the performance of the detector.
To understand the charge transportation effects of the CZT detector used in this study, especially the charge-sharing effect between adjacent detector pixels, we simulated detection energy spectra of a CZT detector with a thickness of 2 mm and various pixel sizes ranging from 0.2 to 1.0 mm, by using the MC simulation and an analytical transport equation. Based on the aforementioned factors and detector simulations, the optimized design of the CZT detector used in the dual-modal on-board imaging of the system was achieved.
To translate this novel dual-modal on-board imaging design into the physical system and into the clinical implementation in Linacs, some practical technique aspects should be taken into account in the process of building a real system, though there is no obstacles in this translation.
In the busy clinic, the time efficiency of the IGRT or ART workflow is crucial considering patient throughput and the potential uncertainties caused by organ motions and physiological changes during the treatment beam delivery. We conducted simulations to address the optimal detector pixel size design for a high photo-peak efficiency of the detector while maintaining reduced pixel cross talks (e.g., K-fluorescence escape, Compton scatters, or charge sharing in the CZT crystals). A high photo-peak efficiency of the detector facilitated a fast RT workflow due to a short data collection time for image formation to guide the treatment beam delivery. Although the scatter effect in the CBCT scan was not corrected considering the time efficiency of the image formation, it can be corrected by the deformable image registration of daily CBCT with the planning CT dataset.
Under high flux x-ray irradiation in real clinical practices, the polarization effect of the CZT detector could cause a reduction of the electric field inside the detector due to the accumulation of immobile, trapped charge carriers and recombination of charge carriers [22]. This effect could consequently cause count loss due to some pulses falling below the detection threshold. A detailed dynamical model of polarization of the CZT semiconductor under high-flux x-ray irradiation was developed by Bale and Szeles [23]. They showed the dominant hole dynamics that triggered a sequence of events that ultimately resulted in a reduced charge collection efficiency of the detector, which caused count spectra to shift to lower energies and even the paralyzed detector. As the X-ray flux was raised above a critical value, counts began to decrease as the flux was increased, ultimately leading to a polarized detector. In this model, the critical flux was found quadratically dependent on the bias voltage applied to the detector. In addition, an exponential dependence of the maximum sustainable flux on the operating temperature of the detector was found in the model. Finally, the dependencies of the maximum sustainable flux on bias voltage and temperature have been experimentally validated using 16 × 16 pixel CZT detector arrays subjected to a high-flux x-ray source of 120 kVp, with a count rate of 5×10⁶ counts/s/mm2 achieved.
As aforementioned, we set a low photon count rate of the CZT detector in data acquisition. As such, the polarization of the detector under this low-flux x-ray irradiation would be negligible. In addition, a previous study demonstrated the clinical image quality achievable for a photon counting imager used under the clinical x-ray photon flux [24]. Furthermore, after overcoming extraordinary technical complexity (including polarization of the detector using clinical x-ray flux irradiation) of semiconductor photon-counting imaging, the world’s first commercialized photon-counting CT scanner was recently issued. Based on these facts, we speculate that the polarization of the detector should not be a big concern in building the real system. However, when build the real system in the future, the polarization of the detector should be taken into account by optimizing the detector operating parameters.
Given the advent of the world’s first photon-counting CT scanner, which has been a major achievement in CT imaging over the last decade. We believe that the proposed dual-modal on-board imaging based on the CZT photon counting detector can be implemented in practice in the near future with fast advances in detector techniques.
The simulation results demonstrated the feasibility of dual-modal on-board spectral-CT/CBCT imaging by using a single CZT photon counting detector in a Linac.
The raw data supporting the conclusion of this article will be made available by the authors, without undue reservation.
FY created the study design. HW collected the clinical and CT data and processed the data. FY and JF conducted data analysis. All authors contributed to the article and approved the submitted version.
This research was supported by Zhejiang Provincial Natural Science Foundation of China under Grant No. LTGY23H220001.
The authors declare that the research was conducted in the absence of any commercial or financial relationships that could be construed as a potential conflict of interest.
All claims expressed in this article are solely those of the authors and do not necessarily represent those of their affiliated organizations, or those of the publisher, the editors and the reviewers. Any product that may be evaluated in this article, or claim that may be made by its manufacturer, is not guaranteed or endorsed by the publisher.
1. Chandra RA, Keane FK, Voncken FEM, Thomas CR. Contemporary radiotherapy: Present and future. Lancet (2021) 398(10295):171–84. doi:10.1016/s0140-6736(21)00233-6
2. Nabavizadeh N, Elliott DA, Chen Y, Kusano AS, Mitin T, Thomas CR, et al. Image guided radiation therapy (IGRT) practice patterns and IGRT's impact on workflow and treatment planning: Results from a national survey of American society for radiation oncology members. Int J Radiat Oncol Biol Phys (2016) 94(4):850–7. doi:10.1016/j.ijrobp.2015.09.035
3. Keall PJ, Nguyen DT, O'Brien R, Zhang P, Happersett L, Bertholet J, et al. Review of real-time 3-dimensional image guided radiation therapy on standard-equipped cancer radiation therapy systems: Are we at the tipping point for the era of real-time radiation therapy? Int J Radiat Oncol Biol Phys (2018) 102(4):922–31. doi:10.1016/j.ijrobp.2018.04.016
4. Noid G, Zhu J, Tai A, Mistry N, Schott D, Prah D, et al. Improving structure delineation for radiation therapy planning using dual-energy CT. Front Oncol (2020) 10:1694. doi:10.3389/fonc.2020.01694
5. Lv Y, Zhou J, Lv X, Tian L, He H, Liu Z, et al. Dual-energy spectral CT quantitative parameters for the differentiation of glioma recurrence from treatment-related changes: A preliminary study. BMC Med Imaging (2020) 20(1):5. doi:10.1186/s12880-019-0406-5
6. Simard M, Lapointe A, Lalonde A, Bahig H, Bouchard H. The potential of photon-counting CT for quantitative contrast-enhanced imaging in radiotherapy. Phys Med Biol (2019) 64(11):115020. doi:10.1088/1361-6560/ab1af1
7. Kruis MF. Improving radiation physics, tumor visualisation, and treatment quantification in radiotherapy with spectral or dual-energy CT. J Appl Clin Med Phys (2022) 23(1):e13468. doi:10.1002/acm2.13468
8. Ito R, Iwano S, Shimamoto H, Umakoshi H, Kawaguchi K, Ito S, et al. A comparative analysis of dual-phase dual-energy CT and FDG-PET/CT for the prediction of histopathological invasiveness of non-small cell lung cancer. Eur J Radiol (2017) 95:186–91. doi:10.1016/j.ejrad.2017.08.010
9. Oldan J, He M, Wu T, Silva AC, Li J, Mitchell JR, et al. Pilot study: Evaluation of dual-energy computed tomography measurement strategies for positron emission tomography correlation in pancreatic adenocarcinoma. J Digit Imaging (2014) 27(6):824–32. doi:10.1007/s10278-014-9707-y
10. Jan S, Benoit D, Becheva E, Carlier T, Cassol F, Descourt P, et al. Gate V6: A major enhancement of the GATE simulation platform enabling modelling of CT and radiotherapy. Phys Med Biol (2011) 56(4):881–901. doi:10.1088/0031-9155/56/4/001
11.Wiki OpenGATE. Users guide:digitizer and readout parameters - wiki OpenGATE, Available at: http://wiki.opengatecollaboration.org/index.php/Users_Guide:Digitizer_and_readout_parameters#Readout. (2022).
12. Hruska CB, O'Connor MK. Nuclear imaging of the breast: Translating achievements in instrumentation into clinical use. Med Phys (2013) 40(5):050901. doi:10.1118/1.4802733
13. Willemink MJ, Persson M, Pourmorteza A, Pelc NJ, Fleischmann D. Photon-counting CT: Technical principles and clinical prospects. Radiology (2018) 289(2):293–312. doi:10.1148/radiol.2018172656
14. Taguchi K, Iwanczyk JS. Vision 20/20: Single photon counting x-ray detectors in medical imaging. Med Phys (2013) 40(10):100901. doi:10.1118/1.4820371
15. Schulman T. CdTe and CdZnTe radiation detectors for imaging applications. Helsinki: dissertation at University of Helsinki (2006).
16. Kwan ALC, Boone JM, Yang K, Huang SY. Evaluation of the spatial resolution characteristics of a cone-beam breast CT scanner. Med Phys (2007) 34(1):275–81. doi:10.1118/1.2400830
17. Alvarez RE, Macovski A. Energy-selective reconstructions in X-ray computerised tomography. Phys Med Biol (1976) 21(5):733–44. doi:10.1088/0031-9155/21/5/002
18. Roessl E, Proksa R. K-edge imaging in x-ray computed tomography using multi-bin photon counting detectors. Phys Med Biol (2007) 52(15):4679–96. doi:10.1088/0031-9155/52/15/020
19. Anderson NG, Butler AP. Clinical applications of spectral molecular imaging: Potential and challenges. Contrast Media Mol Imaging (2014) 9(1):3–12. doi:10.1002/cmmi.1550
20. Lalonde A, Bouchard H. A general method to derive tissue parameters for Monte Carlo dose calculation with multi-energy CT. Phys Med Biol (2016) 61(22):8044–69. doi:10.1088/0031-9155/61/22/8044
21. Wang H, Nie K, Kuang Y. An on-board spectral-CT/CBCT/SPECT imaging configuration for small-animal radiation therapy platform: A Monte Carlo study. IEEE Trans Med Imaging (2020) 39(3):588–600. doi:10.1109/tmi.2019.2932333
22. Strassburg M, Schroeter C, Hackenschmied P. CdTe/CZT under high flux irradiation. J Instrumentation (2011) 6:C01055. doi:10.1088/1748-0221/6/01/c01055
23. Bale DS, Szeles C. Nature of polarization in wide-bandgap semiconductor detectors under high-flux irradiation: Application to semi-insulating Cd1-xZnxTe. Phys Rev B (2008) 77(3):035205. doi:10.1103/physrevb.77.035205
Keywords: spectral-CT, CBCT, photon-counting detector, Monte Carlo (MC), LINAC = linear accelerator
Citation: Ye F, Wang H and Fang J (2023) Linac-integrated on-board spectral-CT/CBCT imaging using a photon-counting detector: a Monte Carlo study. Front. Phys. 11:1152676. doi: 10.3389/fphy.2023.1152676
Received: 28 January 2023; Accepted: 26 April 2023;
Published: 09 May 2023.
Edited by:
Ivo Rausch, Medical University of Vienna, AustriaReviewed by:
Giovanni Di Domenico, University of Ferrara, ItalyCopyright © 2023 Ye, Wang and Fang. This is an open-access article distributed under the terms of the Creative Commons Attribution License (CC BY). The use, distribution or reproduction in other forums is permitted, provided the original author(s) and the copyright owner(s) are credited and that the original publication in this journal is cited, in accordance with accepted academic practice. No use, distribution or reproduction is permitted which does not comply with these terms.
*Correspondence: Jianqiang Fang, MjUxNTg0NTAyQHFxLmNvbQ==
Disclaimer: All claims expressed in this article are solely those of the authors and do not necessarily represent those of their affiliated organizations, or those of the publisher, the editors and the reviewers. Any product that may be evaluated in this article or claim that may be made by its manufacturer is not guaranteed or endorsed by the publisher.
Research integrity at Frontiers
Learn more about the work of our research integrity team to safeguard the quality of each article we publish.