 Long Chen
 Ziteng Yang
- School of Information and Electrical Engineering, Hunan University of Science and Technology, Xiangtan, China
To increase the receiving sensitivity of the reversely single-sideband (RSSB) system with orthogonal frequency division multiplexing (OFDM) signal transmission, we use the improved pilot interval scheme and pilot power scheme in this system. The improved pilot interval scheme uses more pilots in areas where channel conditions are relatively good to avoid signal–signal beat interference (SSBI) issues for sub-carriers. The improved pilot power scheme compensates for frequency-selective fading by increasing the pilot power in areas where channel conditions are relatively poor. According to the simulation, the generated 60 GHz optical millimeter wave with 2.5 G bandwidth OFDM signal is delivered over 100 km standard single-mode fiber (SSMF). The improved pilot interval scheme and pilot power scheme can increase the system’s receiving sensitivity by 2 dB, respectively. These schemes can enhance the system’s performance without increasing the complexity of the algorithm and the costs of the RSSB system.
1 Introduction
In recent years, wireless and broadband have become the research trends of the communication industry. Radio-over-fiber (ROF) technology, combining the advantages of high-frequency wireless communication and optical-fiber communication, can achieve high-frequency signal transmission of ultra-wideband wireless access [1–6]. Orthogonal frequency division multiplexing (OFDM) has become a research hot spot owing to the advantages of its high spectral efficiency and its anti-interference capability. The application of the OFDM to the ROF system can cause millimeter-wave resist dispersion impairments in the fiber link and multipath fading in wireless transmission. Therefore, it is regarded as an effective approach to solving broadband wireless access in the future [7–10]. With the high-frequency spectrum resources, many countries have allocated continuous license-free spectrum resources around 60 GHz. It has motivated many companies and research teams to study the signals in this spectrum segment [11–13]. In the research on ROF, three main issues slow down its development: Improving the energy efficiency of the signal modulation and the signal detection is a concern. The second issue is resisting the loss and walk-off effect in optical fiber links. The last issue is the platform transparency for many signal services in different frequency bands. For the three major problems in ROF, a reversely single-sideband ROF system has been proposed [14]. It is an ROF system without an electric mixer, and it meets the optical frequency doubling. The system has three advantages, including high energy efficiency in modulation, no work-off effect, and multi-band service [15]. Due to its superior performance compared to other earlier systems, the system has been widely recognized and researched since it was proposed [15–18].
Channel estimation is an essential problem in OFDM system design. The basic task of channel estimation is to calculate the channel response for the consequent equalization. The channel frequency response or impulse response is often derived from pilot symbols. An efficient pilot scheme is necessary because we need to use the channel information at pilot sub-carriers to estimate the channel at data sub-carriers. There is no research on channel estimation in the reversely single-sideband (RSSB) system. Because of the unique character of the optical system, the pilot scheme that performs well in wireless communication may perform much differently in the RSSB system. In the present RSSB-OFDM system, the interval of the pilots in the OFDM signal is an equal scheme. However, the OFDM signal will be affected by frequency-selective fading and signal–signal mixing interference in the RSSB system, which differs from the impairment in the traditional wireless communication channels. Therefore, estimating the channel through the pilots is an important problem.
In this study, the pilot setting scheme was optimized. According to the features of the RSSB-OFDM system, the improved pilot interval scheme and the improved pilot power scheme are proposed. In the simulation of the pilot interval scheme, we placed more pilots in the area where channel conditions are relatively good, which can avoid signal–signal beat interference (SSBI). The simulation results show that the increased pilot interval scheme can improve the performance of receiving sensitivity. The improved pilot power scheme compensates for frequency-selective fading by increasing the pilot power in areas where channel conditions are relatively poor. The simulation results show that the increased pilot power scheme can improve the performance of receiving sensitivity.
2 Principle of the proposed pilot optimization system
2.1 Principle of the RSSB system
The principle of the RSSB system is shown in Figure 1. The RSSB system is based on a parallel Mach–Zehnder modulator (P-MZM). The P-MZM includes three sub-modulators: up-road Mach–Zehnder modulator-a, down-road Mach–Zehnder modulator-b, and optical-phase modulator-c. The modulator-a that operates in the linear region modulates the baseband OFDM signal. The optical spectrogram of the baseband signal modulated by modulator-a is shown in Figure 1A. The modulator-b that operates in the non-linear region is driven by electrical radio frequency (RF) to produce optical millimeter waves. When the bias voltage is at the highest point, it can obtain a double-frequency modulation in the optical domain. The optical spectrogram after modulation is shown in Figure 1B. The two optical signals are combined in the modulator-c. Because the baseband data are only modulated to a central optical carrier, no data are carried by the sideband. The system reduces the effect of walk-off in the fiber transmission. Modulator-a operates in the linear regions, and modulator-b operates in the non-linear region, which can meet the different modulation requirements of the baseband signal and optical millimeter wave. Therefore, the data format in the system is compatible. When two optical signals are combined in modulator-c, we can adjust the bias voltage in modulator-c to change the phase offset before the coupling of the two optical signals. As the phase shift is set to π, the DC component of the central optical carrier will be suppressed because of the phase cancelation interference, as shown in Figure 1C. Thus, the modulation power efficiency can be improved. Figure 1C shows that the baseband OFDM is reversely modulated onto a light wave owing to the phase shift of π.
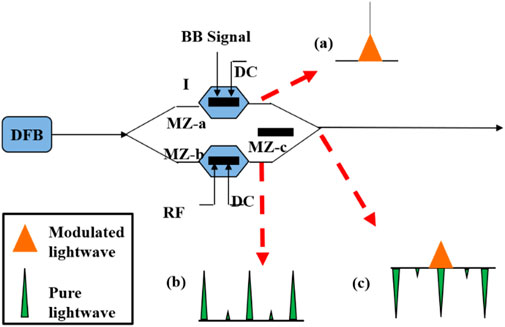
FIGURE 1. Schematic diagram of the RSSB system. (A) Modulated lightwave; (B) Pure lightwave; (C) Combined signal.
2.2 Pilot interval optimization scheme
In the OFDM communication system, some researchers have shown that a pilot distributed in an equal interval can obtain the best performance [19]. In the RSSB-OFDM system, the OFDM signal will be subject to frequency-selective fading and the SSBI during the transmission. Generally, each sub-carrier of the OFDM signal is subject to different intensities of the interference factors. Because the beat interference has a large amplitude near the optical carrier, the sub-carriers at the low frequency are subject to a stronger interference factor. At high frequencies, sub-carriers are subject to strong frequency-selective fading because the electronic devices cannot achieve the ideal spectral characteristics. In addition, the frequency-selective fading factor in optical fiber is directly proportional to the signal frequency. The higher the frequency of the sub-carriers, the more serious the fading, and the greater the power loss.
For the RSSB-OFDM, we can place fewer pilots at high frequency to decrease the loss of the pilots used for channel estimation. It can ensure the accuracy of channel estimation and improve system performance. We set up three pilot interval schemes. First, the equal interval scheme is as follows: keeping the pilot interval constant in the OFDM signal. Second, the increased interval allocation scheme is that the pilot is more distributed in high frequencies. Third, the decreased interval allocation scheme is that the pilot is less distributed in high frequencies. In the three schemes, we keep the total number of inserted pilots the same. We only change the interval distribution.
The three pilot interval schemes shown in Figure 2 are analyzed and simulated. The abscissa axis represents the frequency. The frequency of the intermediate carrier is 0. Frequency increases from the center to both sides. The vertical axis represents the power of the sub-carriers. This graph has three pilot schemes: the equal-interval scheme, the decreased-interval scheme, and the increased-interval scheme, as shown in Figures 2A–C, respectively.
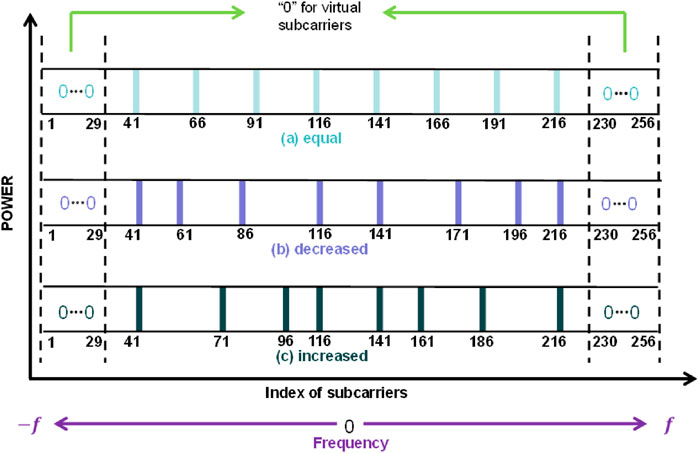
FIGURE 2. Three different pilot interval setting schemes.
2.3 Pilot power optimization scheme
In the communication system, we can increase the power of the transmitted signal to resist interference under difficult channel conditions. For this consideration, the power of each pilot should be distributed reasonably to improve the accuracy of the channel estimation and reduce the bit error rate (BER) of the system.
Because the sub-carriers are subject to serious interference from frequency-selective fading at high frequencies, we can counter channel interference by increasing the power of the pilot information. Three pilot power schemes are set up in this study. In Figure 3, the abscissa axis represents the frequency, and the frequency at the intermediate carrier is 0. Frequency increases from the center to both sides. The vertical axis represents the normalized power of each sub-carrier. This graph has three different pilot power schemes: the equal-power scheme, the decreased power scheme, and the increased power scheme, as shown in Figures 3A–C, respectively.
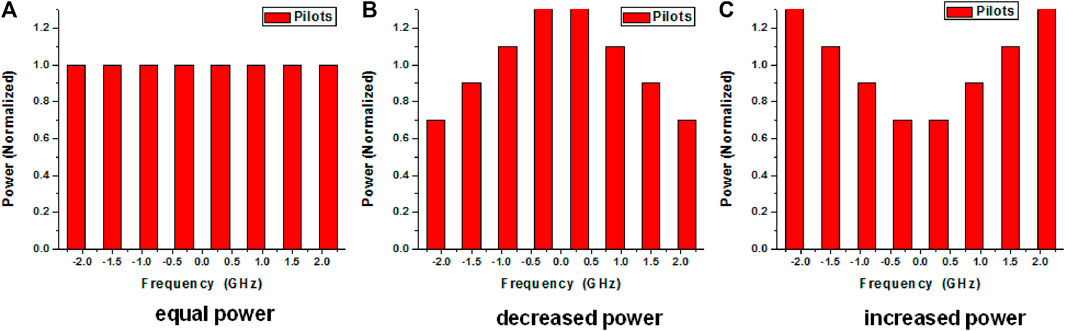
FIGURE 3. Three different pilot power setting schemes. (A) The equal-power scheme; (B) The decreased-power scheme; (C) The increased-power scheme.
3 Simulation design and results
3.1 Pilot interval scheme simulation design and results
We have simulated the pilot-optimized scheme, and the simulation structure diagram is shown in Figure 4. OptiSystem and MATLAB are used for simulation. Digital baseband OFDM signal is generated using MATLAB. First, the sent data are mapped into QPSK, and each OFDM symbol includes 192 data sub-carriers carrying information. Eight pilots with three different pilot interval schemes are inserted for channel estimation. Fifty-six virtual sub-carriers are used as a guard interval, where zeros are inserted. These virtual sub-carriers are at high frequency, as shown in Figure 2. The cyclic prefix used to reduce inter-symbol interference contains 32 sub-carriers. Therefore, each OFDM symbol consists of 288 sub-carriers. The OFDM signal used in this system is called discrete multi-tone (DMT) modulated signal. The generated OFDM signal is a real-valued signal because of the conjugate symmetric signal used in the IFFT operation. Second, the digital QPSK-mapped OFDM signal is converted into an electrical signal using the digital-to-analog converter (DAC) in the transmitter. Then, a lowpass filter (LPF) is used to filter out the higher-order sidebands and noise from the electrical signal. The continuous light wave with a central wavelength of 1,553.60 nm is generated using a laser, of which the power is 13 dB m and the line width is 10 MHz. The optical signal from the laser is divided into I/Q signals through a power splitter. The power-splitting ratio for the two ports is 1:1. The two optical signals out of the power splitter are the same signal, and both have a power of 6.5 dB m. The electrical OFDM baseband signal with a bandwidth of 2.5 GHz is fed into modulator-a operating in the linear region. The 30-GHz RF signal is fed into modulator-b driving by DC offset at the highest point, thus suppressing the odd sidebands. The optical signals from modulator-a and modulator-b are combined in phase modulator-c. The phase offset between two optical signals changed by modulator-c can adjust the energy efficiency of the signal modulation. In all simulation tests, an optical amplifier (OA) is used to amplify the coupled optical signal to maintain the signal power at 0 dB m before entering the standard single-mode fiber (SSMF). The second OA is used to control the received signal so that it has sufficient optical power after the optical fiber transmission. Then, an optical bandpass filter is used for filtering out the extra sideband. The filtered optical signal, containing the central carrier with data and one of the second-order sidebands, is converted into a high-frequency electrical signal using a photodetector (PD). The electrical 60 GHz mm wave with OFDM signal is through an electrical bandpass filter (EBPF). The EBPF has a center frequency of 60 GHz and a bandwidth of 20 GHz, making sure useful signals get through. For each text, the power is amplified to −14 dB m by an electrical amplifier (EA). Then, the 60 GHz millimeter-wave signal and the 60 GHz RF with a power of 4 dB m are mixed for down-conversion in an electric mixer. An LPF with 3 GHz bandwidth is used to filter out the high-frequency noise after down-conversion. The baseband OFDM signal after ADC is further processed in MATLAB to measure the performance of the link. The demodulation steps are shown in Figure 4. The detailed processes are the same for different pilot schemes. We use three indicators to measure the system performance: BER, error vector magnitude (EVM), and Q-factor. EVM represents the approximate degree between the I/Q components generated by the receiver during the demodulation of the signal and the ideal signal components and is an indicator of the quality of the modulated signal. The specific parameters of each device in this system are shown in Table 1.
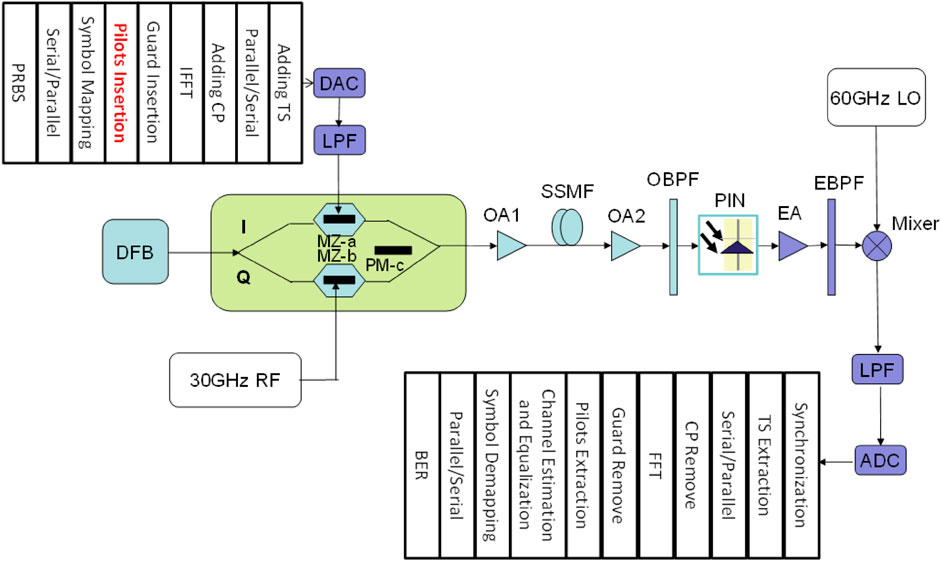
FIGURE 4. Simulation structure diagram of the RSSB-OFDM system with pilot optimization.
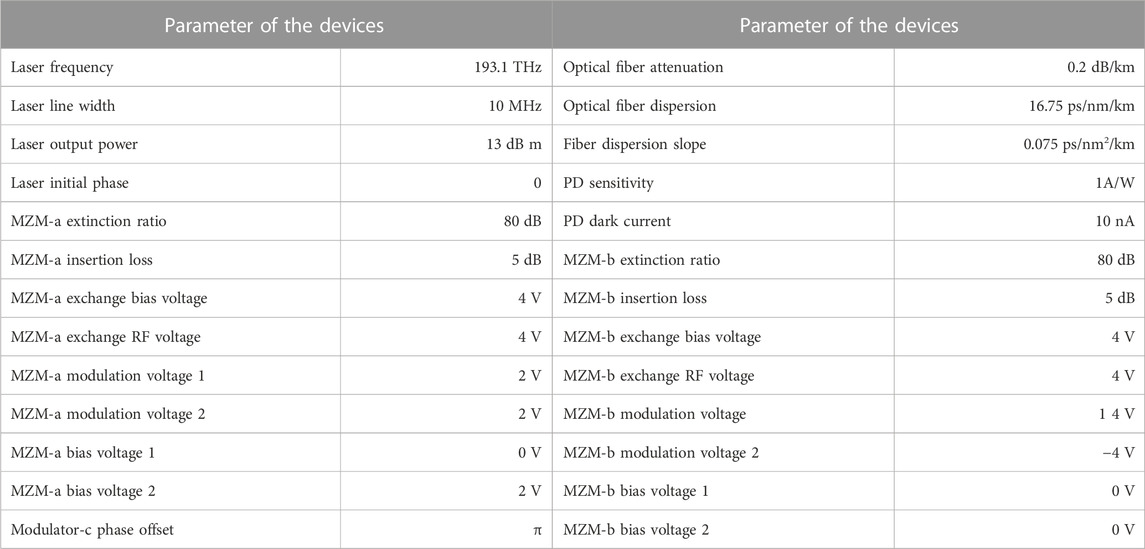
TABLE 1. Parameters of the devices in the simulation.
It is convenient to set the position of the pilot in the OFDM signal when modulating the OFDM digital baseband signal in MATLAB. Figure 5 shows three electrical spectrum diagrams of OFDM signals in different interval setting schemes. The abscissa axis represents the frequency, and the vertical axis represents the power. The equal-interval scheme, the decreased-interval scheme, and the increased-interval scheme are shown in Figures 5A–C, respectively. The larger power amplitude is the pilot information component in each spectrogram. In the three simulation schemes, the power of each pilot information component is equal. The location of the pilots in each scheme can be seen in the spectrogram.
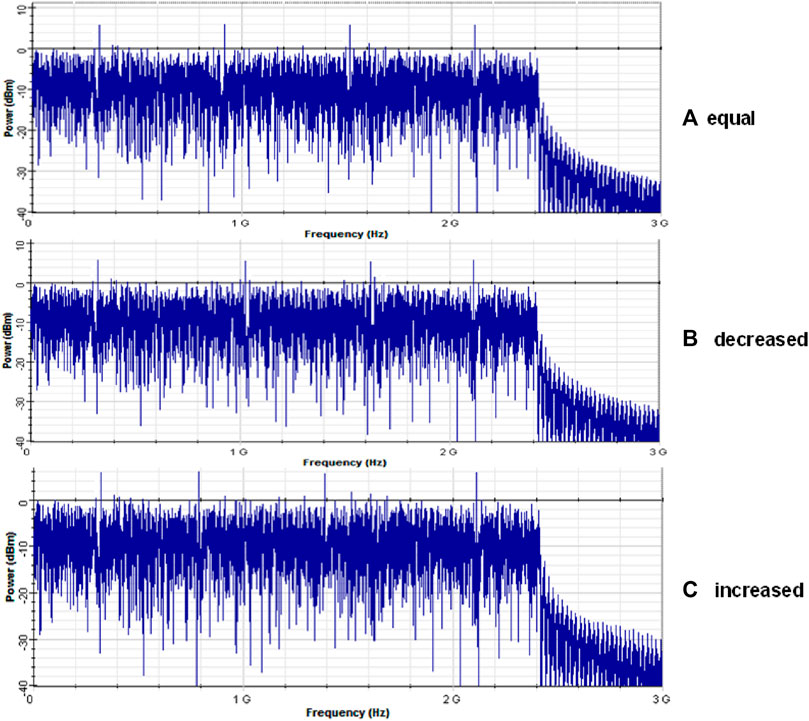
FIGURE 5. OFDM spectrum of different pilot interval schemes in the transmitter. (A) The equal-interval scheme; (B) The decreased-interval scheme; (C) The increased-interval scheme.
Figure 6 represents the BER, EVM, and Q-factor on each sub-carrier in an OFDM symbol after the signal has been delivered 100 km in the fiber. A total of 192 sub-carriers carry data in the OFDM symbol, and these sub-carriers are set to be conjugate symmetric in the frequency domain. Because the channel characteristics of conjugate symmetric parts in the transmission system are the same, only half of the performance is analyzed and displayed. In Figure 6, the more to the right on the abscissa, the higher the frequency. The sub-carrier with a smaller index is at a high frequency, and the sub-carrier with a bigger index is at a lower frequency. The performance of the system with an optical received power of −18, −19, and −20 dB m is shown in Figure 6, respectively. With the decrease of received optical power, the performance of the system will degrade and the error rate on each sub-carrier will increase. In Figure 6, the results of each sub-graph are consistent and in line with the theory previously described. The data sub-carrier is most influenced by frequency-selective fading at high frequency, leading to higher BER and EVM and lower Q-factor. We can see from the graph that the lower frequency has better performance. However, it is evident from the EVM and Q-factor that the trend disappears at the lowest frequency, mainly because the sub-carrier at low frequency is subject to serious interference from the SSBI, which affects the performance.
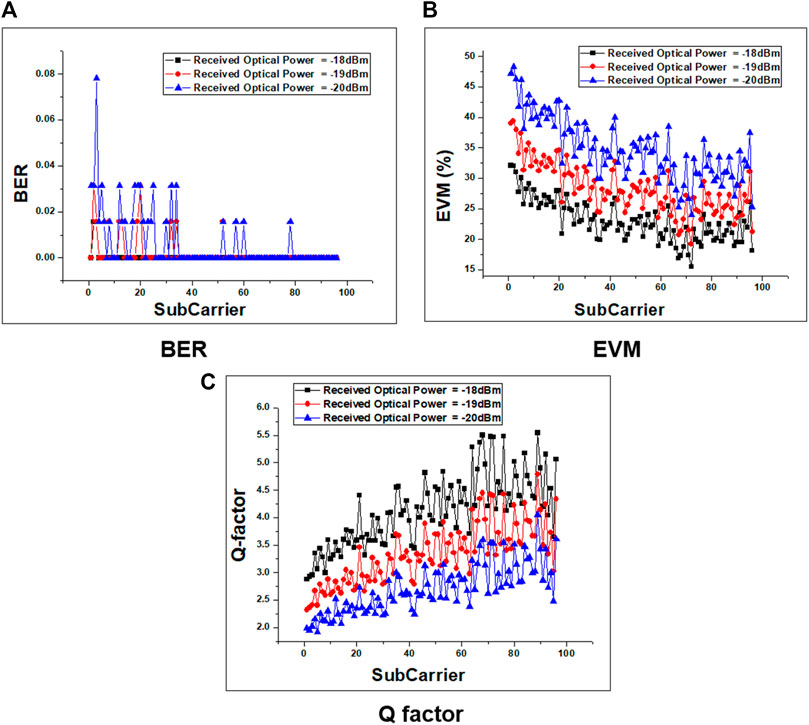
FIGURE 6. BER, EVM, and Q-factor distributions on each data sub-carrier. (A) BER distributions; (B) EVM distributions; (C) Q-factor distributions.
Figures 7A–C represent the BER, EVM, and Q-factor curves versus different received optical power after delivering 100 km SSMF with different pilot interval schemes. The results of the sub-graphs in Figure 7 are consistent and in line with the theory previously described. The RSSB-OFDM are seriously affected by frequency-selective fading. We can reduce pilot data at high frequency and place more pilot data in the area where the channel condition is relatively good at low frequency, which can improve the accuracy of channel estimation with the pilot. The results show that the increased interval scheme provides the best performance among the three schemes and improves the performance by 2-dB receiving sensitivity compared with the worst scheme.
FIGURE 7. BER, EVM, and Q-factor curves under different pilot interval schemes. (A) BER curves; (B) EVM curves; (C) Q-factor curves.
3.2 Pilot power scheme simulation design and results
The simulation system diagram and device parameters of the pilot power scheme are the same as those of the pilot interval scheme, as shown in Figure 4 and Table 1. The parameters of these pilot scheme simulation cases are the same as those in the OptiSystem. Only the methods of the pilot setting are different in MATLAB. When modulating the digital OFDM baseband signal in MATLAB, the equal-interval distribution of the pilot position is fixed, and then the power of the pilot data is set separately. There are three different pilot power setting schemes at the transmitter, as shown in Figure 8. The abscissa axis represents the frequency. The vertical axis represents the power. The equal-power scheme, the decreased-power scheme, and the increased-power scheme are shown in Figures 8A–C, respectively. In the three schemes, we keep the total power of the inserted pilots the same and only change the power distribution. In the pilot increased-power scheme, the power of the high frequency is increased to resist fading, and the power of the low frequency is decreased to ensure the same total power in each simulation. The larger power amplitude is the pilot information component in each spectrogram. We can see the change in the pilot power in each scheme from the spectrogram.
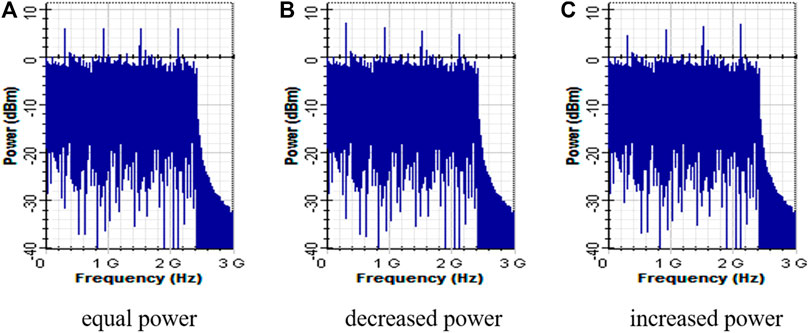
FIGURE 8. OFDM spectrum of different pilot power schemes in the transmitter. (A) The equal-power scheme; (B) The decreased-power scheme; (C) The increased-power scheme.
Figures 9A, B represent the EVM and Q-factor curves versus different received power after delivering 100 km of SSMF with different pilot power schemes. In Figure 9, the results of each sub-graph are consistent and in line with the theory previously described. RSSB-OFDM are seriously affected by frequency-selective fading. We can increase the pilot power at a high frequency, which can improve the ability to resist channel interference and the accuracy of channel estimation with the pilot. Therefore, the increased power scheme provides the best performance among the three schemes and improves the performance by 2-dB receiving sensitivity compared with the worst scheme.
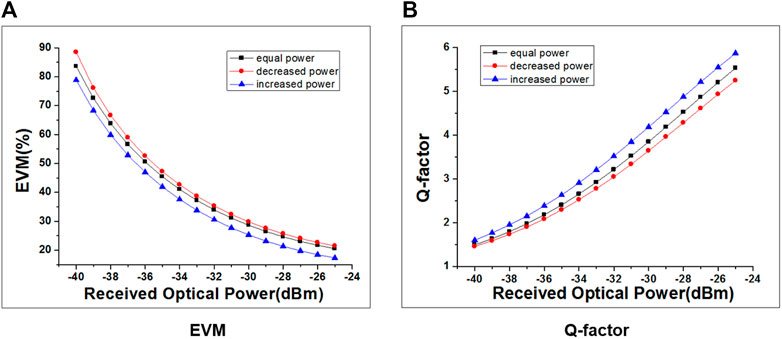
FIGURE 9. EVM and Q-factor curves under different pilot power schemes. (A) EVM curves; (B) Q-factor curves.
4 Conclusion
For the channel characteristics of the RSSB-OFDM, the improved pilot interval scheme and the pilot power scheme are proposed in this study. We built a simulation system to verify the correctness of the theory and the viability of the solution. The improved pilot interval scheme uses the method of placing more pilots in areas where channel conditions are relatively good. The increased interval scheme provides the best performance and improves the performance by 2-dB receiving sensitivity compared with the worst scheme. The improved pilot power scheme uses the method of increasing the pilot power in areas where channel conditions are relatively poor. The increased power scheme provides the best performance and improves the performance by 2-dB receiving sensitivity compared with the worst scheme. These schemes can enhance the system performance without increasing the complexity of the algorithm and the costs of the RSSB system. It is an ideal way to improve the performance of the RSSB system.
Data availability statement
The original contributions presented in the study are included in the article/Supplementary Material; further inquiries can be directed to the corresponding author.
Author contributions
LC contributed to the conception and design of the study. ZY wrote the first draft of the manuscript. QY wrote sections of the manuscript. All authors have read and agreed to the published version of the manuscript.
Funding
This paper is supported by the National Natural Science Foundation of China (Grant No. 61905074); the Scientific Research Fund of Hunan Provincial Education Department (22B0479, 21B0476); the Hunan Provincial Natural Science Foundation of China (Grant No. 2022JJ30264).
Conflict of interest
The authors declare that the research was conducted in the absence of any commercial or financial relationships that could be construed as a potential conflict of interest.
Publisher’s note
All claims expressed in this article are solely those of the authors and do not necessarily represent those of their affiliated organizations or those of the publisher, the editors, and the reviewers. Any product that may be evaluated in this article, or claim that may be made by its manufacturer, is not guaranteed or endorsed by the publisher.
References
1. Zhou H, Fei C, Zeng Y, Tan Y, Chen M. A ROF system based on 18-tuple frequency millimeter wave generation using external modulator and SOA. Opt Fiber Tech (2021) 61:102402. doi:10.1016/j.yofte.2020.102402
2. Jan B, Komanec M, Jan S, Slavik R, Zvanovec S. Transmitters for combined radio over a fiber and outdoor millimeter-wave system at 25 GHz. IEEE Photon J (2020) 12(3):1–14. doi:10.1109/jphot.2020.2997976
3. Vallejo L, Ortega B, Nguyen D-N, Jan B, Almenar V, Zvanovec S. Usability of a 5G fronthaul based on a DML and external modulation for M-QAM transmission over photonically generated 40 GHz, IEEE Access (2020) 8:223730–42. doi:10.1109/access.2020.3042756
4. Chen L, Luo J, Tang Z, Xi Z. Integration system of photon-assisted W-band millimeter wave wireless communication and free space optical communication based on OFDM signal transmission. Opt Fiber Tech (2019) 52:101973. doi:10.1016/j.yofte.2019.101973
5. Bohata J, Komanec M, Spáčil J, Hazdra P, Lonský T, Hradecký Z, et al. Experimental demonstration of a microwave photonic link using an optically phased antenna array for a millimeter wave band. Appl Opt (2021) 60(4):1013. doi:10.1364/ao.414069
6. Jain V, Bhatia R. Analysis of XPM induced crosstalk in radio over fiber system including the effect of higher-order dispersion parameters. Opt Quan Elect (2022) 54(4):264–16. doi:10.1007/s11082-022-03625-8
7. Kurbatska I, Ostrovskis A, Spolitis S, Bobrovs V. Impact of the receiver and transmitter bandwidth on the performance of high-speed OFDM signal in Radio-over-Fiber Communication Systems. In: 2021 13th International Congress on Ultra Modern Telecommunications and Control Systems and Workshops (ICUMT); October 25-27, 2021; Brno, Czech Republic (2021). p. 282–8.
8. Chen L, Liu M, Tang Z. Nonlinear noise compensation in an integration system of fiber-wireless communication and free space optical communication. Adv Condensed Matter Phys (2020) 2020:1–7. doi:10.1155/2020/9605607
9. Deng L, Pang X, Monroy IT, Tang M, Shum P, Liu D. Experimental demonstration of nonlinearity and phase noise tolerant 16-QAMOFDMW-band (75-110GHz) signal over fiber system. J Lightwave Tech (2014) 32(8):1442–8. doi:10.1109/jlt.2014.2307054
10. Wang K, Zhao L, Yu JJ. 200 Gbit/s Photonics-aided MMW PS-OFDM signals transmission at W-band enabled by hybrid time-frequency domain equalization. J Lightwave Tech (2021) 39(10):3137–44. doi:10.1109/JLT.2021.3062387
11. Saha RK. Spectrum allocation and reuse in 5G new radio on licensed and unlicensed millimeter-wave bands in indoor environments. Mobile Inf Syst (2021) 2021:1–21. doi:10.1155/2021/5538820
12. Wang N, Jiao L, Wang P, Li W, Zeng K, "Exploiting beam features for spoofing attack detection in mmWave 60-GHz IEEE 802.11ad networks", IEEE Trans Wireless Commun (2021) 20:3321–35. doi:10.1109/twc.2021.3049160
13. Du K, Mujumdar O, Ozdemir O, Ozturk E, Guvenc I, Sichitiu ML, et al. 60 GHz outdoor propagation measurements and analysis using facebook terragraph radios. In: 2022 IEEE Radio and Wireless Symposium (RWS); 16-19 January 2022; Las Vegas, NV, USA (2022). p. 156–9.
14. Cao Z, Yu J, Chen L, Shu Q, “Reversely modulated optical single sideband scheme and its application in a 60-GHz full duplex ROF system,” IEEE Photon Tech Lett (2012) 24:827–9. doi:10.1109/lpt.2012.2188853
15. Cao Z, Yu J, Li F, Chen L, Shu Q, Tang Q, et al. Energy efficient and transparent platform for optical wireless networks based on reverse modulation. IEEE J Selected Areas Commun (2013) 31(12):804–14. doi:10.1109/jsac.2013.sup2.12130013
16. Chen L, He ZW, Zhao L, Zhong B. 60 GHz reverse modulation fiber-wireless system with two jointed DSP algorithms, Adv Condensed Matter Phys (2018) 2018:1–6. doi:10.1155/2018/7256162
17. Mao MZ, Giddings RP, Cao BY, Xu YT, Wang M, Tang JM. DSP-enabled reconfigurable and transparent spectral converters for converging optical and mobile fronthaul/backhaul networks. Opt Express (2017) 25:13836–56. doi:10.1364/oe.25.013836
18. Bhatia R, Prakash S, Saini E. Performance improvement of 60-GHz wireless optical systems with reverse-parallel hybrid modulation scheme. Int J Commun Syst (2019) 32(2):e3848. doi:10.1002/dac.3848
Keywords: radio-over-fiber, reversely single-sideband, OFDM, pilot interval, pilot power
Citation: Chen L, Yang Z and Yu Q (2023) Pilot optimization for OFDM in the RSSB system. Front. Phys. 11:1146173. doi: 10.3389/fphy.2023.1146173
Received: 17 January 2023; Accepted: 20 February 2023;
Published: 08 March 2023.
Edited by:
Fei Yu, Changsha University of Science and Technology, ChinaCopyright © 2023 Chen, Yang and Yu. This is an open-access article distributed under the terms of the Creative Commons Attribution License (CC BY). The use, distribution or reproduction in other forums is permitted, provided the original author(s) and the copyright owner(s) are credited and that the original publication in this journal is cited, in accordance with accepted academic practice. No use, distribution or reproduction is permitted which does not comply with these terms.
*Correspondence: Long Chen, MTA0MDEyMkBobnVzdC5lZHUuY24=