 Xuan Peng
 Zhaohui Wang
94% of researchers rate our articles as excellent or good
Learn more about the work of our research integrity team to safeguard the quality of each article we publish.
Find out more
ORIGINAL RESEARCH article
Front. Phys., 13 March 2023
Sec. Statistical and Computational Physics
Volume 11 - 2023 | https://doi.org/10.3389/fphy.2023.1143477
This article is part of the Research TopicMoving Boundary Problems in Multi-physics Coupling ProcessesView all 16 articles
Hot-airflow desiccation is a commonly applied technique for drying lithium-ion batteries. However, most drying cabinet designs currently suffer from poor efficiency because they evacuate steam by ejecting the hot air in the cabinet to the open air continuously. This can be addressed by closing and opening the cabinet periodically, where the temperature of the heating zone is increased as quickly as possible through internal air recirculation in the closed position, and the steam is ejected with the hot air only during the open period. Nonetheless, drying cabinet designs of this nature have been rarely subjected to numerical analysis based on computational fluid dynamics and heat transfer, and the design factors enhancing the rate of temperature increase during the closed period remain poorly understood. The present work addresses these issues by outlining a detailed numerical approach for simulating the airflow temperature of a drying cabinet during internal air recirculation in its closed position, and the characteristics of the airflow and the temperature distribution in the dryer are evaluated via transient fluid–thermal coupling analysis. The results of the numerical investigation indicate that the heating efficiency is substantially influenced by the inlet airflow velocity, the distance between the trays holding the batteries, and the size of the free space between the front door and the trays. The results demonstrate that the developed model provides a useful means of evaluating and optimizing the heating efficiency of these types of drying cabinets.
The drying process is a crucial component in the manufacture of lithium-ion batteries, and hot-airflow desiccation is very commonly applied for this purpose. However, an optimal hot-airflow drying cabinet design is crucial for maximizing drying efficiency and minimizing energy use, which are essential considerations in industrial manufacturing operations. Nonetheless, this issue is seriously complicated by the fact that optimal drying cabinet design varies significantly according to the material to be heated or dried.
The process of optimizing the designs of all types of drying cabinets has been substantially streamlined by applying numerical analysis based on computational fluid dynamics (CFD) and heat transfer because these tools provide a powerful and economic method for evaluating the airflow and temperature distributions in the dryer. Accordingly, a great number of studies have been devoted to constructing CFD models for the thermal devices used in manufacturing, food, and pharmaceutical engineering fields. For example, Amanlou and Zomorodian [1] studied the impact of geometrical shapes on the drying capabilities of drying cabinets. Park et al. [2] demonstrated that the direction and location of the hot air injection have a significant influence on the thermal field in a gas oven cavity. Wang et al. [3] optimized the design of a room for drying American ginseng based on numerically modeled airflow and heat transfer characteristics, and the results demonstrated that inhomogeneity in the airflow and temperature distributions are mainly influenced by the inlet airflow rate, inlet diameter, and number of partition boards employed in the drying room. Moreover, the results indicated that the drying process is highly affected by the convective heat transfer characteristics of the room, which can be adjusted by varying its structural parameters and the inlet airflow rate.
Analogous results to those discussed previously can be found in a number of studies involving cooling devices [4–7]. In addition to convective heat transfer, the role of radiative heat transfer in the airflow and temperature distributions of ovens and drying devices has also been investigated numerically. For example, Kokolj et al. [8] adopted a Monte Carlo-based radiation model that enabled numerical evaluations of the baking performance of a forced convection oven, and a linear relationship was established between the oven temperature and the level of bread browning. Román-Roldán et al. [9] modeled radiative heat transfer using the discrete ordinate method in a mixed greenhouse food dryer, where solar energy served as the heat source, and the impact of various design features on the airflow and wall temperature distributions were analyzed. However, the time dependence of the wall temperature was not verified. Rek et al. [10] again modeled radiative heat transfer based on the discrete ordinate method to investigate the impacts of various structural features on the airflow and temperature distributions in a new-generation heating oven. The results indicated that the oven temperature had an insignificant effect on the radiative heat transfer in the oven because the temperature was relatively low.
A further complication arises in the modeling of ovens and drying devices because water is vaporized from the material in the heating process and enters the hot airflow, which forms a coupled thermal and moisture diffusion phenomenon that must be included in numerical models. These considerations are further crucial because the moisture content in food is of critical concern in food engineering applications. For example, Lemus-Mondaca et al. [11] coupled thermal and mass transfer phenomena in the drying process of olive waste cake using a temperature-dependent latent heat of vaporization and the effective diffusivity of moisture defined by an Arrhenius-type equation, where modeling was conducted in conjunction with the finite volume method. Nasser et al. [12] considered water evaporation and condensation in the bread baking process using a multi-flow fluid model. Specific to lithium-ion battery desiccation, Zhao et al. [13] calculated an effective diffusion coefficient for water vapor by means of Fick’s equation and an Arrhenius-type equation when analyzing the vacuum drying kinetics of a lithium cathode material through empirical models related to the moisture and drying rate. However, the characteristics of drying for the cathode material differ from those of the battery core. The drying process specific to the cores of lithium-ion batteries was investigated by Jiang et al. [14], where a high-temperature environment was generated within a cylindrical vacuum oven by injecting hot nitrogen gas. Both radiative and conductive heat transfer inside the battery core were analyzed in detail via CFD simulations.
However, most reported drying cabinets reported in the literature suffer from poor efficiency because they evacuate the steam by ejecting the hot air in the cabinet to the open air continuously. This issue is addressed by periodically closing and opening the cabinet, where the temperature of the heating zone is increased as quickly as possible through internal air recirculation in the closed position, and the steam is ejected with the hot air only during the open period. However, relatively few studies have evaluated the thermal and airflow characteristics for these types of drying cabinets. Moreover, most of the few existing studies have focused on improving the homogeneity of the airflow and temperature in the steady state, while the factors influencing the rate of temperature increase in the closed position remain poorly understood.
The present work addresses these issues for lithium-ion battery desiccation by outlining a detailed numerical approach for simulating the airflow temperature of a drying cabinet during internal air recirculation in its closed position, and the characteristics of the airflow and temperature distributions in the drying cabinet are evaluated via thermal–mass transfer coupling analysis. Moreover, an analysis of the homogeneity in the airflow and temperature distributions is important to ensure that the batteries can be heated uniformly. The ultimate goal of the present work is to obtain a maximum possible rate of temperature increase in the drying cabinet during its closed period because this rate of temperature increase plays a crucial role in improving the drying efficiency of the cabinet. To this end, we explore several structural factors affecting the rate of temperature increase in the drying cabinet in an effort to obtain the optimal parameters.
The remainder of this paper is organized as follows. The physical and CFD models and simulation settings are presented in Section 2, where the geometrical structure of the drying cabinet is first outlined, and the governing equations involved in the fluid–thermal coupling analysis are reviewed. In addition, the process of simplifying the batteries as a porous medium and the simplified treatment of the fan inlets are presented in detail. Section 3 presents the numerical results based on CFD and thermal simulations, where the characteristics of the airflow and temperature distributions in the drying cabinet are first analyzed. Then, the structural factors influencing the rate of temperature increase in the cabinet and the homogeneity in the airflow and temperature distributions are explored, and the optimized combination of parameters is adopted for simulation. Finally, Section 4 summarizes the conclusions of the study and suggests topics for future study.
A physical model of the drying cabinet investigated herein is presented in Figure 1A. As can be seen, the cabinet is mainly composed of fans, thin porous plates, cylindrical batteries stacked on trays, and a front door for loading and unloading. The regions of the drying chamber surrounding the porous plates represent spaces of free airflow, and the airflow is directly heated by electric coils. The porous plates then permit the warm air access to the batteries for drying when air is drawn from the internal space of the drying cabinet and blown into the airflow space by the fans. The four trays and battery configurations are illustrated in Figure 1B, which also presents a properly simplified drying cabinet structure for CFD analysis. The trays include holes with diameters d = 18 mm evenly spaced about the batteries at 53 mm intervals to improve airflow. The overall size of the cabinet is of 1,300 mm × 1,500 mm × 565 mm. The height and diameter of the lithium ion batteries are 89 mm and 46 mm, respectively.
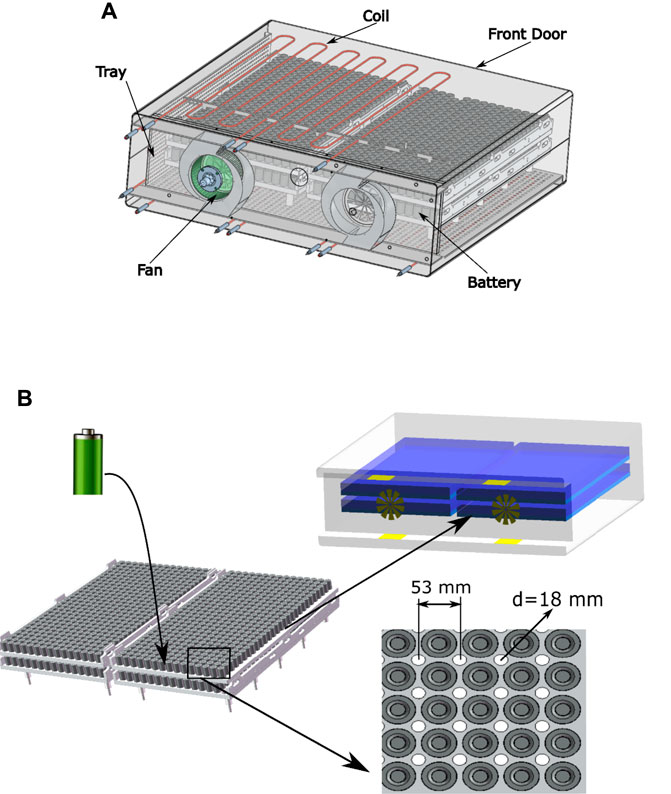
FIGURE 1. Illustrations of the drying cabinet investigated in the present work: (A) physical model that is mainly composed of fans, heating coils, porous plates, cylindrical batteries stacked on trays, and a front door for loading and unloading; (B) simplified model applied for CFD analysis.
All simulations were conducted using the commercial CFD software package Ansys Fluent. The governing equations employed for a compressible Newtonian fluid include the continuum equation and the momentum equations in the x, y, and z directions, which can be specified, respectively, as follows:
where t is the time,
Ignoring the viscous dissipation effect, the energy equation can be written as
where
Direct modeling of the batteries residing in the trays to be dried is quite challenging because of the complexity of the geometry due to the great number of batteries involved, which imposes a substantial burden when applying the computational mesh to the system. However, this issue can be largely resolved by modeling the batteries loaded on the trays as a porous medium with a porosity that is easily calculated based on their alignment (Figure 1B). In addition, the porous plates separating the airflow channels and the internal space of the drying cabinet can be treated analogously as porous boundaries. Simplifications based on porous media have been widely used in CFD simulations applied in the food engineering field [15–17].
The resistance to airflow induced by a porous medium is accounted for as an additional source term S in the momentum equations, which is defined according to viscous and inertial components as follows:
where uj is the velocity in the j-th direction and |u| is the magnitude of the velocity inside the porous medium.
where
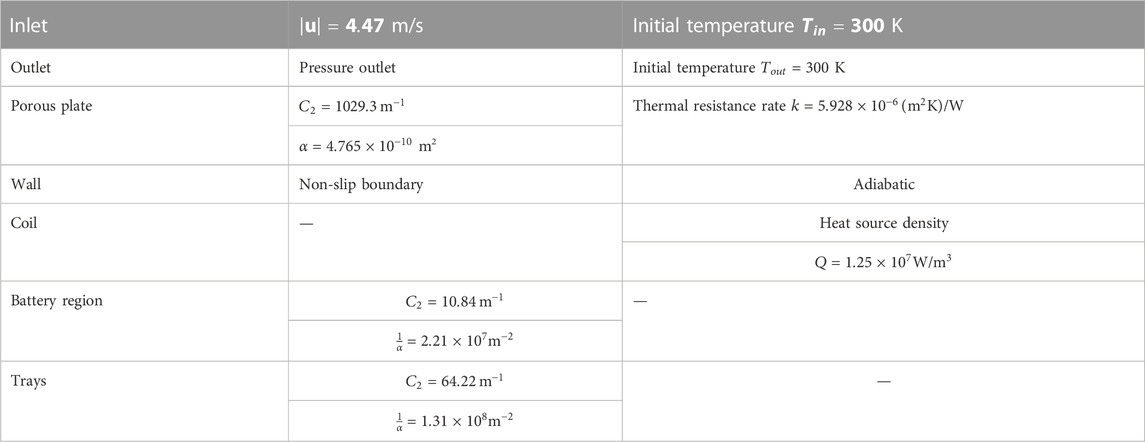
TABLE 1. Parameters obtained experimentally for boundary conditions.
The regions associated with boundary conditions or load conditions are defined herein according to the simplified CFD model presented in Figure 2. Hexahedral-dominant meshing elements were used to discretize the computational domain. The process of determining the boundary conditions was simplified by applying the following assumptions:
1) The influence of the wall on the heat transfer of air in the exterior zone is ignored
2) The wall thickness is uniform
3) No chemical reactions occur on the battery surfaces during the heating process
4) Heat variations in the airflow due to fan rotation are ignored
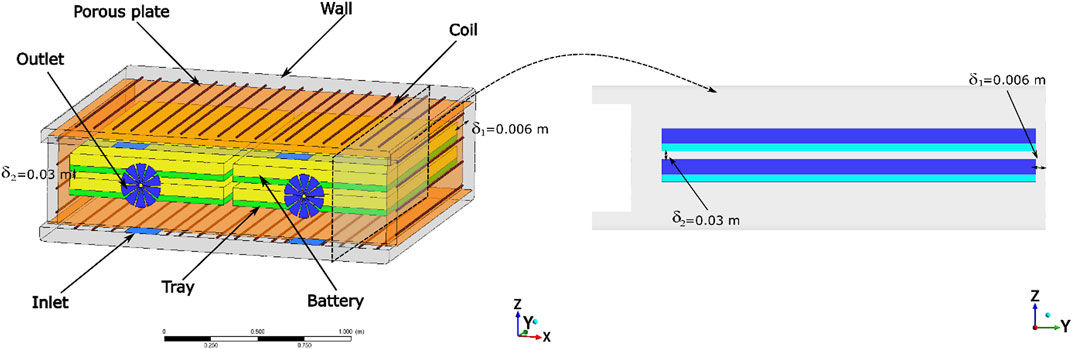
FIGURE 2. Illustration of the boundary condition or load condition applied in the model.
The model is further simplified by removing the fans and applying only two inlets and four outlets. An airflow velocity boundary is set for the inlets based on the actual flow rate of the fan, and the outlets are set as pressure outlet boundaries. Moreover, the temperature of the air at the inlets and outlets remains constant during the computations because the total thermal energy does not change when the air flows through the fan zones. This is realized by modifying the user-defined function (UDF) in Fluent. The boundary and load conditions applied in the simulations are listed in Table 1. Meanwhile, the operating pressure of the drying cabinet was set at 80 kPa.
The Semi-Implicit Method for Pressure-Linked Equations (SIMPLE) algorithm was used to solve the continuum and momentum equations. A second-order upwind scheme was applied for differentiation of the convective term. The divergence theorem was applied for the pressure gradient source term and diffusion term with quadratic precision discretization applied for the surfaces of the control volume. The convergence criterion of the error norm for the continuum and momentum equations was set at
As discussed, the ultimate goal of the present work is to determine the structural design parameters that provide a maximum possible rate of temperature increase in the battery region of the drying cabinet during its closed period. This can be determined based on the temperature history curve obtained for the battery region during simulations. However, the temperature is not uniform throughout the battery region. The present work addresses this inconsistency by applying temperature history curves based on the position in the battery region with the lowest temperature. However, this position is not being fixed for all configurations. Therefore, we employ a Fluent UDF to locate this position during each simulation.
We first conducted a grid dependence study to determine the optimal grid density. To this end, we compared the temperature history curves obtained with 20 iterations applied for each 1 s time step under discretization schemes with 650,000, 850,000, and 1,600,000 meshing elements, and the results are given in Figure 3 with respect to 2,400 time steps in 1 s intervals. As can be seen, the lowest temperature position in the battery region increases exponentially, where the temperature increases slowly at the beginning and then rapidly after 800 s of heating. We further note that the different meshing schemes produce very little difference among the obtained temperature history. Therefore, 850,000 meshing elements were uniformly applied in all subsequent simulations, and 20 iterations were applied for each 1 s time step.
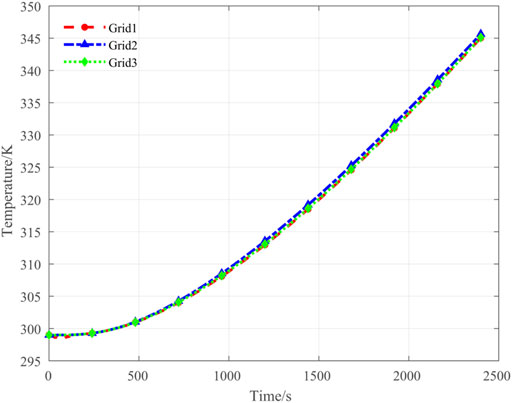
FIGURE 3. Temperature history curves obtained under model discretization schemes with 650,000 (Grid 1), 850,000 (Grid 2), and 1,600,000 (Grid 3) meshing elements for evaluating grid dependence.
A uniform discussion of results was ensured by restricting analysis to specific planes in the numerical model (Figure 2) and at specific points within those planes. As illustrated in Figure 4, Plane 1 resides in the yz plane at x = 0.45 m and includes a cross section of the battery region, two inlets, and an outlet, Plane 2 resides in the xy plane between the lower and upper battery regions at z = −0.278 m, and Plane 3 also resides in the xy plane near the lower battery region at z = −0.3 m. In addition, the position of sample Point 2 on Plane 1 is shown in the top left corner of the figure, while the positions of sample Points 1 and 3 and Line 1 on Plane 2 are clearly defined in the bottom left corner of the figure.
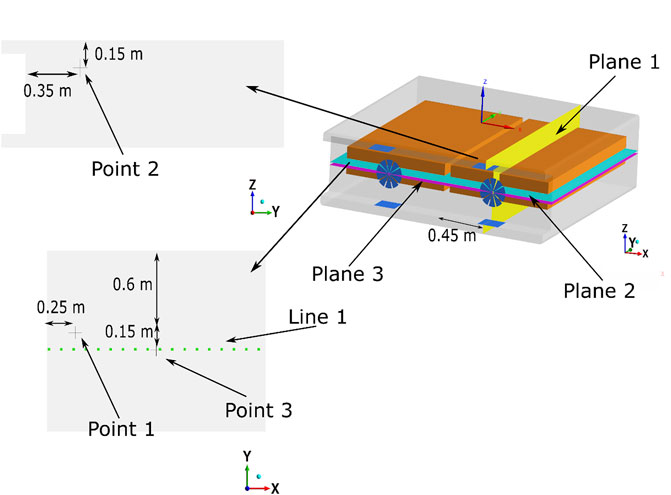
FIGURE 4. Sampling positions applied in the numerical experiments.
The instantaneous airflow velocity streamlines of the entire model in its basic configuration at a simulation time of 2,400 s is presented in Figure 5. As can be seen, high-velocity regions exist near the top and bottom wind channels close to the inlets, and a maximum velocity of 7.8 m/s is obtained. The velocity decreases substantially near the front door and when passing through the battery region under the resistance generated by the porous medium. Meanwhile, the velocity recovers near the outlets.
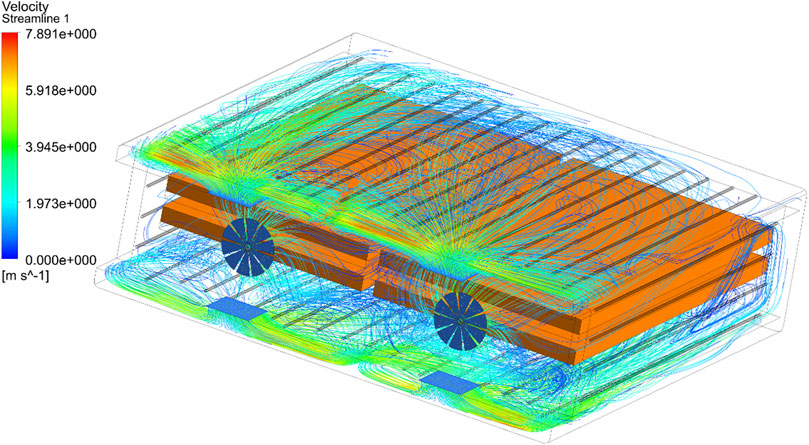
FIGURE 5. Instantaneous airflow velocity streamlines of the model at a simulation time of 2,400 s.
This behavior in the airflow is further illustrated by the instantaneous velocity vectors and the velocity contour of components
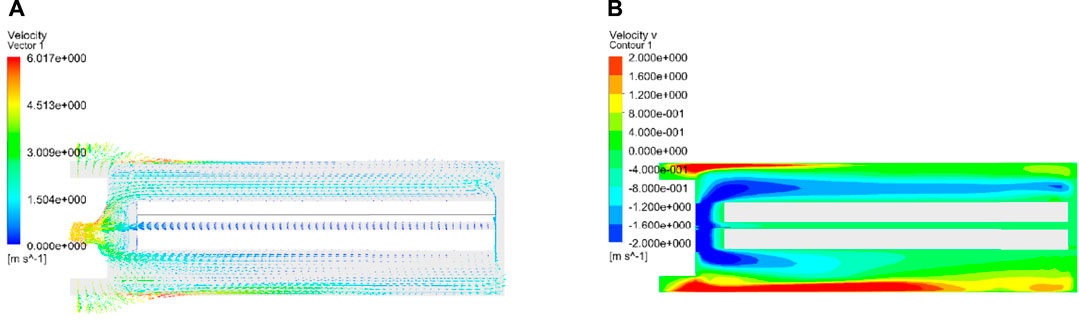
FIGURE 6. Instantaneous velocity vector field (A) and velocity contour plot of the
The history curves of
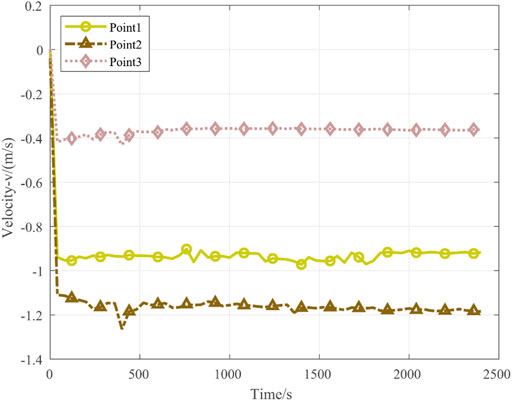
FIGURE 7. History of
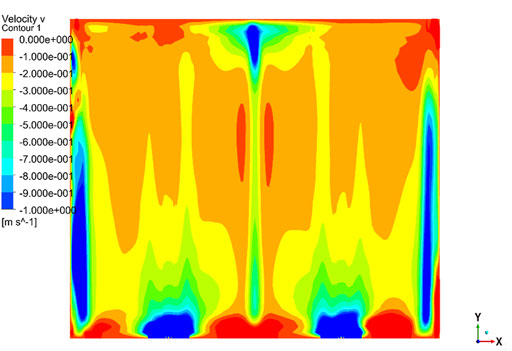
FIGURE 8. Instantaneous contour plot of
The instantaneous temperature distribution of Plane 1 is presented in Figure 9. As can be observed, the temperature decreases gradually from the exterior to the interior zone, and the region of the upper battery tray is warmer than the region of the lower battery tray, while the central area of the lower battery tray at the top is the coolest zone. We expect that the temperature in this lowest-temperature zone can be further decreased by optimizing the cabinet structure.
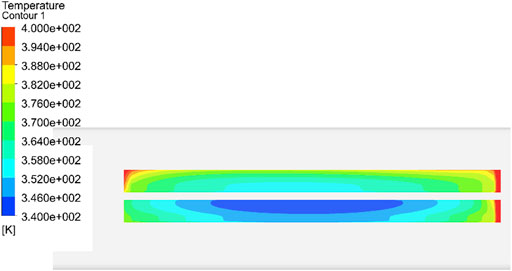
FIGURE 9. Instantaneous temperature distribution of Plane 1 at 2,400 s.
The instantaneous temperature distribution of Plane 3 at 2,400 s is presented in Figure 10. We note that the temperature of this region between the battery trays decreases from the exterior to the interior zone, but the distribution is not symmetric as was observed directly between the battery trays for Plate 2. At this lower point between the battery trays, the temperature distributed over the right-hand side is less compared to that distributed over the left-hand side, and the maximum temperature difference was 70 K on this plane. The asymmetric temperature distribution is observed on the upper part of the battery region. This is because of the asymmetric airflow caused by the skewed inlet, as shown in Figure 1.
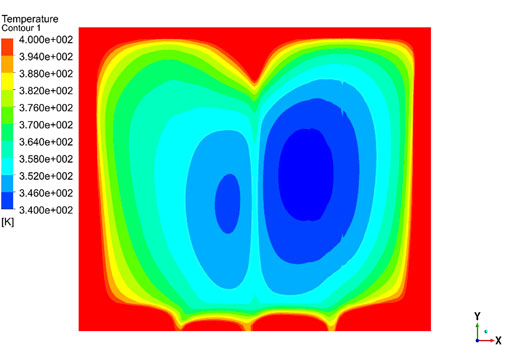
FIGURE 10. Instantaneous temperature distribution of Plane 3 at 2,400 s.
The aforementioned discussion has demonstrated that the central area at the top of the batteries in the lower battery tray is the coolest zone, while the airflow velocity in the space between the batteries in the upper and lower battery trays is relatively low. This indicates that a relatively low rate of heat convection results in the relatively low rate of temperature increase in the drying cabinet. Moreover, the inlet airflow velocity has been a common subject of investigation [3, 4, 6], while other studies have demonstrated that the efficiency of convective heat transfer in, for example, solar-based drying devices can be improved effectively by selecting a suitable inlet airflow velocity [19, 20]. In addition, the aforementioned results demonstrated that the airflow velocity is low in the free space between the front door and the battery region. Therefore, the distance between the front door and the battery region can be expected to have a substantial effect on the rate of temperature increase in the drying cabinet. Finally, the aforementioned results demonstrated that the airflow velocity is relatively low between the batteries in the upper and lower battery trays. Therefore, the distance between the upper and lower battery trays also can be expected to have a substantial effect on the rate of temperature increase in the drying cabinet because the lowest temperature is observed near this zone. Accordingly, the structural factors investigated in an effort to maximize the rate of temperature increase in the drying cabinet include the airflow velocity at the inlet, the free space between the front door and the battery region, and the distance between the upper and lower battery trays. Here, each of these parameters is varied in the simulations with the values of the other two parameters held at the standard values applied in the basic configuration. The exception to this is that a value of
The influence of inlet airflow velocity was evaluated by comparing the lowest temperatures in the battery region observed instantaneously at 2,400 s when simulating the battery drying process with |u| values of 3.5, 4, 4.47, 5, and 5.5 m/s. The lowest temperatures are plotted in Figure 11 as a function of |u|. As can be seen, the lowest temperature increases monotonically with increasing |u|. Nevertheless, we did not consider |u| values greater than 5.5 m/s, owing to limitations in fan power. We later consider the impact of inlet airflow velocity together with changes in the other parameters.
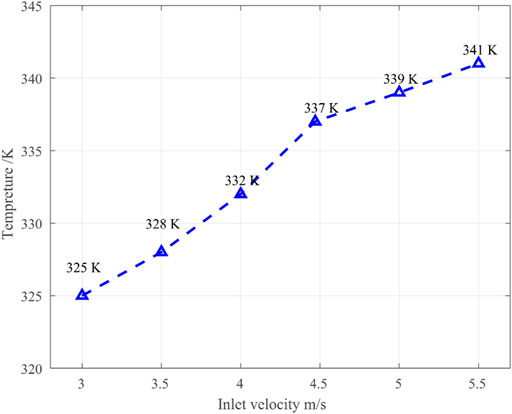
FIGURE 11. Lowest instantaneous temperature observed in the battery region at 2,400 s as a function of the magnitude of the inlet airflow velocity.
The effect of the distance δ1 between the front door and the battery region on the lowest temperature in the drying cabinet is presented in Figure 12 as a function of simulation time. As can be seen, the temperature at the lowest-temperature position increases at an increasing rate as the value of δ1 increases. The rationale for this behavior can be determined according to the instantaneous airflow velocity streamlines obtained at 2,400 s for δ1 values of 0.06 and 0.113 m, which are presented in Figures 13A, B, respectively. Accordingly, we can surmise that the free space close to the front door helps to gather the airflow and drive the airflow through the gap between the upper and lower battery trays. Hence, the convective heat transfer increases with increasing δ1. However, the benefit of increasing δ1 incurs an obvious penalty because the proportion of the available space that can be loaded with batteries decreases with increasing δ1, which detracts from the efficiency of the drying cabinet in a different way. Fortunately, we further note from Figure 12 that the change in the rate of temperature increase is relatively large when
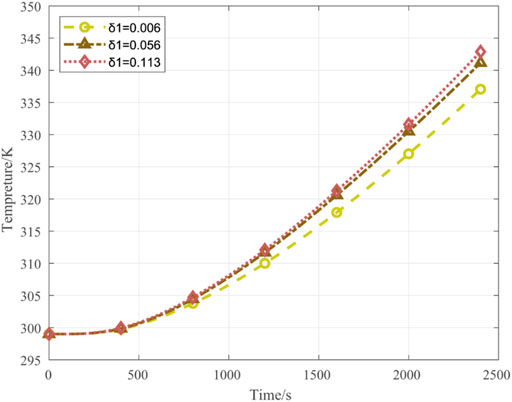
FIGURE 12. Effect of the distance δ1 between the front door and the battery region on the lowest temperature in the drying cabinet as a function of simulation time.
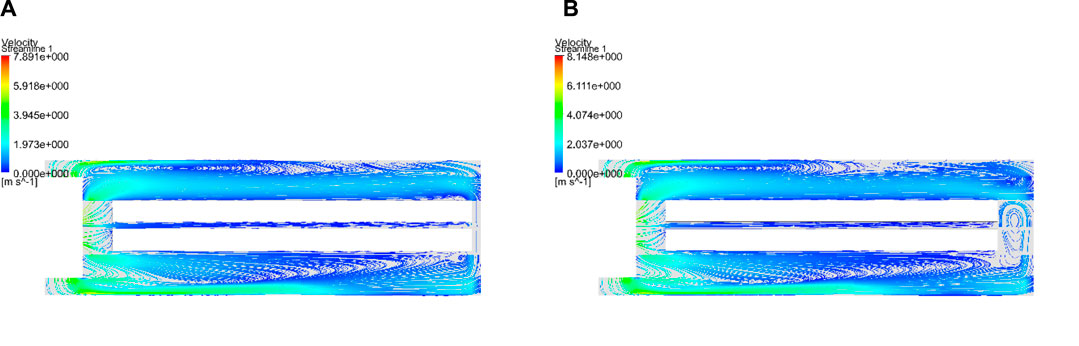
FIGURE 13. Instantaneous airflow velocity streamlines at 2,400 s for different values of δ1: (A) δ1 = 0.06 m and (B) δ1 = 0.113 m.
The effect of the distance δ2 on the lowest temperature in the drying cabinet battery regions is presented in Figure 14 as a function of simulation time. Clearly, the rate with which the temperature increases improves greatly with increasing δ2. However, the benefit of this dimension is once again limited due to the restriction on the size of the drying cabinet.
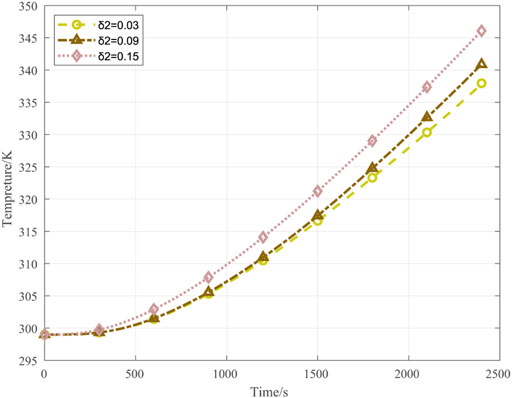
FIGURE 14. Effect of the distance δ2 between the top of the batteries in the lower tray and the bottom of the upper tray on the lowest temperature in the drying cabinet as a function of simulation time.
The aforementioned results demonstrate that changes in the value of a single parameter can indeed improve the heat transfer efficiency of the drying cabinet. However, the combined effects of inlet airflow velocity, δ1, and δ2 remain unexamined. This is addressed by plotting the lowest instantaneous temperature observed in the battery region at 2,400 s as a function of δ2 for different values of inlet airflow velocity and δ1 in Figure 15. As can be seen, an inlet airflow velocity of 5.5 m/s and δ1 = 0.113 m yield maximum instantaneous temperatures for all values of δ2 considered. Accordingly, we selected the parameter values of 5.5 m/s for the inlet airflow velocity,
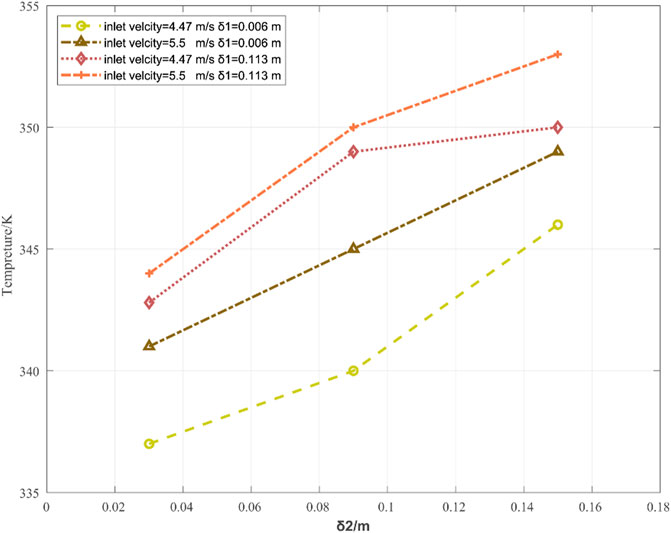
FIGURE 15. Lowest instantaneous temperature observed in the battery region at 2,400 s as a function of δ2 for different values of the inlet airflow velocity and δ1.
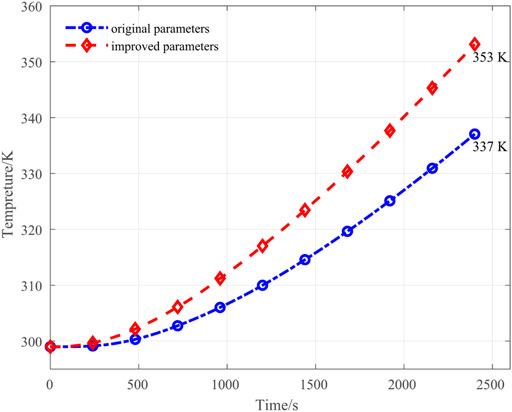
FIGURE 16. Lowest temperature in the drying cabinet for the basic configuration and optimized configuration as a function of simulation time.
The benefits of the optimal parameters are further evaluated based on the instantaneous velocity vector field and velocity streamline plot obtained at 2,400 s for the optimized configuration, which are, respectively, presented in Figures 17A, B. The comparison between Figure 17B and Figure 6 indicates that the density of streamlines between the upper and lower battery trays increases after optimizing the configuration. This indicates that the airflow in the gap zone is faster than that observed for the basic configuration. Moreover, the absolute value of
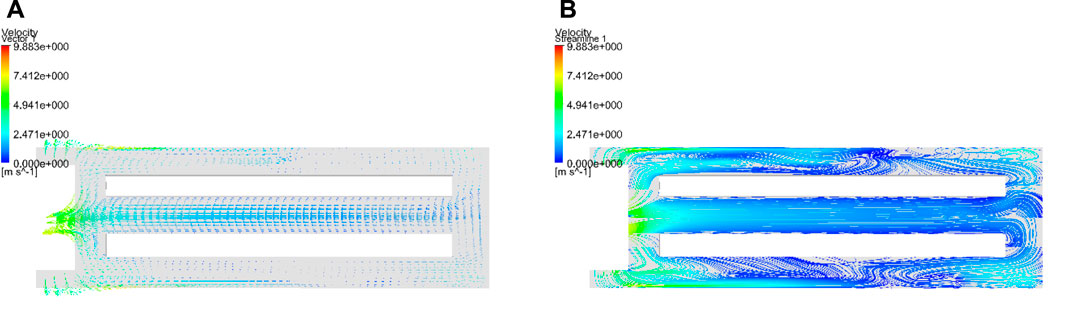
FIGURE 17. Instantaneous velocity vector field (A) and velocity streamline plot (B) obtained at 2,400 s for the optimized configuration.
The present work addressed the poorly understood effect of the parameter values of periodically opening and closing drying cabinets on their drying efficiency by outlining a numerical approach for simulating the airflow temperature in the drying cabinet in its closed position and then evaluating the characteristics of the airflow and temperature distributions in the drying cabinet via thermal–mass transfer coupling analysis. The main contribution of this work can be stated as follows:
1) The simulation process was simplified by modeling the fan zone as inlet/outlet boundaries, and a UDF was applied to maintain equivalent temperatures at these boundaries during each iteration of the process to obtain a consistent heating process without directly modeling the fans.
2) Rather than applying the homogeneity of the temperature distribution in the steady state as a measure of the heating efficiency, this was evaluated in the present work based on the history of the lowest temperature in the battery region over a specified heating period. This criterion represents a direct measurement of the heating rate of the drying cabinet.
3) The heat efficiency of the cabinet depends on the uniformity of the temperature in the battery region, which is highly influenced by convective heat transfer. Therefore, we evaluated the temperature history at the position with the lowest temperature in the battery region near the gap between the upper and lower trays. Meanwhile, the velocity of the airflow through the gap was low.
4) The numerical results demonstrated that increasing the inlet velocity, the distance between upper and lower battery trays, and the distance between the front door and the battery region collaboratively generates better airflow conditions. Compared to the basic configuration, the optimized configuration increased the lowest temperature in the battery region by 13 K after heating for 40 min.
Accordingly, the results presented demonstrate that the developed model provides a useful means of evaluating and optimizing the heating efficiency of these types of drying cabinets. Future work will focus on developing a more intelligent approach for obtaining optimal cabinet design parameters with the help of advanced optimization methods, such as particle swarm methods. Machine learning can be also incorporated to improve the efficiency of the numerical model.
The original contributions presented in the study are included in the article/Supplementary Material; further inquiries can be directed to the corresponding author.
XP, ZW, YY, and GS contributed to the conception and design of the study. ZW organized the database. XP performed the statistical analysis. ZW wrote the first draft of the manuscript, while XP, GS, YY, and ZW wrote specific sections of the manuscript. All authors contributed to the manuscript revision and reading processes and approved the final submitted version.
The supply of data related to the geometry of the drying cabinet and operation by Wujiang Jingling ® drying-oven manufacturers is gratefully acknowledged.
The authors declare that the research was conducted in the absence of any commercial or financial relationships that could be construed as a potential conflict of interest.
All claims expressed in this article are solely those of the authors and do not necessarily represent those of their affiliated organizations, or those of the publisher, the editors, and the reviewers. Any product that may be evaluated in this article, or claim that may be made by its manufacturer, is not guaranteed or endorsed by the publisher.
1. Amanlou Y, Zomorodian A. Applying CFD for designing a new fruit cabinet dryer. J Food Eng (2010) 101:8–15. doi:10.1016/j.jfoodeng.2010.06.001
2. Park SH, Kim YH, Kim YS, Park YG, Ha MY. Numerical study on the effect of different hole locations in the fan case on the thermal performance inside a gas oven range. Appl Therm Eng (2018) 137:123–33. doi:10.1016/j.applthermaleng.2018.03.087
3. Wang P, Liu G, Ao S, Sun D, Yu B, Wu X. Numerical investigation of airflow and heat transfer characteristics and optimal design of the American ginseng drying room. Appl Therm Eng (2021) 183:115885. doi:10.1016/j.applthermaleng.2020.115885
4. Wang G-B, Zhang X-R. Enhanced airflow by additional axial fans for produce cooling in a cold room: A numerical study on the trade-off between cooling performance and irreversibility. Int J Refrigeration (2021) 130:452–65. doi:10.1016/j.ijrefrig.2021.06.030
5. Saw LH, Ye Y, Tay AAO, Chong WT, Kuan SH, Yew MC. Computational fluid dynamic and thermal analysis of Lithium-ion battery pack with air cooling. Appl Energ (2016) 177:783–92. doi:10.1016/j.apenergy.2016.05.122
6. Chauhan A, Trembley J, Wrobel LC, Jouhara H. Experimental and CFD validation of the thermal performance of a cryogenic batch freezer with the effect of loading. Energy (2019) 171:77–94. doi:10.1016/j.energy.2018.12.149
7. Zhao C-J, Han J-W, Yang X-T, Qian J-P, Fan B-L. A review of computational fluid dynamics for forced-air cooling process. Appl Energ (2016) 168:314–31. doi:10.1016/j.apenergy.2016.01.101
8. Kokolj U, Škerget L, Ravnik J. A numerical model of the shortbread baking process in a forced convection oven. Appl Therm Eng (2017) 111:1304–11. doi:10.1016/j.applthermaleng.2016.10.031
9. Román-Roldán NI, Ituna Yudonago JF, López-Ortiz A, Rodríguez-Ramírez J, Sandoval-Torres S. A new air recirculation system for homogeneous solar drying: Computational fluid dynamics approach. Renew Energ (2021) 179:1727–41. doi:10.1016/j.renene.2021.07.134
10. Rek Z, Rudolf M, Zun I. Application of CFD simulation in the development of a new generation heating oven. Strojniški vestnik - J Mech Eng (2012) 58:134–44. doi:10.5545/sv-jme.2011.163
11. Lemus-Mondaca R, Zambra C, Rosales C. Computational modelling and energy consumption of turbulent 3D drying process of olive-waste cake. J Food Eng (2019) 263:102–13. doi:10.1016/j.jfoodeng.2019.05.036
12. Al-Nasser M, Fayssal I, Moukalled F. Numerical simulation of bread baking in a convection oven. Appl Therm Eng (2021) 184:116252. doi:10.1016/j.applthermaleng.2020.116252
13. Zhao F, Han F, Zhang S, Tian H, Yang Y, Sun K. Vacuum drying kinetics and energy consumption analysis of LiFePO4 battery powder. Energy (2018) 162:669–81. doi:10.1016/j.energy.2018.08.023
14. Jiang Z, Zhao F, Guan Y, Qiu Z. Research on vacuum drying process and internal heat conduction of Li-ion battery core. Theor Appl Mech Lett (2019) 9:120–9. doi:10.1016/j.taml.2019.02.008
15. Rong L, Aarnink AJA. Development of ammonia mass transfer coefficient models for the atmosphere above two types of the slatted floors in a pig house using computational fluid dynamics. Biosyst Eng (2019) 183:13–25. doi:10.1016/j.biosystemseng.2019.04.011
16. Xin Y, Rong L, Wang C, Li B, Liu D. CFD study on the impacts of geometric models of lying pigs on resistance coefficients for porous media modelling of the animal occupied zone. Biosyst Eng (2022) 222:93–105. doi:10.1016/j.biosystemseng.2022.07.015
17. Doumbia EM, Janke D, Yi Q, Amon T, Kriegel M, Hempel S. CFD modelling of an animal occupied zone using an anisotropic porous medium model with velocity depended resistance parameters. Comput Elect Agric (2021) 181:105950. doi:10.1016/j.compag.2020.105950
18. Zhou D, Du Y, Wang P, Qian H, Zhou Y. Experimental study on the influence of gas flux on flow resistance in porous media. J Logistical Eng Univ (2011) 27:50–3+81. doi:10.3969/j.issn.1672-7843.2011.04.0117843.2011.04.011
19. Getahun E, Delele MA, Gabbiye N, Fanta SW, Demissie P, Vanierschot M. Importance of integrated CFD and product quality modeling of solar dryers for fruits and vegetables: A review. Solar Energy (2021) 220:88–110. doi:10.1016/j.solener.2021.03.049
Keywords: drying cabinet, computational fluid dynamics, numerical simulation, thermal analysis, structure design
Citation: Peng X, Wang Z, Shen G and Yang Y (2023) Optimized cabinet parameters for drying lithium-ion batteries based on coupled fluid–thermal field analysis. Front. Phys. 11:1143477. doi: 10.3389/fphy.2023.1143477
Received: 13 January 2023; Accepted: 24 February 2023;
Published: 13 March 2023.
Edited by:
Leilei Chen, Huanghuai University, ChinaReviewed by:
Jianfeng Yang, Xi’an University of Science and Technology, ChinaCopyright © 2023 Peng, Wang, Shen and Yang. This is an open-access article distributed under the terms of the Creative Commons Attribution License (CC BY). The use, distribution or reproduction in other forums is permitted, provided the original author(s) and the copyright owner(s) are credited and that the original publication in this journal is cited, in accordance with accepted academic practice. No use, distribution or reproduction is permitted which does not comply with these terms.
*Correspondence: Xuan Peng, cGVuZ3h1YW44OUBzaW5hLmNvbQ==
Disclaimer: All claims expressed in this article are solely those of the authors and do not necessarily represent those of their affiliated organizations, or those of the publisher, the editors and the reviewers. Any product that may be evaluated in this article or claim that may be made by its manufacturer is not guaranteed or endorsed by the publisher.
Research integrity at Frontiers
Learn more about the work of our research integrity team to safeguard the quality of each article we publish.