 Heesung Park
 Yukinori Sakiyama2
 Hae June Lee
94% of researchers rate our articles as excellent or good
Learn more about the work of our research integrity team to safeguard the quality of each article we publish.
Find out more
ORIGINAL RESEARCH article
Front. Phys., 23 March 2023
Sec. Low-Temperature Plasma Physics
Volume 11 - 2023 | https://doi.org/10.3389/fphy.2023.1137994
This article is part of the Research TopicModeling Non-thermal Plasmas with Novel Algorithms and Computational MethodsView all 4 articles
A particle-in-cell simulation is suitable for simulating capacitively coupled plasma devices because it calculates the trajectory of particles with arbitrary energy distributions and has the advantage of analyzing sheath dynamics precisely. Implementing the ghost grid method in the Poisson solver makes it possible to simulate a curved structure in the structured grids. The electron transport and heating mechanism are determined according to the two-dimensional (2D) sheath dynamics. The hollow cathode effect on electron transport was analyzed by varying the hole shape and gas pressure. The spatial distributions of electron density and temperature are influenced by the energy relaxation length of electrons, which is affected by the energy distribution function and gas pressure. As a result, a new electron heating mode appears in the 2D structure.
Capacitively coupled radio-frequency (RF) plasmas are commonly used in the microelectronics industries, such as dry etching, plasma-enhanced chemical vapor deposition, cleaning, and so on [1–3], as it is adequate to make a relatively uniform plasma with a simple structure. Since the RF capacitively coupled plasmas (CCPs) have a small gap between two parallel electrodes, the plasma is mainly heated and transported in the direction perpendicular to the electrode. As it is crucial to have a uniform plasma distribution, a showerhead structure is used for a uniform gas flow distribution [4]. This showerhead structure is included in the electrode and performs as a hollow cathode (HC) plasma source [5, 6]. It is well known through theory and simulation that the HC discharge effect appears as a relationship between hole size and sheath width at a low pressure of several tens of mTorr [7–10]. The HC effect was verified through experiment and simulation even at high pressures of hundreds mTorr [11, 12].
From the perspective of the fluid pipe, to obtain a uniform fluid distribution without converting to turbulence in the chamber, the diffuser structure of the showerhead is more advantageous than the orifice structure. Therefore, the HC structure was tested experimentally and simulated for various trench structures [12, 13]. In addition, simulations were performed on the repetitive form of the trenches, which can be applied to the showerhead structure.
Simulations for the CCPs show that the sheath dynamics significantly affect the plasma [14]. The particle-in-cell (PIC) simulation is highly reliable in the analysis of the sheath dynamics because it calculates the energy of each particle for each position and at every time and is very easy to confirm the space charge density and the electron heating phenomenon [15, 16]. However, applying a PIC method makes the calculation difficult due to the large superparticle number and the requirement of calculating Poisson’s equation with a smaller grid than the Debye length. There is also a way to perform simulation in an unstructured mesh other than a square grid [17, 18], but a PIC simulation mainly uses a square mesh with a finite difference method to reduce errors in weighting and calculation time [19]. Therefore, it is challenging to simulate curved structures with a structured mesh. The finite element method (FEM) is a good tool for implementing a curved boundary [20], but the time to calculate the particle location increases abruptly in the FEM. In addition, the truncation error for weighting particles to cells is not well-defined as the cell size varies widely in the FEM. Therefore, the ghost grid method (GGM) is an excellent method to apply to the conventional PIC simulation with the finite difference method (FDM). A GGM is a good tool for solving the Poisson equation on a curved boundary using linear interpolation. Simulation of various conductor structures without increasing the numerical error was tested for a fluid simulation [21] and a PIC simulation [22].
The particle location is precisely investigated to eliminate the particles passing through the curved conductor boundary. Compared with the conventional FDM PIC, all the other calculation modules are the same, but the calculation for the potential profiles inside of the conductor is different to consider the effect of the curved boundary. Compared with a stepwise FDM boundary for a cylinder, the relative error of the potential profile obtained by the GGM is reduced by 1,000 times [23].
In this study, we analyzed the plasma distributions in a hollow cathode trench by changing the gas pressure and structure. In addition, we investigated how the electron energy relaxation length changes the electron heating and the electron transport process. Section 2 presents the simulation conditions and the method to deal with the curved conductor boundary in the Poisson equation. Section 3 presents the simulation results, followed by conclusions in Section 4.
A schematic of the simulation structure is presented in Figure 1. The size of the simulated domain is reduced by using Neumann boundary conditions on the left and right sides to realize a periodic structure. Since the simulation was performed with a 2-D Cartesian coordinate, the cathode structure follows a trench rather than a hole. The gap between the upper and the lower ground electrodes is 10 mm. The simulation was carried out while the size of the trench inlet injected into the chamber was changed from d = 2 mm–8 mm, and the depth was adjusted from h = 5 mm–15 mm. The slope of the upper plate electrode was applied with a shape extending from a rectangular shape with a width of 5 mm to a diffuser structure adopting a Gaussian profile.
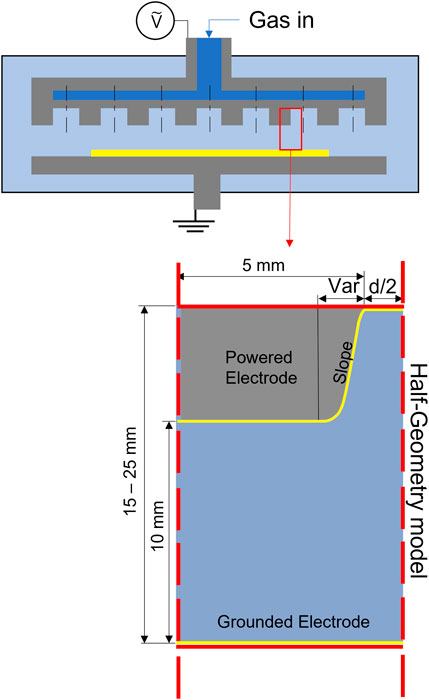
FIGURE 1. A schematic diagram of the simulation structure.
A Simulation was performed for argon gas uniformly distributed from 0.4 Torr to 1.0 Torr at a temperature of 300 K. Ionization and excitations were calculated using the Monte-Carlo collision (MCC) method for the below-mentioned reactions [24]. The RF power with an amplitude of 200 V and a frequency of 13.56 MHz was supplied to the upper electrode. In this study, we used a huge external capacitor so that the change in the surface area does not induce a self-bias. The secondary electron emission and self-bias also change the density and temperature profiles of electrons. However, this study did not include secondary electron emission and self-bias by asymmetric electrode shapes for simplicity.
e+ Ar → e + Ar (Elastic scattering),
e + Ar → e + Ar* (Excitation),
e + Ar → e + Ar+ + e (Ionization),
Ar+ + Ar → Ar+ + Ar (Elastic scattering),
Ar+ + Ar → Ar + Ar+ (Charge exchange).
Most conventional PIC simulations use the finite difference method using structured grids. It is necessary to apply a curved boundary to exclude electron heating by the enhanced fields at the rectangular corner. However, the realistic curved edges in this system cause significant errors in calculating electric fields under the rectangular meshes. There is also a method of using an unstructured grid, but utilizing the structured grid effectively reduces errors in weighing from the fields at the grids to particles and from particles to fields at the grids in 2D PIC simulation. The Poisson solver using a GGM under the structured grid reduces the numerical error significantly [24].
Figure 2 shows three characteristic grids that appear while applying a GGM. Green dots are the real simulation grids on the plasma side, and yellow dots are the nearest grids in the conductor. Purple dots are the ghost grids on the curved boundary. The difference equation of the Poisson equation at the grid point i, j is modified as follows
where
where
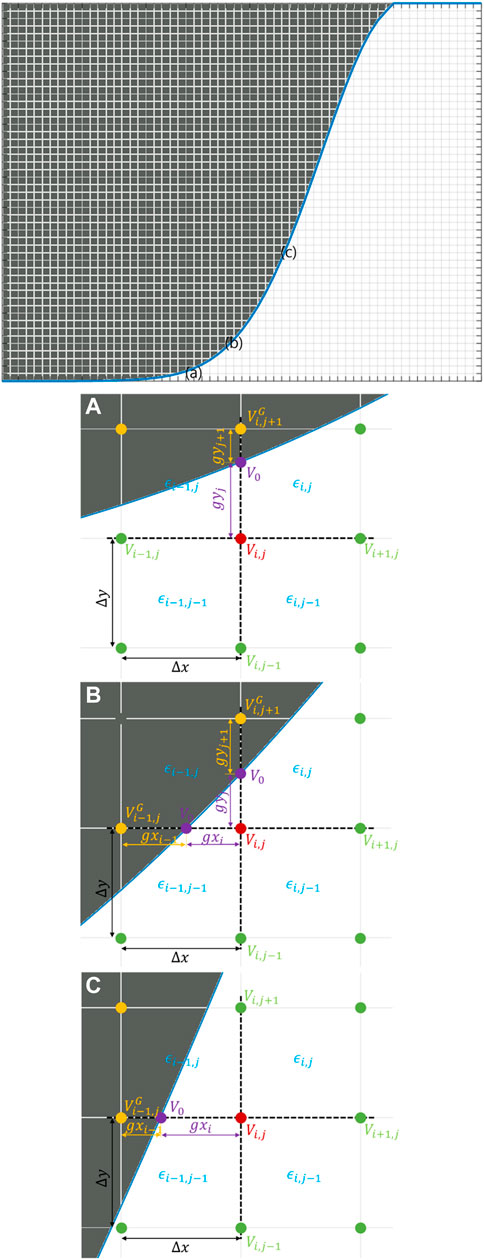
FIGURE 2. A schematic of the field solver with curved boundaries located (A) at the upper side, (B) at the upper left sides, and (C) at the left side, which corresponds to the number of ghost grids (purple dots) of 1 (top), 2 (top and left), and 1 (left).
In the same way, for the situation in Figure 2B,
and for the situation in Figure 2C,
Figure 3 shows the time-averaged electron density and the space charge density calculated with the difference between the ion density and the electron density. Six cases were tested for 1 Torr (Figures 3A–F) and two for 0.6 Torr (Figures 3F, G). Figures 3A–D show the changes in the rectangular hole width from 2 mm to 6 mm. Figures 3E, F show the effect of the Gaussian slope for the hole width of 4 mm and 6 mm. Figures 3G, H show the effect of hole depth for 0.6 Torr. When the hole width increases from 0 to 4 mm, as shown in Figures 3A–C, the plasma density increases near x = 0 underneath the hole. In contrast, the plasma density decreases near x = −6 cm underneath the planar region without a hole. In the case of Figure 3D, plasma penetrates the hole to form two density peaks, but the space charge profile does not show two peaks. As the slope changes from a rectangular shape (Figure 3C) to a Gaussian shape (Figure 3E) with the same terminal hole width of 4 mm, electrons enter the hole, and a two-peak density profile occurs similarly to Figure 3D.
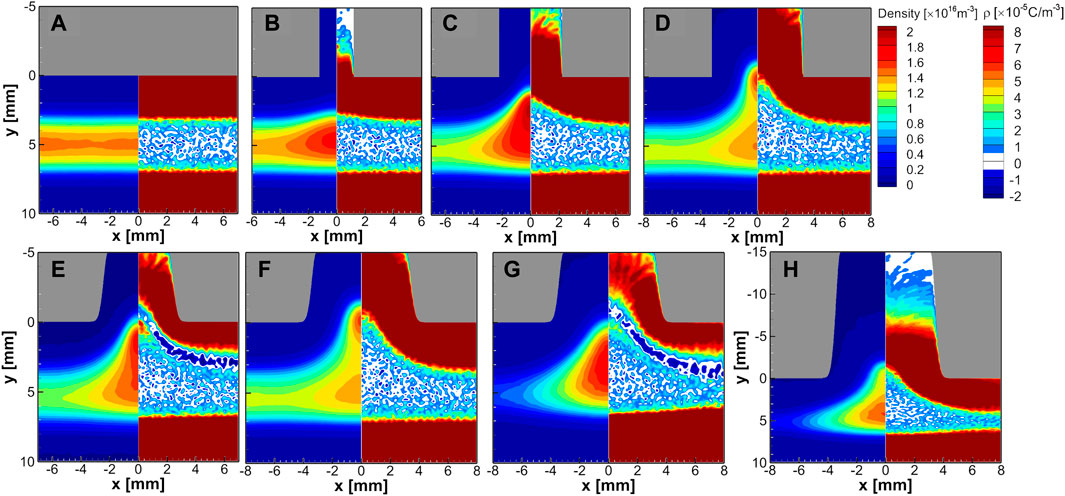
FIGURE 3. The time-averaged spatial profiles of the electron density (left side) and the space charge density (right side) obtained by changing the simulation conditions (A) without trench or with an inlet trench size of (B) d = 2 mm, (C) d = 4 mm, and (D) d = 6 mm, (E) d = 4 mm with Gaussian shape slope, (F) d = 6 mm with Gaussian shape slope with a hole depth of h = 5 mm at 1 Torr. In addition, (G) with a gas pressure of 0.6 Torr under the same condition as (F), and (H) with a depth of h = 15 mm under the same condition as (G).
Two-peak density occurs for the case with a hole width of 6 mm and a Gaussian slope at 1 Torr (Figure 3F) but disappears when gas pressure is reduced to 0.6 Torr (Figure 3G). However, the two-peak density profile appears again when the hole depth increases to h = 15 mm at the same pressure of 0.6 Torr, as shown in Figure 3H. One more thing to mention is that a strong negative charge density happens for the time-averaged space charge density profiles in Figures 3E, G, which occurs when the sheath width is relatively short near the edge of the hole. We will explain later that it is related to the electron energy relaxation length.
Figure 4 shows the time-averaged electron temperature and potential for one RF cycle. In the cases without the HC (Figure 4A) or with a small hole shorter than the sheath thickness (Figure 4B), the electron temperature is high at the bulk-sheath boundary by stochastic electron heating and relatively low in the bulk plasma. However, the electron temperature in the bulk plasma increases abruptly when the hole size is large enough for electrons to penetrate the hole (Figures 4D, E). Moreover, in these cases, the electron temperature is higher at the bulk plasma than near the bulk-sheath boundary. Thus, much ionization happens there, and the electron density increases rapidly from Figures 3A–C. However, the enhanced ionization by the increasing electron temperature cannot explain why the electron density decreases in Figures 3D–F with higher electron temperatures than that of Figure 3C. In addition, comparing Figures 4C, E, the overall electron temperature increases abruptly with the Gaussian slope compared with the rectangular shape. However, the temperature profiles look almost the same when comparing Figures 4D, F. Therefore, the time-averaged temperature increases in the bulk plasma when the plasma density penetrates the hole so that electrons react with the sheath dynamics. The time-dependent electron energy probability function will be explained in Figure 9. Moreover, when the heated electrons do not have enough energy above the ionization threshold, only the electron transport is enhanced to reduce the plasma density. It will be explained with the concept of the energy relaxation length.
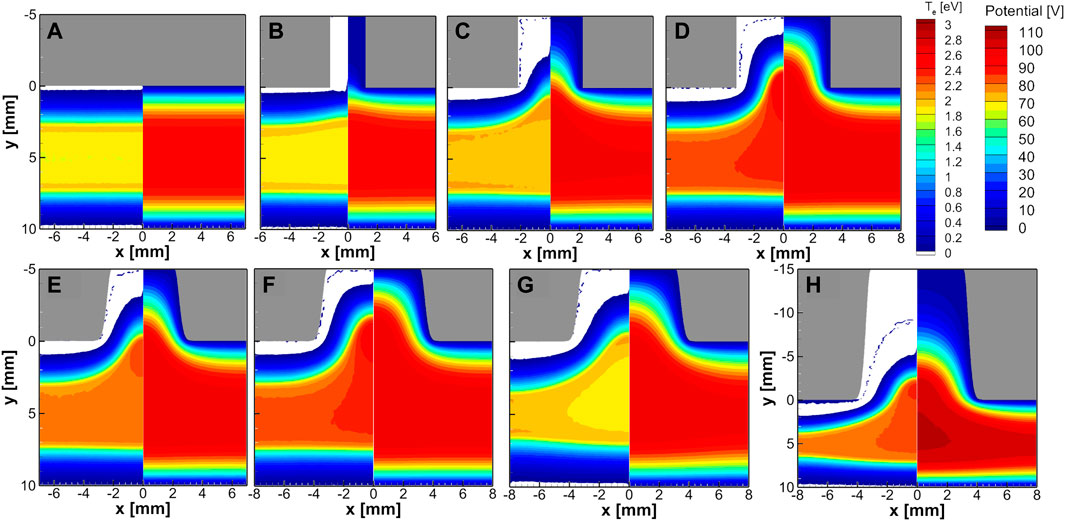
FIGURE 4. The time-averaged spatial profiles of the electron temperature (left side) and the electric potential (right side) obtained by changing the simulation conditions (A) without trench or with an inlet trench size of (B) d = 2 mm, (C) d = 4 mm, and (D) d = 6 mm, (E) d = 4 mm with Gaussian shape slope, (F) d = 6 mm with Gaussian shape slope with a hole depth of h = 5 mm at 1 Torr. In addition, (G) with a gas pressure of 0.6 Torr under the same condition as (F), and (H) with a depth of h = 15 mm under the same condition as (G).
The HC effect causes the density peaks inside or near the hole. In the cases of Figures 4D, E, F, H, for which the HC effect appeared in Figure 3, the electron temperature is the highest at the point where the density peak occurs. In addition, the electron temperature in bulk is also maintained high. However, when comparing Figures 4F, G, the time-averaged electron temperature profiles show the opposite trend for 1 Torr and 0.6 Torr. Therefore, analyzing the HC effect only through the time-averaged potential profiles is impossible. In the next section, phase-resolved analysis is presented.
Figure 5 shows the phase-resolved profiles of the electron current densities at three different locations at x = −7 mm, x = −3 mm, and x = 0 for the case of Figure 3C for two RF periods. Figure 6 shows the same profiles at x = −8 mm, x = −3 mm, and x = 0 for the case of Figure 3F, with a Gaussian slope, for two RF periods. The upper figures show the horizontal current density, and the bottom figures show the vertical current density. The main difference between Figure 5; Figure 6 is that Figure 3C has a density peak at the bulk, and Figure 3F has two density peaks. The electric field at the edge of the hole is not dominant for the Gaussian slope. Note that the direction of electron current density is opposite to the direction of electron transport. In Figure 5A; Figure 6A, the x-directional transport is trivial at the far position from the hole, which is the same in Figure 5C; Figure 6C at the center of the hole. However, as the phase changes, as shown in Figures 5B; Figure 6B, strong horizontal electron transport in the bulk region is observed. Blue or red color indicates the average electron motion in the right or left direction. Especially in Figure 6B, the electron transport direction is opposite inside the upper sheath, in the vicinity of 0 < y < 2 mm.
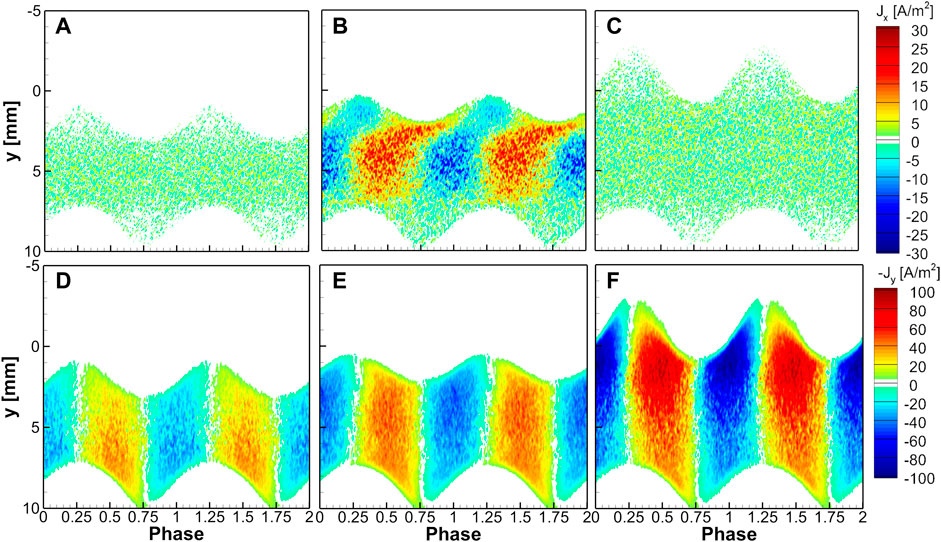
FIGURE 5. The phase-resolved electron current density for the conditions in Figure 3C for two RF periods. The electron current density (A)–(C) in the x-direction and (D)–(F) in the negative y-direction over the y-directional spatial positions at (A), (D) x = −7 mm, (B), (E) x = −3 mm, and (C), (F) x = 0.
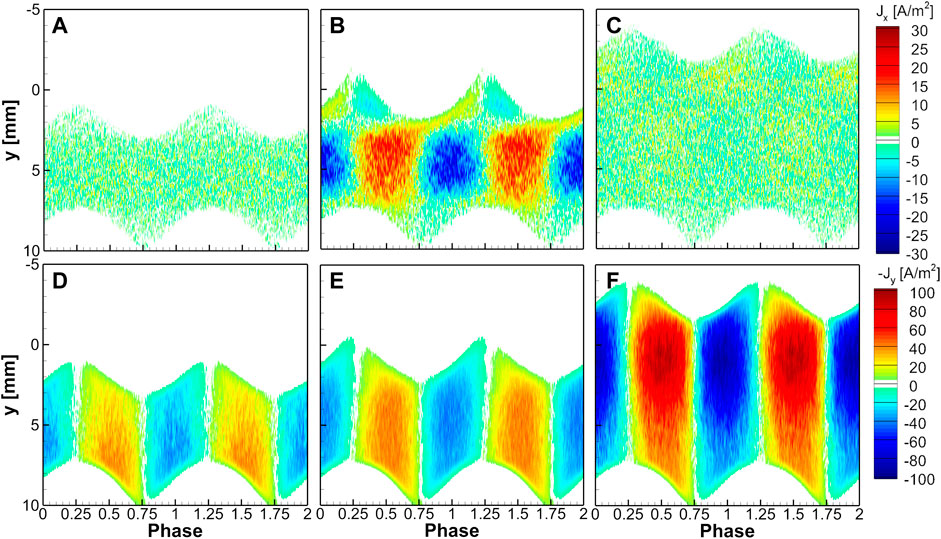
FIGURE 6. The phase-resolved electron current density for the conditions in Figure 3F for two RF periods. The electron current density (A)–(C) in the x-direction and (D)–(F) in the negative y-direction over the y-directional spatial positions at (A), (D) x = −8 mm, (B), (E) x = −3 mm, and (C), (F) x = 0.
Figures 5D–F; Figures 6D–F show the electron transport in the y direction. Because the y-axis is set downward, we plotted -Jy in the figures. Blue or red color indicates the upward or downward average motion. Ensemble-averaged electron transport is upward when the bottom sheath expands and downward when the bottom sheath shrinks. The y-directional transport is stronger near the bottom sheath at the far position from the hole, at x = −7 mm (Figure 5D) and at x = −8 mm (Figure 6D), but this tendency is reversed inside the hole. A strong electron current density in the y-direction is measured near the top sheath at x = 0, as shown in Figure 5F; Figure 6F. The current density peak appears where the density is maximum in bulk. By combining the two-directional electron transport, electrons move inward or outward to the hole with the phase change. Considering that the electron current density is a multiplication of electron density and the average velocity and that the electron density is not so high in the sheath, this intenseness is strongly affected by transport rather than the electron density. Near the hole, electron transport between two density peaks strongly depends on the phase. The transport of electrons shows different patterns with or without the density peak in the hole. For the shrinking phase of the top sheath, the density distracts in the x-direction for 0 < y < 2 mm but contracts for 2 mm < y < 7 mm. Although Figure 6B shows the outward electron transport at y = 2 mm for the whole period, Figure 5B does not. The transport in the x-direction is affected by the hole shape and the location of the density peaks.
Figures 7A–C show the spatial profiles of the time-averaged electron density and the electron temperature for the change of the hole size from 2 mm to 6 mm, corresponding to the cases of Figures 3B–D, and respectively. Figures 7D–L show the phase-resolved plots of electron temperature, the electron power absorption, and the ensemble-averaged electron energy relaxation length (EERL) at x = 0. The EERL is the mean length for an electron to release its energy by collisions with neutral gas and is calculated with the square root of the product of the momentum transfer mean-free path and the inelastic mean-free path [25, 26]. Increasing the hole width increases the penetration depth of the plasma to the upper boundary and enhances the electron temperature, as shown in Figures 7D–F. Comparing Figures 7G, H, intense electron heating in the hole results in an intensified density inside the hole as the hole width increases from 2 mm to 4 mm. When the sheath penetrates the hole, the two-dimensional oscillatory sheath motion increases the number of high-energy electrons to enhance ionization. However, two-peak electron density does not occur yet for the hole width of 4 mm. In the expansion phase of the top sheath, electron heating occurs only when the upper sheath expands. In this case, plasma density contracts in the x-direction as well. However, when the hole width becomes 6 mm, the electron heating gets more significant even in the bulk plasma region for 0 < y < 5 mm, as shown in Figure 7I, even during the shrinking phase of the upper sheath. Two-peak electron density happens in this case.
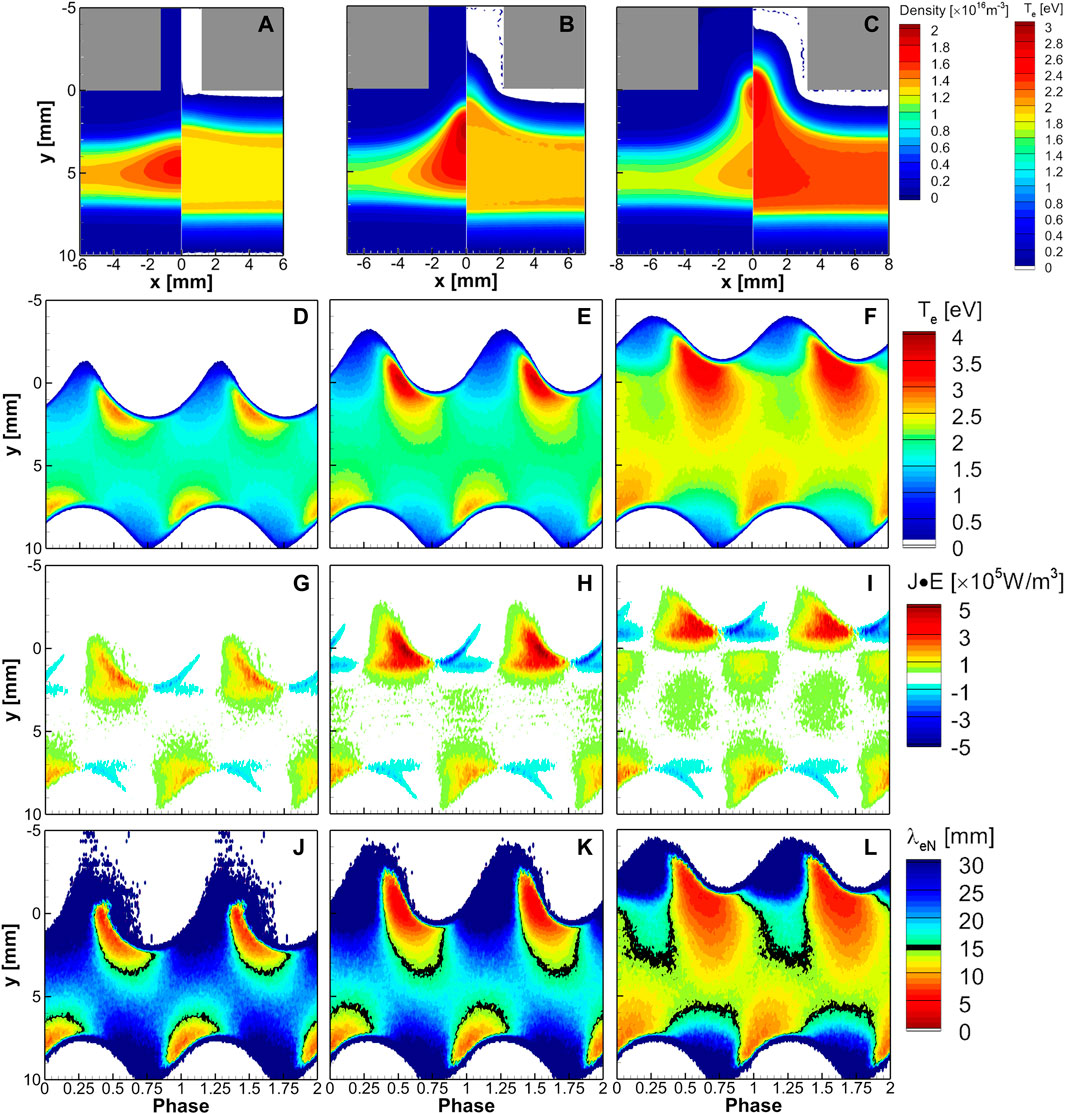
FIGURE 7. Shown are time-averaged spatial profiles of electron density (left side) and temperature (right side) for the hole width of (A) 2 mm, (B) 4 mm, and (C) 6 mm. The phase-resolved spatiotemporal profiles at x = 0 position are provided for each case for (D)–(F) electron temperature, (G)–(I) electron power absorption, and (J)–(L) ensemble-averaged electron energy relaxation length,
The electron heating in the bulk region is insufficient for increasing ionization but large enough to improve electron transport. Therefore, electrons move toward the hole more rapidly during the shrinking phase. EERLs for the three different hole widths are compared in Figures 7J–L. As EERLs decrease with the increasing electron energy [25, 26], enhanced electron heating reduces the EERL as the hole width increases. Black lines show the border of EERL to be the same as the gap distance, 15 mm. With a hole length of 6 mm, most EERL is less than 5 mm near the electron heating regions, and thus two density peaks at y = 1 mm and y = 6 mm are generated, as shown in Figure 3D.
Figures 8A, B show the spatial profiles of the time-averaged electron density and the electron temperature. The phase-resolved electron temperature, electron power absorption, and the EERL are shown for the deep and wide hole (h = 15 mm and d = 8 mm) for 0.4 Torr (Figure 8A) and 0.6 Torr (Figure 8B). Deep holes and high gas pressure enhance electron temperature in the bulk region (Figure 8D). The EERL decreases inversely proportional to gas pressure, and thus 0.6 Torr case shows two-density peaks finally. The electron heating shown in Figure 8E shows the electrons are heated inside the hole, following a well-known HC effect. However, the electron heating in Figure 8F shows a significant electron heating in the bulk plasma. At this point, the first density peak occurs, which affects the direction of the x-directional electron transport and the magnitude of the y-directional electron transport. Since electrons are always compressed at this point, electron heating occurs even in the sheath-shrinking phase [27].
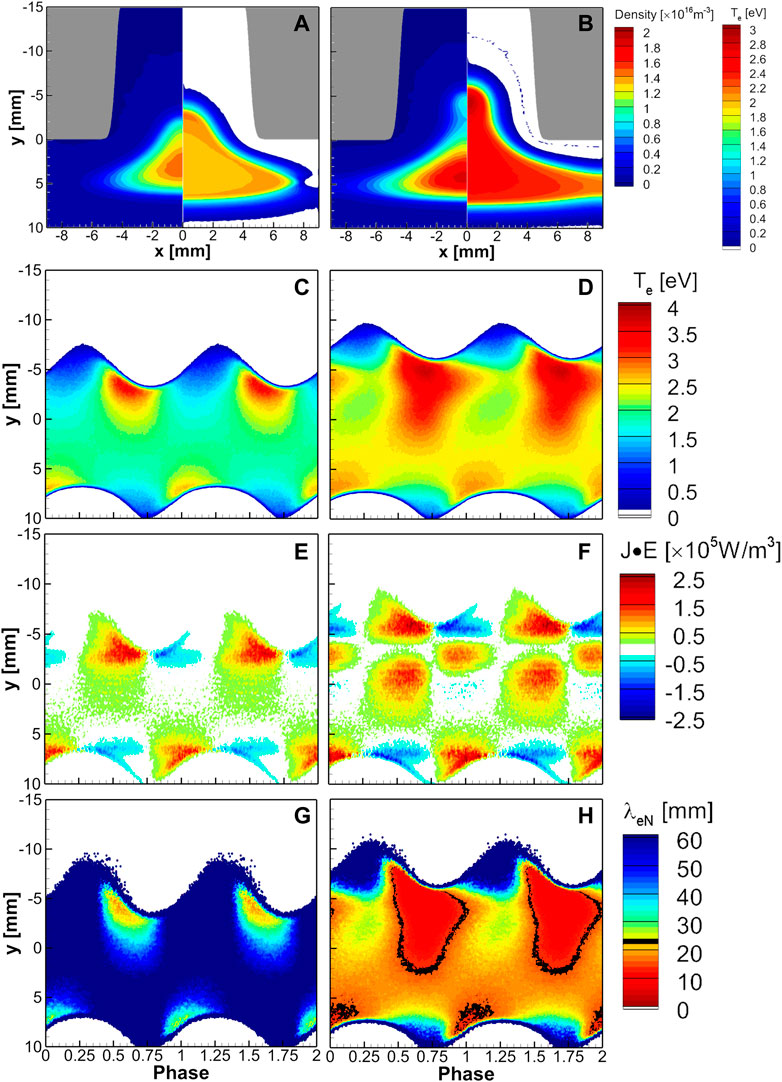
FIGURE 8. Shown are time-averaged spatial profiles of electron density (left side) and temperature (right side) under the conditions of d = 8 mm and h = 15 mm with Gaussian shape slope with a gas pressure of (A) 0.4 Torr and (B) 0.6 Torr. The phase-resolved spatiotemporal profiles at x = 0 position are provided for each case for (C)–(D) electron temperature, (E)–(F) electron power absorption, and (G)–(H) ensemble-averaged electron energy relaxation length,
Figure 9 shows the phase-resolved electron energy probability functions (EEPFs) at four locations as shown in Figure 9A; inside the upper sheath, two peak density positions, and inside the lower sheath, for the case of h = 15 mm and 0.6 Torr for the case of Figure 8B. One period (T) has been divided into 8 phases indicated in the voltage curve with different colors. The solid lines mean the phases when the top sheath expands, and the dashed lines mean the phases when the bottom sheath expands. The change in the EEPFs at the bulk plasma near the bottom electrode is negligible, as shown in Figure 9B. However, the EEPFs inside the lower sheath are relatively sensitive to the phase of the applied voltage, especially when the bottom sheath is expanding from 5T/8 to 7T/8. During the sheath shrinking phases (solid lines), the electron temperature, which is the slope of the EEPF, is lower while it gets larger during the sheath expanding phases (dashed lines).
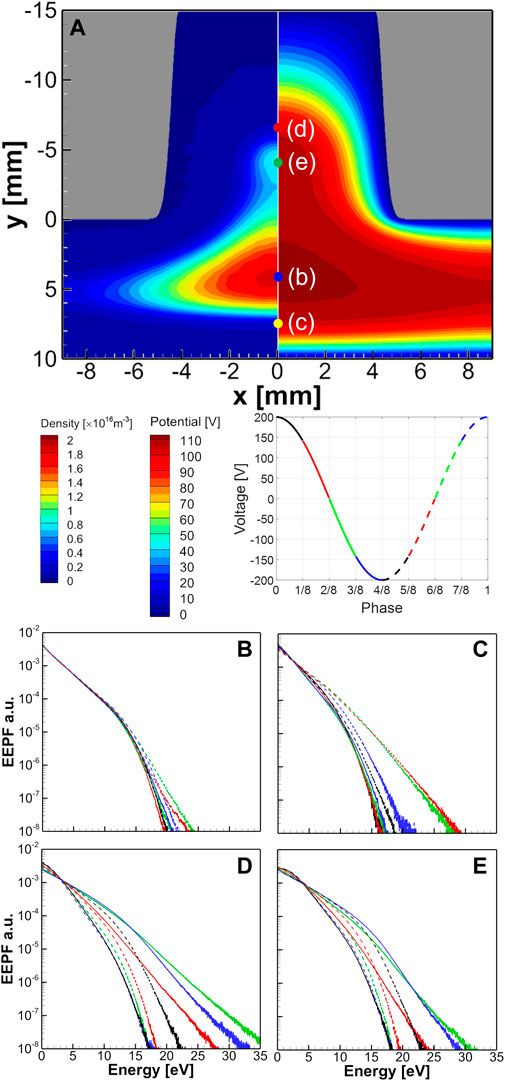
FIGURE 9. (A) The time-averaged spatial profiles of the electron density (left side) and electrical potential (right side) for the same conditions as the case of Figure 8B. The phase-resolved electron energy probability functions are calculated at the locations at (B) the density peak position in the bulk plasma, (C) the bottom sheath, (D) the top sheath, and (E) the density peak point in the hole. The phase-resolved plot shows four sheath-expanding (solid) and sheath-shrinking (dotted) phases in blue, yellow, red, and green colors for the applied voltage phase shown in the second row.
Inside the upper sheath, as shown in Figure 9D, intense electron heating occurs due to the HC effect during the sheath-expansion phase (solid red, green, and blue lines), resulting in many ionization collisions and the increase of the population of the low-energy electrons in the EEPFs. However, there is still intense heating even during the sheath-shrinking phase (dashed black and red lines) because of the two-dimensional effect. The electrons come horizontally into the hole from the sides during the sheath-shrinking phases. The same EEPF tendency is shown at the upper peak density position, as shown in Figure 9E. The intense population of the EEPF below 5 eV means an increase in the electron temperature, as shown in Figure 8D.
As electrons lose energy after ionization while passing through the peak point inside the hole during the sheath expanding phases, the electron density decreases again around y = −2 mm after creating a density peak at y = −4 mm. The electron heating at −4 mm < y < −2 mm during the sheath shrinking phase inside the hole is not enough to cause ionization, but it keeps the temperature of the electrons high. For this reason, the slope of the EEPF in Figure 9E is maintained high.
Figure 10A shows the time-averaged space charge density that derives the sheath structure. Figures 10B–I show the electron trajectories according to the voltage phase shown in the second row of Figure 9. The left column shows the dynamics of two test particles starting from four different initial locations (grey circles) during the sheath expanding phases marked as the black, read, green, and blue colors. When starting at the center of the hole (Figures 10B, C), electrons either spread outward or gather inside the hole depending on the phase. Figure 10C shows the rapid escape of the electrons because of the previous acceleration during the sheath-expanding phase.
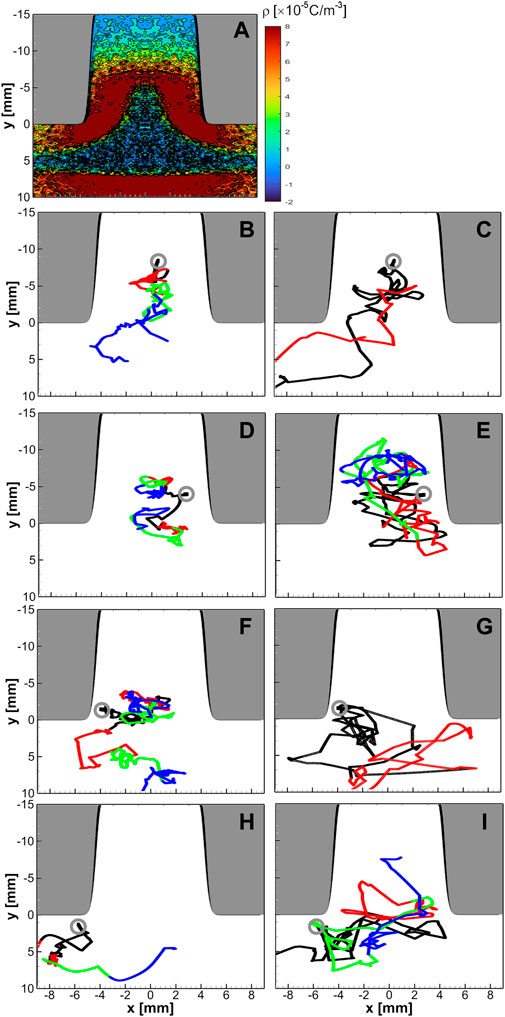
FIGURE 10. Shown are (A) the time-averaged spatial profiles of the space charge density for the same conditions as the case of Figures 8B, (B–I) the particle trajectories of two test particles which started from four different locations (grey circles) for the sheath-expanding (left) and the sheath-shrinking (right) phases, following the voltage phases shown in Figure 9.
In the vicinity of the sidewall (Figures 10D, E), electrons always flock inside the hole regardless of the phase. Electrons are heated while transporting inside the hole. When starting from the corner of the hole (Figures 10F, G), some electrons move toward the bulk plasma, but some escapes the system when the bottom sheath collapses as shown in Figure 10G. Finally, when starting underneath the corner (Figures 10H, I), electrons move to the bulk plasma near the bottom electrode during the sheath expanding phase. However, electrons flock inside the hole again when the top sheath shrinks.
In the previous cases, we neglected the effect of self-bais or applied DC bias. However, if the external capacitance gets smaller, the increased surface area on the top electrode induces a positive DC bias. Oppositely, it is also possible to add a negative bias to the top electrode externally. For the variation of the DC bias, Figure 11 shows the time-averaged profiles of the electron density, the electron temperature, and the phase-resolved profiles of the electron power absorption with a positive and a negative DC bias, in comparison with Figure 3H. With a negative bias voltage, the overall average potential is low at the bulk center, and the electron density and the temperature decrease. The density peak is pushed out of the hole because the sheath length is longer at a lower electron density. As the potential difference from the top electrode to the bulk plasma increases compared with the case of Figure 3H, the density does not increase near the hole because of the enhanced electron transport canceling the increased ionization.
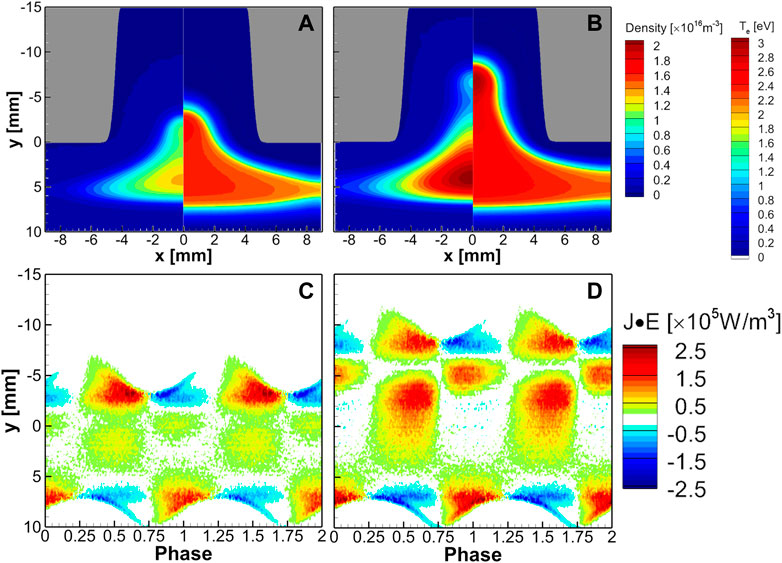
FIGURE 11. Shown are time-averaged spatial profiles of electron density (left side) and temperature (right side) under the conditions of d = 8 mm and h = 15 mm with a Gaussian shape slope with a gas pressure of 0.6 Torr. An RF voltage of 200 V at a frequency of 13.56 MHz was applied to the upper electrode with a DC bias voltage of (A) −30 V and (B) +30 V. The phase-resolved spatiotemporal profiles at x = 0 are plotted for the electron power absorption with a DC bias voltage of (C) −30 V and (D) +30 V.
With a positive bias voltage, the situation is the opposite. The time-averaged potential difference increases from the bottom electrode to the bulk plasma. Thus, the electron density increases near the bottom electrode. In addition, the electron density peak penetrates deep into the hole, increasing the plasma density and the electron temperature at the center of the hole. Although the electron power absorption is weakened by the reduced potential difference from the top electrode to the bulk plasma, the electron temperature for the low-energy electrons is relatively high. The enhanced electron heating between y = 0 and y = −10 mm is caused by 2D electron dynamics in the sheath.
In this manuscript, we investigated the array of the hollow cathode trench using a 2D PIC MCC simulation to emphasize the importance of the electron heating mechanism caused by the 2D electrode structure. At first, we reported the numerical scheme to treat the curved electrode structure in the 2D PIC simulation. With this simulation method, it is possible to simulate arbitrary curved conductor boundaries mapped under rectangular grids keeping a reasonably high accuracy.
A change from the uniform plasma density with planar electrodes to an enhanced non-uniform plasma density with the HC trench was observed with the increase in the hole size. When the sheath length is shorter than the hole size, the plasma penetrates the trench, and electrons show a complicated trajectory coupled with the sheath dynamics. Furthermore, when the hole width or gas pressure increases, two-peak density distributions occur due to the relationship between the EERL and the electrode gap distance. When the sheath heating is sufficient to generate high-energy electrons, ionization is more dominant in increasing the plasma density. However, electron heating enhances electron transport to reduce the plasma density when the electron temperature increases only for the low-energy electrons under the ionization threshold.
The plasma density distribution leads to perturbation of the space charge density profile, affects electron transport, creates a peculiar electron heating phenomenon, and keeps the electron temperature higher. With the same driving condition and gas pressure, the hollow cathode discharge generally has a much higher electron temperature in the whole region. In previous studies, many researchers only reported an increase in the electron density due to the hollow cathode effect, including the pendulum electron motion and the enhanced secondary electron emission inside the hole. However, in this study, we found that the electron heating increases under the intermediate pressure (0.4–1 Torr) regime even without the ion-induced secondary electron emission and that the electron heating does not always increase the plasma density.
When the HC effect generated the density peak inside the hole, a new type of electron heating was observed, as shown in Figure 7I; Figure 8F by the horizontal electron motion due to the geometric effect and the shortened energy relaxation length by the heating. An increase in the electron temperature leads to a decrease in EERL and causes the density peak in the hole to be intensified. Finally, it also occurs when the exit part of the hole is widened or when the hole gets deeper, which is related to the shape of the showerhead to maintain neutral gas uniformity.
The raw data supporting the conclusion of this article will be made available by the authors, without undue reservation.
HP has developed the code for the curved boundary and ran the test cases to analyze the results. YS supported the ideas for research trends and discussion about the discharge mechanism. HL analyzed the results and interpreted the physical mechanism. HP and HL contributed to writing the manuscript.
This work was supported by the National Research Council of Science and Technology (NST) grant by the Korean government (MSIP) (Grant No. GRC-20-01-NFRI) and BK21 FOUR, the Creative Human Resource Education and Research Programs for ICT Convergence in the fourth Industrial Revolution. This work was also supported by the 2019 Unlock Idea Award of Lam Research.
The authors declare that the research was conducted in the absence of any commercial or financial relationships that could be construed as a potential conflict of interest.
All claims expressed in this article are solely those of the authors and do not necessarily represent those of their affiliated organizations, or those of the publisher, the editors and the reviewers. Any product that may be evaluated in this article, or claim that may be made by its manufacturer, is not guaranteed or endorsed by the publisher.
1. Pillarisetty R. Academic and industry research progress in germanium nanodevices. Nature (2011) 479:7373.
2. Samukawa S, Hori M, Rauf S, Tachibana K, Bruggeman P, Kroesen G, et al. The 2012 plasma roadmap. J Phys D: Appl Phys (2012) 45:253001. doi:10.1088/0022-3727/45/25/253001
3. Kim HJ. Influence of the gas pressure in a Torr regime capacitively coupled plasma deposition reactor. Plasma Sourc Sci. Technol. (2021) 30:065001. doi:10.1088/1361-6595/abef17
4. Kim HJ, Lee HJ. 2D fluid model analysis for the effect of 3D gas flow on a capacitively coupled plasma deposition reactor. Plasma Sourc Sci. Technol. (2016) 25:035006. doi:10.1088/0963-0252/25/3/035006
5. Bárdos L. Radio frequency hollow cathodes for the plasma processing technology. Surf Coat Technol (1996) 86-87:648. doi:10.1016/S0257-8972(96)03056-3
6. Bárdos L, Baránková H, Berg S. Linear arc discharge source for large area plasma processing. Surf Coat Techonol (1997) 97:723. doi:10.1063/1.118210
7. Schmidt N, Schulze J, Schüngel E, Czarnetzki U. Effect of structured electrodes on heating and plasma uniformity in capacitive discharges. J Phys D: Appl Phys (2013) 46:505202. doi:10.1088/0022-3727/46/50/505202
8. Lee HS, Lee YS, Seo SH, Chang HY. Effective design of multiple hollow cathode electrode to enhance the density of rf capacitively coupled plasma. Appl Phys Lett (2010) 97:081503. doi:10.1063/1.3480409
9. Wang L, Hartmann P, Donkó Z, Song Y-, Schulze J. Effects of structured electrodes on electron power absorption and plasma uniformity in capacitive RF discharges. J Vac Sci Technol A (2021) 39:063004. doi:10.1116/6.0001327
10. Lafleur T, Boswell RW. Particle-in-cell simulations of hollow cathode enhanced capacitively coupled radio frequency discharges. Phys Plasmas (2012) 19:023508. doi:10.1063/1.3685709
11. Denpoh K. Locally enhanced discharges at gas hole outlets of a showerhead in a plasma etching reactor. J Phys D: Appl Phys (2009) 42:032003. doi:10.1088/0022-3727/42/3/032003
12. Ohtsu Y, Yahata Y, Kagami J, Kawashimo Y, Takeuchi T. Production of high-density radio-frequency plasma source by ring-shaped hollow-cathode discharge at various trench shapes. IEEE Trans Plasma Sci (2013) 31:8.
13. Howling AA, Legradic B, Chesaux M, Hollenstein C. Plasma deposition in an ideal showerhead reactor: A two-dimensional analytical solution. Plasma Sourc Sci. Technol. (2012) 21:015005. doi:10.1088/0963-0252/21/1/015005
14. Kim HC, Iza F, Yang SS, Radmilović -Radjenović M, Lee JK. Particle and fluid simulations of low-temperature plasma discharges: Benchmarks and kinetic effects. J Phys D: Appl Phys (2005) 38:R283–301. doi:10.1088/0022-3727/38/19/r01
18. Araki SJ, Wirz RE. Cell-centered particle weighting algorithm for PIC simulations in a non-uniform 2D axisymmetric mesh. J Comput Phys (2014) 272:218–26. doi:10.1016/j.jcp.2014.04.037
19. Verboncoeur JP. Particle simulation of plasmas: Review and advances. Plasma Phys Control Fusion (2005) 47:A231–60. doi:10.1088/0741-3335/47/5a/017
20. Bai J, Cao Y, He X. An implicit particle-in-cell model based on anisotropic immersed-finite-element method. Comput Phys Commun (2021) 261:107655. doi:10.1016/j.cpc.2020.107655
21. Celestin S, Bonaventura Z, Zeghondy B, Bourdon A, Ségur P. The use of the ghost fluid method for Poisson's equation to simulate streamer propagation in point-to-plane and point-to-point geometries. J Phys D: Appl.Phys (2009) 42:065203. doi:10.1088/0022-3727/42/6/065203
22. Jo YH, Park HS, Hur MY, Lee HJ. Curved-boundary particle-in-cell simulation for the investigation of the target erosion effect of DC magnetron sputtering system. AIP Adv (2020) 10:125224. doi:10.1063/5.0035172
23. Jo YH, Cheon C, Park H, Hur MY, Lee HJ. Multi-dimensional electrostatic plasma simulations using the particle-in-cell method for the low-temperature plasmas for materials processing. J Korean Phys Soc (2022) 80:787–98. doi:10.1007/s40042-021-00375-w
24. Vahedi V, Surendra M. A Monte Carlo collision model for the particle-in-cell method: Applications to argon and oxygen discharges. Compt Phys Commun (1995) 81:179. doi:10.1016/0010-4655(94)00171-W
25. Hawng SW, Lee H-J, Lee HJ. Effect of electron Monte Carlo collisions on a hybrid simulation of a low-pressure capacitively coupled plasma. Plasma Sourc Sci. Technol. (2014) 23:065040. doi:10.1088/0963-0252/23/6/065040
26. Lee JY, Verboncoeur JP, Lee HJ. Analysis of energy relaxation kinetics for control of the electron energy distributions in capacitively coupled RF discharges. Plasma Sourc Sci. Technol. (2018) 27:04LT01. doi:10.1088/1361-6595/aab862
Keywords: particle-in-cell simulation, hollow cathode discharge, curved boundary, electron heating, energy relaxation mean free path
Citation: Park H, Sakiyama Y and Lee HJ (2023) Two-dimensional particle-in-cell simulation of electron heating effect in multiple hollow cathode trenches with curved boundary. Front. Phys. 11:1137994. doi: 10.3389/fphy.2023.1137994
Received: 05 January 2023; Accepted: 16 February 2023;
Published: 23 March 2023.
Edited by:
Anbang Sun, Xi'an Jiaotong University, ChinaReviewed by:
Quan-Zhi Zhang, Dalian University of Technology, ChinaCopyright © 2023 Park, Sakiyama and Lee. This is an open-access article distributed under the terms of the Creative Commons Attribution License (CC BY). The use, distribution or reproduction in other forums is permitted, provided the original author(s) and the copyright owner(s) are credited and that the original publication in this journal is cited, in accordance with accepted academic practice. No use, distribution or reproduction is permitted which does not comply with these terms.
*Correspondence: Hae June Lee, aGFlanVuZUBwdXNhbi5hYy5rcg==
Disclaimer: All claims expressed in this article are solely those of the authors and do not necessarily represent those of their affiliated organizations, or those of the publisher, the editors and the reviewers. Any product that may be evaluated in this article or claim that may be made by its manufacturer is not guaranteed or endorsed by the publisher.
Research integrity at Frontiers
Learn more about the work of our research integrity team to safeguard the quality of each article we publish.