
94% of researchers rate our articles as excellent or good
Learn more about the work of our research integrity team to safeguard the quality of each article we publish.
Find out more
ORIGINAL RESEARCH article
Front. Phys., 21 April 2023
Sec. Physical Acoustics and Ultrasonics
Volume 11 - 2023 | https://doi.org/10.3389/fphy.2023.1128265
This article is part of the Research TopicUltrasound Micromanipulations and Ocean Acoustics: From Human Cells to Marine StructuresView all 11 articles
In order to improve the spatial resolution and the signal-to-noise ratio of Lamb waves in structural health monitoring systems or non-destructive testing techniques, this study presents the construction of Luneburg lenses for focusing higher-order Lamb waves based on the thickness variation. The dispersion curves of Lamb waves are calculated firstly, from which the relation between the phase velocity of a specific mode and the plate thickness is quantified. After that, the plate thickness is determined via the refractive index variation. To demonstrate the generality of this design scheme, two lenses, i.e., the A1-wave-based Luneburg lens and the S2-wave-based Luneburg lens are constructed, and their focusing abilities are examined via numerical simulations in both the time domain and frequency domain. It is revealed that the A1 wave and S2 wave can be focused with a focusing size smaller than one wavelength. The design methodology is easy to realize and can be used to control higher-order Lamb waves efficiently, which also provides potential application values in wave detections and energy collections.
Lamb waves, propagating in a plate-type structure with two traction-free surfaces, have been widely applied in structural health monitoring (SHM) systems and non-destructive testing (NDT) techniques [1–3], which dues to their unique characteristics for long-distance and large-area detection. During the engineering application, efficiently receiving the Lamb wave signals and improving the signal-to-noise ratio (SNR) poses a considerable challenge. Accompanying that, wave focusing is viewed as the effective method to overcome it, as the wave energy is increased to improve the defect detection ability. Many methods have been proposed to focus Lamb waves, e.g., using the phased array transducer [4–6], forming the laser arc-array based on the arc-slit [7, 8], etc. With the development of microfabrication techniques, such as 3D printing, composite structures with multiple components or complex shapes have already been realized, which allows us to focus Lamb waves with the aid of phononic crystals (PCs) and metamaterials.
Generally speaking, PCs and metamaterials are artificial structures that assemble multiple elements or fabricate with a complex configuration, aiming to manipulate the propagation of structural and acoustic waves. Wave velocity can be easily controlled by introducing PCs and metamaterials into SHM systems and NDT techniques, such as the Lamb-wave-based gradient-index (GRIN) lens. The phase velocity and group velocity can be reduced and controlled by the additional artificial sub-component, which makes the Lamb wave propagate in a specified route designed previously. The refractive index of a typical GRIN-PC lens for focusing A0 mode Lamb waves satisfies a hyperbolic secant. For example, Yan and Zhu et al. [9] achieved the hyperbolic secant distribution by using the surface bonded metamaterials with different heights, Tol and Degertekin et al. [10] formed the distribution by an array of blind holes with different diameters, Tian and Tan et al. [11] proposed rotating three-petal epoxy cylinders to satisfy a hyperbolic secant profile. However, the focusing ability of a hyperbolic secant lens is dependent on the orientation of the incident plane wave. A PC Luneburg lens, due to its omnidirectional focusing characteristics, has gained increasing attention from researchers. Tol and Degertekin et al. [12] presented a phononic crystal Luneburg lens numerically and experimentally, and the focusing performance of the A0 mode Lambs waves at different angles are confirmed. Jin and Torrent et al. [13] achieved controlling A0 and S0 Lamb waves simultaneously via graded phononic crystal plates of a circular Luneburg lens.
As we know, the A0 mode of Lamb waves in low-frequency regions can be approximated as the bending wave, with its phase velocity directly related to the plate thickness. Therefore, a relatively simple design methodology, i.e., adopting the thickness variation according to dispersion curves, is proposed to achieve the focusing and guiding of A0 waves [14–16]. Such as the Luneburg lens [14, 17] for focusing a plane wave and the Maxwell Fish-Eye lens [14, 15] for focusing the wave from a point source. The structure designed consists of only single-phase material with no joints and conjunctions between different components, which is beneficial for the fabrication and service life. To the authors’ knowledge, the existing investigations concentrate on the A0 and S0 mode Lamb waves and focusing the higher-order Lamb waves has rarely been studied. However, the higher-order Lamb wave plays an important role in the NDT technique. To be more specific, the abundant higher-order modes provide various displacement and stress patterns for different detecting situations [18, 19]. Moreover, the non-linear effect of the higher-order Lamb waves provides high detecting sensitivity to micro defects, attracting much attention from scientists for damage detections [20–24]. To some extent, focused higher-order Lamb waves can further efficiently improve their performance in NDT and SHM.
This paper proposes two Luneburg lenses for focusing the higher-order Lamb waves, A1 and S2 modes, based on the thickness variation. These lenses are constructed according to the variation principle of the refractive index and the dispersion relationship of the higher-order Lamb waves. After the detailed demonstration of the present design scheme, some finite element simulations are conducted in both time and frequency domains, which prove the excellent focusing ability of the Luneburg lens for A1 and S2 waves. Not limited by A1 and S2 waves, the present design methodology is general and suitable for other higher-order modes of Lamb waves.
Before designing a Luneburg lens for focusing the higher-order Lamb waves, calculating the frequency spectrum of Lamb waves is the prerequisite. For a plate with its upper and bottom surfaces traction-free, the phase velocity of Lamb waves can be obtained from the dispersion relationship by solving the following Rayleigh-Lamb equations [25]:
and
Here, the plate thickness is represented by 2h. k is the wavenumber along the wave propagation direction and p and q are wavenumbers along the plate thickness with
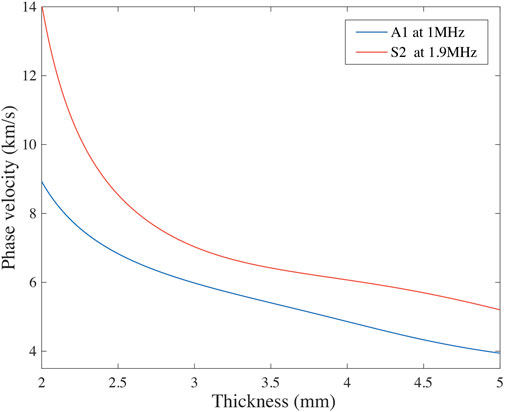
FIGURE 1. The phase velocity variation of the A1 and S2 modes with the plate thickness at some specific frequencies.
Reviewing the Luneburg lens, its refractive index requires [12, 26–28]
where R is the lens radius and
To be noticed that the higher-order modes of the Lamb waves are converged to the transverse velocity as the frequency-thickness product increase so that there will be a range suitable for the method. The phase velocity of the mode at the working frequency should be higher than
In this paper, two Luneburg lenses for focusing the A1 wave at 1 MHz and the S2 wave at 1.9 MHz in a 2 mm aluminum plate, with a radius of 25 mm are designed. In that case, the phase velocity of A1 and S2 waves are 8.9275 km/s and 14.0845 km/s, respectively. With the help of Eq. 3 and the quantitative relations between the phase velocity and the plate thickness shown in Figure 1, the thickness variation of the lens with the radius can be calculated. The refractive index and the corresponding thickness variations of A1 and S2 modes along the radius direction are shown in Figure 3. To simplify the modeling, also facilitate the specimen preparation, continuous thickness variation of the theoretically designed Luneburg lens is discretized into ten sections with equal height variation in the radius direction. The phase velocity of the S2 wave at 1.9 MHz in Figure 1 has a more dramatic variation tendency with the plate thickness than the A1 wave at 1 MHz. Therefore, the thickness of the S2-wave-based Luneburg lens is smaller than that of the A1-wave-based Luneburg lens.
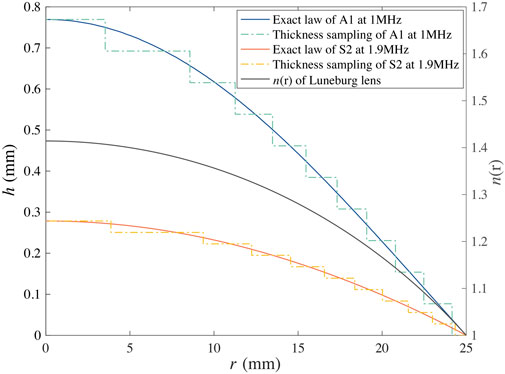
FIGURE 3. The variations of the refractive index and the thickness of the A1-wave-based Luneburg lens and S2-wave-based Luneburg lens along the radius direction. The black curve is the refractive index of the Luneburg lens. Blue and orange curves are the theoretical thickness profiles of the A1-wave-based Luneburg lens at 1 MHz and the S2-wave-based Luneburg lens at 1.9 MHz, respectively, and the discretized profiles are represented by the green and yellow dot-lines.
To validate the focusing ability of the Luneburg lenses designed, the FEM simulations in the time and frequency domains are carried out with the aid of COMSOL Multiphysics software. The schematic of the computational model used for the analysis is shown in Figure 4, where Figure 4A is the schematic model for the time domain analysis, and Figure 4B is the schematic model for the frequency domain analysis. The S2-wave-based Luneburg lens or the A1-wave-based Luneburg lens, constructed by ten concentric cylinders according to Figure 3, is built with its center at (0,0,0), with the same material as the aluminum plate. The calculation region of the plate is divided into finite elements, and to obtain reliable results, the element size is set to be smaller than one-eighth of the minimum wavelength of the designed higher-order mode. The time step is set according to the mesh size and time step length (Courant–Friedrichs–Lewy number lower than 0.2) to obtain the optimal solution. Low reflection boundary conditions are applied to the edge of the plate in the time domain analysis, and perfectly matched layers (PMLs) of length 2λ are connected to the edge in the frequency domain analysis to eliminate unwanted reflected waves from the boundaries.
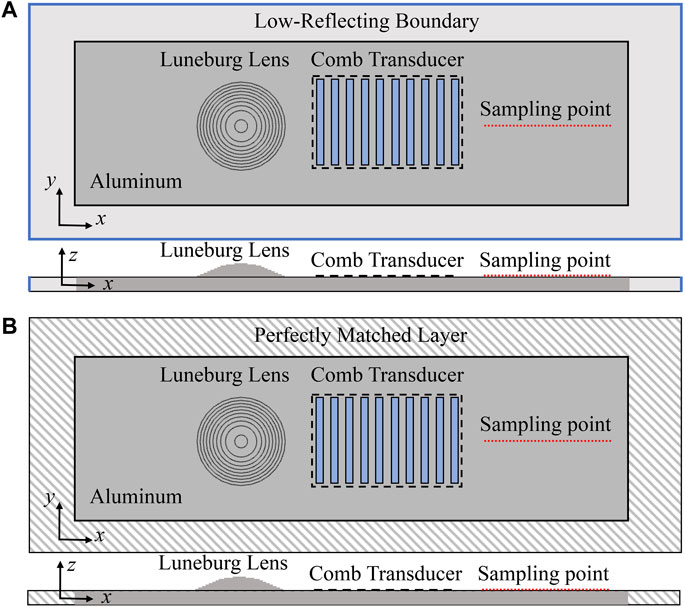
FIGURE 4. Schematic of the FEM model in a top view and side view: (A) the time domain analysis, (B) the frequency domain analysis.
To observe the focusing ability of the Luneburg lens for the designed modes at a specific frequency, the pure mode of the Lamb wave is generated by implementing a comb transducer. A typical comb transducer is an acoustic buffer with periodic teeth applied to the test samples, a spatial modulation technique. The activated mode lies on the intersecting points between the dispersion curves of Lamb waves and the line, where the slope of the line depends on the element spacing. The detailed feature of a comb transducer has been studied by Viktorov [29] and Rose [30–33], and according to the principle that the comb transducer requires, the element spacing ls can be calculated according to the phase velocity c of the generated mode and the excitation frequency f0 of the comb transducer, i.e.,
Based on the lenses designed in this paper, the element spacing ls of the comb transducer used for generating A1 mode at 1 MHz is 8.93 mm, and S2 mode at 1.9 MHz is 7.41 mm. Ten elements located 50 mm away from the Luneburg lens center are implemented, such as in Figure 4. Moreover, the duty ratio of the comb transducer is set at 0.5 to achieve the maximal excitation efficiency. The boundary load with 15 cycles of Gaussian windowed tone-burst signal is applied at the transducer region with the direction vertical to the plate surface, which is used to simulate the excitation of the comb transducer.
Here, to prove the generation efficiency for pure A1 and S2 waves from the comb transducer, the two-dimensional Fourier transform is applied to the out-of-plane displacements, sampling from 512 points at the plate surface with the sampling interval 0.1 mm on the right side of the comb transducer. The numerical data in the f-c domain with the theoretical dispersion curves of the Lamb wave in an aluminum plate are shown in Figure 5. The highlighted part in the f-c spectrum represents the generated mode, showing that the narrowband Lamb mode of the desired mode is generated successfully with the help of the comb transducer and the 15 cycles Gaussian windowed tone-burst signal. Although other modes with small amplitudes near the center frequency are generated, A1 or S2 wave is still the dominant mode propagating in the plate, and the effect of other modes can be ignored.
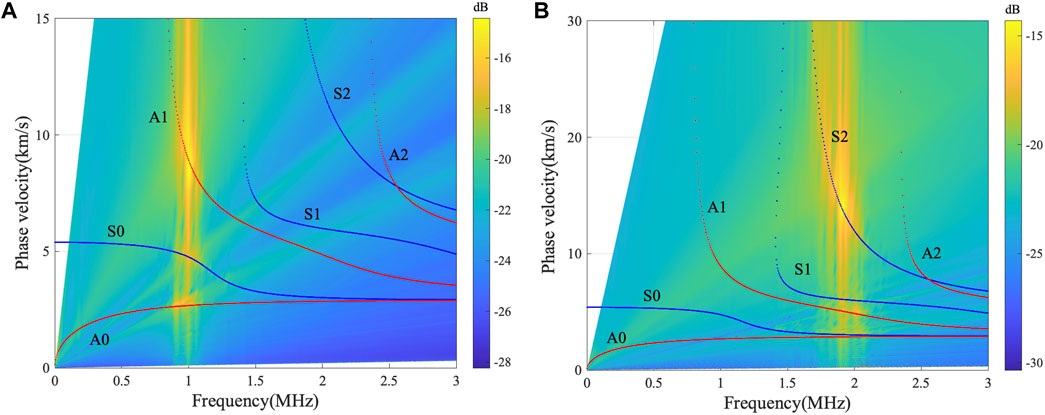
FIGURE 5. The dispersion curves and the two-dimensional Fourier transform results from FEM models: (A) the A1 wave at 1 MHz, (B) the S2 wave at 1.9 MHz. The red and blue curves are corresponding to the anti-symmetric modes and symmetric modes of the Lamb wave, respectively.
Out-of-plane displacement wave fields at some specific time instants are displayed to observe the focusing phenomenon, such as the A1-wave-based Luneburg lens at 1 MHz in Figure 6 and the S2-wave-based Luneburg lens at 1.9 MHz in Figure 7. As shown in Figure 6A and Figure 7A, the plane A1 wave or S2 wave with a tiny and ignorable disturbance propagates along both +x and −x directions. Waves propagating near the lens edge region are faster than that across the lens center, which makes the wavefront bend towards the lens center and finally focus at the opposite point on edge, such as Figures 6B, 7B. After that, the A1 wave or S2 wave will emit from the focusing point, e.g., the out-of-plane displacement distribution in Figures 6C, 7C. The A1 or S2 wave propagation process clearly shows the focusing phenomenon of the Luneburg lenses designed.
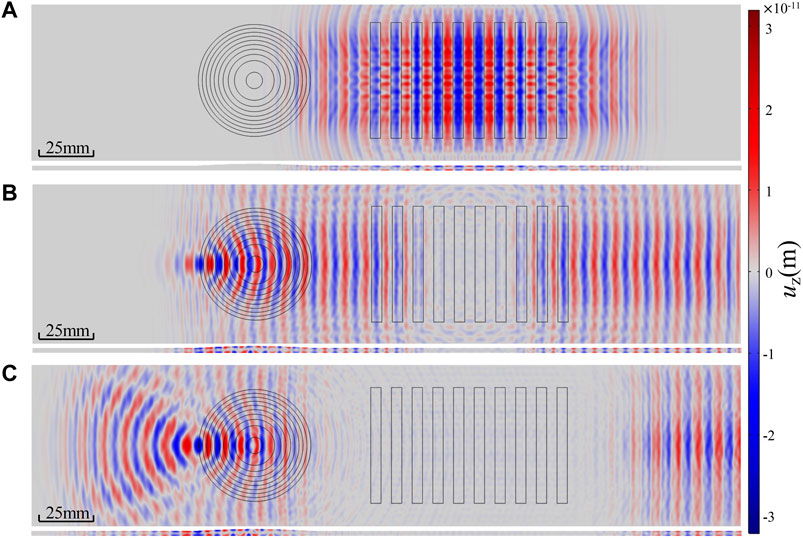
FIGURE 6. The focusing phenomenon of the A1-wave-based Luneburg lens at 1 MHz: (A) t = 15
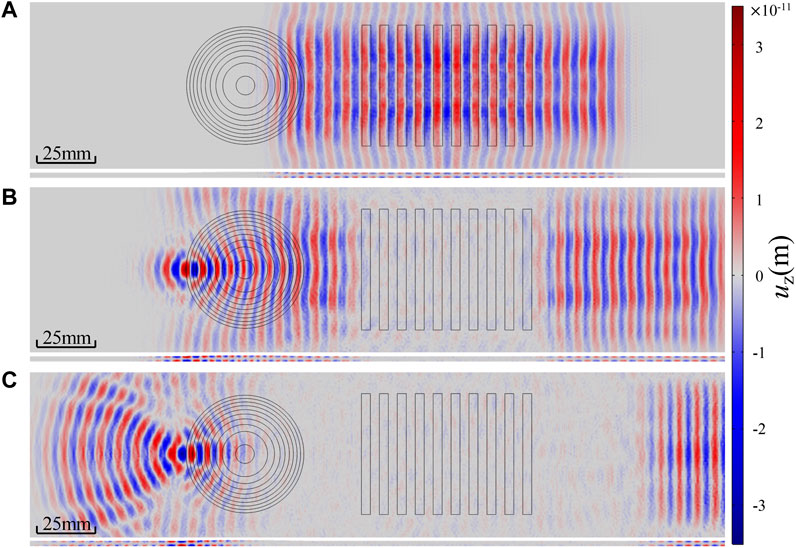
FIGURE 7. The focusing phenomenon of the S2-wave-based Luneburg lens at 1.9 MHz: (A) t = 15
The frequency domain analysis is also performed for quantitative investigations and further checking the focusing ability of the Luneburg lens for higher-order Lamb waves. The boundary load with the force of 100 N/m2 is applied at the transducer region with the direction vertical to the plate surface to simulate the comb transducer excitation. Figures 8A, B show the spatial energy distribution represented by |uz| of the A1-wave-based Luneburg lens at 1 MHz and the S2-wave-based Luneburg lens at 1.9 MHz, respectively, from which the wave energy focusing phenomenon is extremely evident, i.e., the energy is successfully focused at the lens edge as expected. Also, the amplitude is greatly amplified compared with the corresponding regions on the right of the comb transducer.
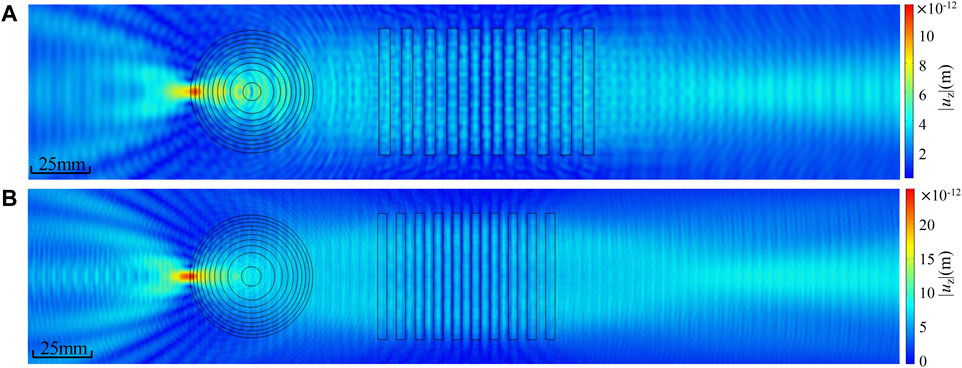
FIGURE 8. Spatial energy distribution represented by |uz| of (A) the A1-wave-based Luneburg lens at 1 MHz, and (B) the S2-wave-based Luneburg lens at 1.9 MHz.
Near the focusing point, the |uz|2 value is extracted, and its spatial variations along the x and y directions are illustrated in Figures 9A,C and B,D, respectively. By contrast, the |uz|2 value in the right regions of the comb transducers without lenses is mirrored and also displayed in Figure 9. Generally speaking, the wave focusing phenomenon is validated once again. Theoretically, the A1 or S2 wave focuses at (−25 mm, 0) after it travels across the lens. However, the |uz|2 value achieves the maximum, respectively at (−22.2 mm, 0) for the A1 wave and (−24.1 mm, 0) for the S2 wave, a little deviated from the theoretical prediction. Two main issues may lead to the slight difference. One is the discretized variation of the lens thickness, and the other is the incident quasi-plane wave generated by the comb transducers. Even though the deviation, smaller than one wavelength, is acceptable.
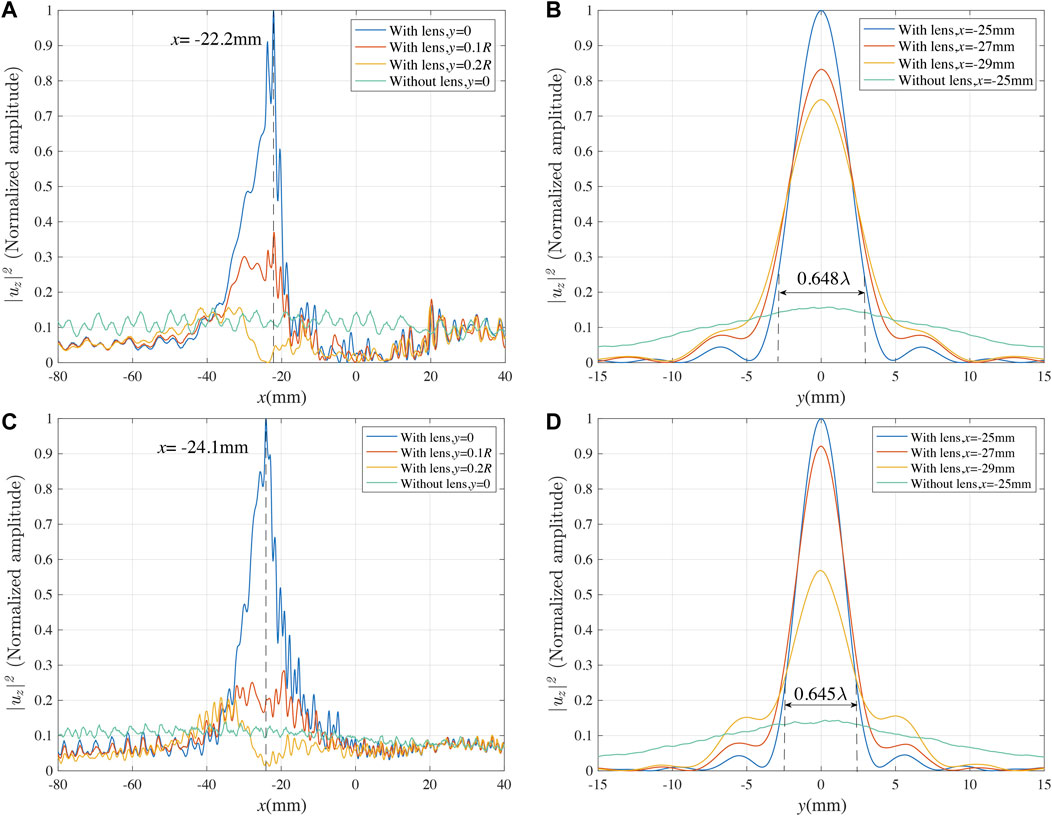
FIGURE 9. The spatial distribution of |uz|2 along the x and y directions: (A) and (B) correspond to the A1-wave-based Luneburg lens at 1 MHz; (C) and (D) correspond to the S2-wave-based Luneburg lens at 1.9 MHz.
The focusing size in the y direction is evaluated by using the −3 dB attenuation of the displacement amplitude |uz|, the quarter of maximal |uz|2 [27], and shown in Figures 9B, D. Specifically, the focusing sizes for the A1-wave-based Luneburg lens and the S2-wave-based Luneburg lens are 0.648λ and 0.645λ, respectively, both smaller than one corresponding wavelength, which efficiently proves the excellent focusing ability of the Luneburg lens for the higher-order Lamb waves at the designed frequency.
In conclusion, a design scheme for focusing the higher-order Lamb waves, based on the sensitivity of the phase velocity with the plate thickness, is introduced. To examine the feasibility of this methodology, two lenses, i.e., the A1-wave-based Luneburg lens and the S2-wave-based Luneburg lens, are designed via different thickness variations. The analysis in the time and frequency domains clearly shows the excellent focusing phenomenon for higher-order Lamb waves. This design method and the outcomes in this paper provide theoretical foundations for wave manipulation and energy harvesting, as well as the receiving and application of higher-mode Lamb waves in SHM.
As a final remark, this paper presents a general design scheme for focusing higher-order Lamb waves, although the Luneburg lens is designed for a single and fixed working frequency. Any higher-order mode, not limited by A1 and S2 waves, can be focused using this method as long as its phase velocity is sensitive to the plate thickness. For example, this method is suitable for all higher-order modes if the operating frequency is near their cut-off frequencies. However, if the working frequency is far from the cut-off frequencies, the phase velocities of these modes approach the inherent shear wave, insensitive to the thickness, and thus not be adopted for the lens design. It should be pointed out that other lenses can also be constructed using the present method, such as Maxwell’s fisheye lens, the concentrator lens, and other gradient index lenses. We expect this method and the Luneburg lenses designed for high-order Lamb waves will stimulate future experimental work and extend their practical engineering applications.
The raw data supporting the conclusion of this article will be made available by the authors, without undue reservation.
TY: Methodology (lead); Formal analysis (lead); validation (lead); Writing—original draft (lead). SZ: Project administration (lead); Writing-review and editing (equal). XD: supervision (lead); JL: funding acquisition (lead); Writing-review and editing (equal). All authors contributed to the article and approved the submitted version.
Sponsored by Shanghai Pujiang Program.
The authors declare that the research was conducted in the absence of any commercial or financial relationships that could be construed as a potential conflict of interest.
All claims expressed in this article are solely those of the authors and do not necessarily represent those of their affiliated organizations, or those of the publisher, the editors and the reviewers. Any product that may be evaluated in this article, or claim that may be made by its manufacturer, is not guaranteed or endorsed by the publisher.
1. Cawley P, Alleyne D. The use of Lamb waves for the long range inspection of large structures. Ultrasonics (1996) 34:287–90. doi:10.1016/0041-624X(96)00024-8
2. Wilcox PD, Lowe MJS, Cawley P. Mode and transducer selection for long range lamb wave inspection. J Intell Mater Syst Struct (2001) 12:553–65. doi:10.1177/10453890122145348
3. Rose JL. A baseline and vision of ultrasonic guided wave inspection potential. J Press Vessel Technol (2002) 124:273–82. doi:10.1115/1.1491272
4. Kudela P, Radzienski M, Ostachowicz W, Yang Z. Structural Health Monitoring system based on a concept of Lamb wave focusing by the piezoelectric array. Mech Syst Signal Process (2018) 108:21–32. doi:10.1016/j.ymssp.2018.02.008
5. Malinowski P, Wandowski T, Trendafilova I, Ostachowicz W. A phased array-based method for damage detection and localization in thin plates. Struct Health Monit (2009) 8:5–15. doi:10.1177/1475921708090569
6. Deutsch WAK, Cheng A, Achenbach JD. Self-focusing of Rayleigh waves and lamb waves with a linear phased array. Res Nondestructive Eval (1997) 9:81–95. doi:10.1080/09349849709409609
7. Kim H, Jhang K, Shin M, Kim J. A noncontact NDE method using a laser generated focused-Lamb wave with enhanced defect-detection ability and spatial resolution. NDT E Int (2006) 39:312–9. doi:10.1016/j.ndteint.2005.09.001
8. Jhang KY, Shin MJ, Lim BO. Application of the laser generated focused-Lamb wave for non-contact imaging of defects in plate. Ultrasonics (2006) 44:1265–8. doi:10.1016/j.ultras.2006.05.080
9. Yan X, Zhu R, Huang G, Yuan F-G. Focusing guided waves using surface bonded elastic metamaterials. Appl Phys Lett (2013) 103:121901. doi:10.1063/1.4821258
10. Tol S, Degertekin FL, Erturk A. Gradient-index phononic crystal lens-based enhancement of elastic wave energy harvesting. Appl Phys Lett (2016) 109:063902. doi:10.1063/1.4960792
11. Tian Y, Tan Z, Han X, Li W. Phononic crystal lens with an asymmetric scatterer. J Phys D Appl Phys (2019) 52:025102. doi:10.1088/1361-6463/aae679
12. Tol S, Degertekin FL, Erturk A. Phononic crystal Luneburg lens for omnidirectional elastic wave focusing and energy harvesting. Appl Phys Lett (2017) 111:013503. doi:10.1063/1.4991684
13. Jin Y, Torrent D, Pennec Y, Pan Y, Djafari-Rouhani B. Simultaneous control of the S 0 and A 0 Lamb modes by graded phononic crystal plates. J Appl Phys (2015) 117:244904. doi:10.1063/1.4923040
14. Climente A, Torrent D, Sánchez-dehesa J. Sound focusing by gradient index sonic (2016) 104103. doi:10.1063/1.3488349
15. Lefebvre G, Dubois M, Beauvais R, Achaoui Y, Ing RK, Guenneau S, et al. Experiments on Maxwell’s fish-eye dynamics in elastic plates. Appl Phys Lett (2015) 106:024101. doi:10.1063/1.4905730
16. Tian Z, Yu L Rainbow trapping of ultrasonic guided waves in chirped phononic crystal plates. Sci Rep (2017) 1:1–7.
17. Wang DF, Wang YH, Chuang KC. Nearly-isotropic adjustable phononic crystal lenses using concentrated balls with Hertz contacts. Phys Lett A (2021) 396:127240. doi:10.1016/J.PHYSLETA.2021.127240
18. Ren B, Lissenden CJ. Ultrasonic guided wave inspection of adhesive bonds between composite laminates. Int J Adhes Adhes (2013) 45:59–68. doi:10.1016/j.ijadhadh.2013.04.001
19. Lanza di Scalea F, Rizzo P, Marzani A. Propagation of ultrasonic guided waves in lap-shear adhesive joints: Case of incident a0 Lamb wave. J Acoust Soc Am (2004) 115:146–56. doi:10.1121/1.1630999
20. Lee T, Choi I, Jhang K. The nonlinearity of guided wave in an elastic plate. Mod Phys Lett B (2008) 22:1135–40. doi:10.1142/S0217984908015966
21. Lissenden C. Use of non-linear ultrasonic guided waves for early damage detection Use of non-linear ultrasonic guided waves for early damage detection (2015). doi:10.1784/insi.2015.57.4.206
22. Hong M, Su Z, Wang Q, Cheng L, Qing X. Modeling nonlinearities of ultrasonic waves for fatigue damage characterization: Theory, simulation, and experimental validation. Ultrasonics (2014) 54:770–8. doi:10.1016/j.ultras.2013.09.023
23. Wang Y, Guan R, Lu Y Nonlinear Lamb waves for fatigue damage identification in FRP- reinforced steel plates, 80 (2017). p. 87–95. doi:10.1016/j.ultras.2017.05.004
24. Ye T, Biwa S, Mori N. Second-harmonic generation of the lowest-order antisymmetric Lamb wave at a closed parallel crack. J Acoust Soc Am (2020) 148:2073–85. doi:10.1121/10.0002171
26. Climente A, Torrent D, Sánchez-Dehesa J. Gradient index lenses for flexural waves based on thickness variations. Appl Phys Lett (2014) 105:064101. doi:10.1063/1.4893153
27. Li P, Biwa S. The SH0 wave manipulation in graded stubbed plates and its application to wave focusing and frequency separation. Smart Mater Struct (2019) 28:115004. doi:10.1088/1361-665x/ab3ef0
28. Fuentes-Domínguez R, Yao M, Colombi A, Dryburgh P, Pieris D, Jackson-Crisp A, et al. Design of a resonant Luneburg lens for surface acoustic waves. Ultrasonics (2021) 111:106306. doi:10.1016/j.ultras.2020.106306
29. Viktorov IA, Mason WP. Rayleigh and Lamb waves: Physical theory and applications. New York: Plenum Press (1967).
30. Rose JL. Ultrasonic comb transducer for smart materials. in, Proceedings Volume 3321, 1996 Symposium on Smart Materials, Structures, and MEMS; (1998) (1998), V. K. Aatre, V. K. Varadan, V. v. Varadan, 636–43. doi:10.1117/12.305600
31. Rose JL, Pelts SP, Quarry MJ. A comb transducer model for guided wave NDE. Ultrasonics (1998) 36:163–9. doi:10.1016/S0041-624X(97)00042-5
32. Pelts SP, Jiao D, Rose JL. Comb transducer for guided wave generation and mode selection. Proc IEEE Ultrason Symp (1996) 2:857–60. doi:10.1109/ULTSYM.1996.584128
Keywords: higher-order Lamb waves, Luneburg lens, refractive index, wave focusing phenomenon, ultrasound
Citation: Ye T, Zhou S, Du X and Liu J (2023) Focusing higher-order Lamb waves based on the Luneburg lens. Front. Phys. 11:1128265. doi: 10.3389/fphy.2023.1128265
Received: 20 December 2022; Accepted: 24 February 2023;
Published: 21 April 2023.
Edited by:
Zhixiong Gong, Shanghai Jiao Tong University, ChinaReviewed by:
Kuo-Chih Chuang, Zhejiang University, ChinaCopyright © 2023 Ye, Zhou, Du and Liu. This is an open-access article distributed under the terms of the Creative Commons Attribution License (CC BY). The use, distribution or reproduction in other forums is permitted, provided the original author(s) and the copyright owner(s) are credited and that the original publication in this journal is cited, in accordance with accepted academic practice. No use, distribution or reproduction is permitted which does not comply with these terms.
*Correspondence: Shengzeng Zhou, MTM1MDE4NzAyMTdAMTM5LmNvbQ==
Disclaimer: All claims expressed in this article are solely those of the authors and do not necessarily represent those of their affiliated organizations, or those of the publisher, the editors and the reviewers. Any product that may be evaluated in this article or claim that may be made by its manufacturer is not guaranteed or endorsed by the publisher.
Research integrity at Frontiers

Learn more about the work of our research integrity team to safeguard the quality of each article we publish.