
94% of researchers rate our articles as excellent or good
Learn more about the work of our research integrity team to safeguard the quality of each article we publish.
Find out more
ORIGINAL RESEARCH article
Front. Phys., 09 February 2023
Sec. Biophysics
Volume 11 - 2023 | https://doi.org/10.3389/fphy.2023.1127081
 Ping-Han Chung
 Szu-I Yeh*
Herein, the pressure-sensitive paint (PSP) was used to quantitatively investigate the aerodynamic effect of an alula-like vortex generator, which is a bio-inspired passive flow control structure. The global pressure distributions on the upper surface at different angles of attack were measured to determine the strength of sectional suction forces on the wing. An alula-like vortex generator equipped at the leading edge of the wing enlarged the area of the suction region (negative pressure coefficient) on the upper surface in both the streamwise and spanwise directions under near-stall and deep-stall conditions, which is related to the generation of lift and avoiding the stall of wing. A wing model equipped with a vortex generator of an 11% height/chord length ratio exhibited the greatest performance at all angles of attack. In this study, the use of PSP technique not only helps to understand the aerodynamic effect of the alula-like vortex generator but also shows a perspective tool for bio-inspired MAVs design.
The development of micro air vehicles (MAVs) motivates the study of the flapping aerodynamics (revolving/sweeping motion and stroke reversal) of natural flyers [1–4]. Unsteady large-scale vortex structures are produced near the leading and trailing edges to produce the suction regions on the lifting surface during flapping flight. If vortex bursting occurs on the outer spanwise locations of wings with a high aspect ratio (AR), it has a greater effect on lift than on thrust [5]. For the flying creatures in nature, there are various ways to control the occurrence of vortex busting, which include the special wing structures, feature morphology, and wing kinematics.
Passive (vortex generators, VGs) and active (modulated pulse jet vortex generator [6, 7] and jet actuator [8]) flow control techniques are both well developed in the fixed-wing aircraft design. For birds, one of the common special wing structures for flow control is alula, which is a small group of feathers attached to the leading edge of a bird’s wing (Figure 1) and usually acts as a flow control device. The Its function is similar to that of an extended leading-edge slat or a VG on an aircraft. The function of alula has been known from previous studies [9–12]. A small streamwise vortex is formed at the tip of the alula which delays a stall and increases lift at slow speeds, and in steep descents during a glide-assisted landing. Longer alula on heavier birds forms the streamwise vortex further from the main wing, which suppresses flow separation at high angles of attack [13].
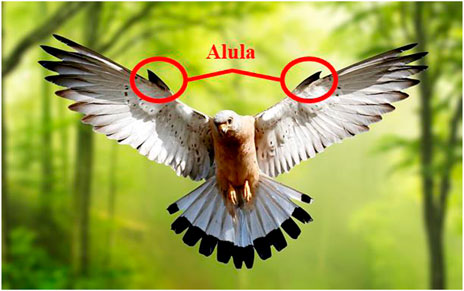
FIGURE 1. Alula at the front of the wing which could be seen during flight. Image was taken from Pixabay under the Creative Commons (CC0).
The geometry and dimensions of vortex generators (VGs) were studied for a long time [14–16]. VGs that are positioned at an incidence angle to the local flow act as a passive flow control device by drawing high-energy freestream fluid down to the wing’s surface. The dominant geometric factors are the height, the length and the position of the VG. Near-wall flow inhibits flow separation and up-sweep flows are attenuated. To reduce the number of VGs, Ichikawa et al. [17] showed that increasing the height of a VG generates strong vortices, so is an increase in drag. Note that there is limited data with regard to the effect of VGs on a wing in the flow at low Reynolds number (less than 2 × 10⁵) [18, 19]. In recent years, some researchers have tried to investigate the effect of installing vortex generator on MAVs [20, 21]. Applying bio-inspired design of VG to MAVs is a interesting topic that has not been studied yet. The aerodynamic effect of an alula-like VG was investigated by either particle image velocimetry (PIV) and oil-film experiment in a wind tunnel or numerical simulations [22, 23]. However, there is still no information on the global surface pressure distribution due to a restriction of pressure tube installation for a thin wing.
Pressure-sensitive paint (PSP) is a non-invasive measurement technique which provides the global pressure field on the surface of a model [24, 25]. PSP contains the luminescence molecules that are dissolved in a chemical solvent with the polymer binder. The intensity of the emissions from PSP that is illuminated by a light source is inversely proportional to the magnitude of the pressure on the local surface. The global surface pressure patterns are determined based on static and in situ calibration [26]. The development of PSP technique benefits the understanding on aerodynamics studies and has been successfully and widely applied in the experiments with high-speed flow [27]. However, restricted by the pressure sensitivity of PSP, this technique is rarely used in a low-speed wind tunnel and is still worth to develop in different applications [28–30].
In this study, a bio-inspired passive flow control structure was studied. An alula-like VG, designed with reference to the geometry and configuration of birds, was positioned at a quarter wing span as a simplified wing model. PSP technique is utilized to obtain the global pressure distribution on the upper surface of the wing. Three different flight conditions (pre-stall, near-stall, and deep-stall) were tested for different angles of attack. These pressure distributions were used to determine the strength of the suction forces that are caused by a wing with/without the installation of an alula-like VG. The information shown in this study not only provides the further understanding of wing-alula interaction but also can be used as a concept of passive flow control for bio-inspired MAV design.
The test model utilized in this study is a flat plate with and without the alula-like VG. The schematic diagram of the test model is shown in Figure 2A and the geometric dimensions of the test model are shown in Table 1. A T6061 aluminium flat plate without a VG is denoted as the baseline case. The size of flat plate is 100 mm (chord length, c) × 400 mm (span, b) × 5 mm (thickness) and the corresponding AR is 4. A wing model with an AR of 4 is similar to the value for the wing of a hummingbird, which requires less power to hover [31]. The size of the wing model ensures that the blockage ratio of the wind tunnel test is less than 1.5% at all angles of attack testing in this study.
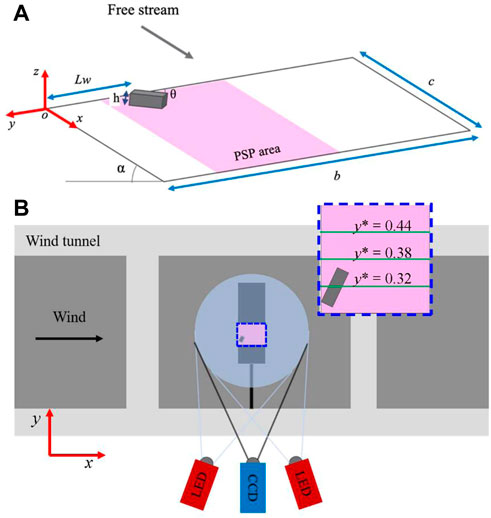
FIGURE 2. (A) Schematic diagram of the wing model with an alula-like vortex generator and the PSP measurement area. (B) Side view of the PSP measurement system configuration.
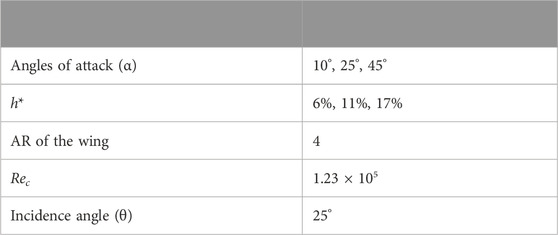
TABLE 1. The geometric parameters, kinematic parameters, and the relative dimensionless parameters of the test model.
The geometric dimensions of the alula-like VGs are based on several previous studies. Wang and Ghaemi [32] determined that a rectangular or vane-type VG gives the greatest improvement in flow mixing. The Alula-like VGs tested in this study are all rectangular shaped. The VGs are made of Poly Lactic Acid (PLA) and were 3D printed using a PING DUAL-300 FDM3D printer (Taiwan) which has a net build volume of ∅300 mm × H270 mm and the resolution of 0.05 mm per layer. The size of the VGs is 11.5 mm (chord length) × 35.0 mm (span) with different heights. The heights of the VGs were represented by the dimensionless height h* which is the ratio between the height (h) and the chord length (c) of the VG. The value of h* test in this study is 6% (VG1), 11% (VG2), and 17% (VG3). The right-front edge of the VG was positioned at the leading edge of the wing. For an airfoil at low Reynolds number (Re ≈ 1.6 × 10⁵), Seshagiri et al. [19] determined that an incidence angle, θ, of 25° gives better performance than a value for θ of 15°. Linehan and Mohseni [33] showed that the typical spanwise positions for the alula of real birds are in the range of y* ≈ 0.23–0.36 with the AR ranged from 4 to 6. In this study, all alula-like VGs were mounted at an angle of 25° and were all aligned along the leading edge of the test model and located at y* = 0.26, here y* (=y/b) is the relative distance to the wing root in the spanwise direction.
Linehan and Mohseni [33] also showed that the stall angle for a rectangular flat plate is approximately 23°. Therefore, the angle of attack, α, tested in this study is 10°, 25°, and 45° which represent the pre-stall, near-stall, and deep-stall conditions, respectively. The schematic of the PSP measurement system in the wind tunnel is shown in Figure 2B. An epoxy screen layer (SCR-100) was used to mask machining marks and stains. The PSP was painted onto the upper surface of the model (suction side), and the measured region is located from y* = 0.23 to y* = 0.50 as shown in Figure 2. Despite the measurement of the full-field pressure distribution, to understand the influence of the alula-like VG, the variation of the pressure coefficient along the streamwise direction at y* = 0.32, 0.38, and 0.44 are also determined. Note that the VG was located at x* = 0–0.26 and y* = 0.26–0.35.
All the experiments were conducted in a close-loop low-speed wind tunnel in the Aerospace Science and Technology Research Center of the National Cheng Kung University (ASTRC/NCKU). The wind tunnel contains a honeycomb and five screens upstream of a nozzle with a contraction ratio of 9. The constant-area test section is 1.2 m (height) × 1.8 m (width) and is 2.75 m long. The facility consists of a 450 HP fan (Flakt, FAC-6-280-10-12, Herne, Germany) and an inverter (Fuji medium-voltage IGBT, FRENIC4600FM5e, Tokyo, Japan).
The operated speed of the wind speed, V, ranges from 3 to 67 m/s and is determined by the differential pressure between the inlet and the exit of the contraction section using a GP50 low range differential pressure transducer (Model 216-C-SZ-CA/LB; range = 0–2.6 kPa; static accuracy = ±0.2%FS, Grand Island, New York). In this study, the testing velocity of freestream is 20 ± 2 m/s and the corresponding turbulence intensity is approximately 0.3%. Three repeated runs for each test cases were conducted on different days. The Reynolds number based on the chord length of model and the testing condition, Rec, is 1.23 × 10⁵.
As shown in Figure 2B, two excitation light-emitting diode (LED) light sources were used to illuminate the PSP coated surface and the emitted signal was captured by a Charge Coupled Device (CCD) camera. The intensity of the emission is inversely proportional to the partial pressure of oxygen, which is related to the local surface pressure on the test model. The CCD camera used in this study is 14-bit resolution on gray scale. For PSP calibration and wind tunnel testing, the light intensity on the test model is under control at the grey scale ranging from 12,000 to 14,000 (80% of light limitation). The UniFIB PSP utilized in this study were purchased from ISSI Co. (Dayton, Ohio). It is a blend of Fluoro/Isopropyl/Butyl polymer (FIB), Platinum tetra (pentafluorophyenyl) porphine (PtTFPP) and white pigment. The respective ab-sorption and emission spectra for UniFIB PSP are 380–520 nm and 620–750 nm. The response time that is quoted by the manufacturer is 300 ms. It means that the paint cannot be used to detect unsteady flow separation.
Figure 3A shows the pressure calibration setup which was conducted in a chamber with a pressure transducer (Validyne DP103-24, range = ±2.2 kPa; Northridge, California). The paint was excited by using two 2100-lumen LED lamps (Revox SLG-55, Kanagawa, Japan) with a 550-nm short-pass optical filter. A 14-bit scientific-grade CCD camera (PCO Pixelfly, Kelheim, Germany; 1,392 × 1,040 pixels; 1 pixel ≈0.21 mm) with a 600-nm long-pass optical filter was used to acquire luminescent images. The exposure time is 300 ms, as suggested by ISSI Co. The Stern–Volmer equation is shown in Eq. 2.1.
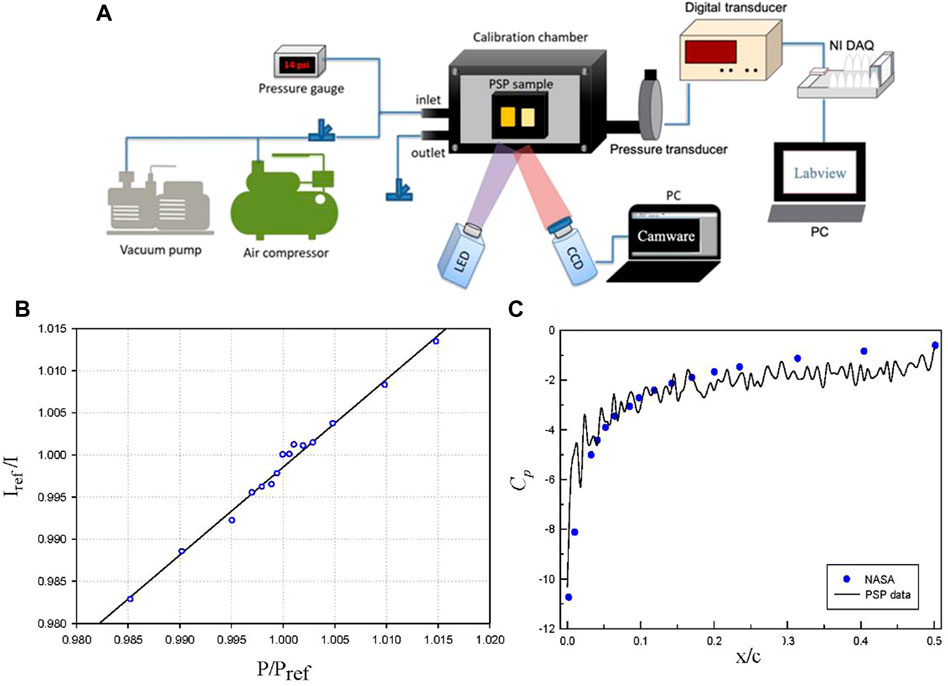
FIGURE 3. (A) Schematic diagram of the PSP calibration setup. (B) The Calibration curve for UniFIB PSP at a temperature of 26°C. (C) The validation of UniFIB PSP by measuring the pressure coefficient for a NACA0012 airfoil at the freestream velocity of 40.0 m/s and an angle of attack of 15°.
The calibration curve is determined using 64 images with the reference conditions at ambient pressure and 26°C, where A(T) and B(T) are temperature-dependent coefficients.
The calibration curve, Figure 3B, shows a linear relationship between the intensity ratio for the luminescence, Iref/I, and the pressure ratio, p/pref. The value for B(T) (or pressure sensitivity) is 1.04%/kPa. Thermal quenching causes the value of Iref/I to decrease as temperature increases. Temperatures were recorded during the calibration using a K-type thermocouple (Omega; accuracy = ±0.1°C, Norwalk, Connecticut). The reference intensity, Iref, was recorded by taking the wind-off (post-run) images which were captured immediately after the wind tunnel was shut down. The temperature sensitivity of the PSP sensor is 0.4%/°C. In this study, the Cp values of each test was calculated from 64 images captured consecutively. An in-house Matlab code, including a median filter function (removing noise from an image) and speeded up robust features (image registration) were utilized for these images procession which transformed the luminescent intensity to pressure data by using the calibration curve shown in Figure 3A.
The PSP technique determined the global pressure distribution on the upper surface of the wing model. The local pressure coefficient, Cp, and the sectional suction force coefficient, CN,l, are able to be analyzed through the pressure distribution, which are defined as:
where p∞ is the static pressure of the freestream and the dynamic pressure q∞ is determined using a Pitot-static probe.
To determine the uncertainty of the PSP measurement system used in this study, a NACA0012 airfoil was tested in the wind tunnel at the velocity of 40 m/s and an angle of attack of 15°. The variation of the pressure coefficient along the chordwise direction is shown in Figure 3C which agrees reasonably well with the experimental data from NASA [34]. The average error, standard deviation of measurement, for the PSP sensor is determined by Eq. 2.4 and the value of σ is 0.17, in which the value of Cp ranges from −0.62 to −10.76.
To verify the flow field deduced from the surface pressure distribution, surface oil-flow visualization was also used to locate flow separation and reattachment [35]. This study used a mixture composed of kerosene, lubricant oil (5W 20), titanium dioxide, and oleic acid with a ratio of 67:20:12:1 in weight. The mixture was painted via lightly brushing on the surface of model before experimental process and then the fan was turned on. When the surface oil flow streaks were properly established, the wind tunnel was shut down. Images were immediately recorded using a digital camera.
Viscous forces are increasingly more important than inertial forces and the boundary-layer physics varies for Reynolds number less than 106. Due to viscous effect, the flow for a flat plate at a high angle of attack separates on the upper surface that is very close to the leading edge. Breuer and Jovicic [36] determined that there is a gentle pressure distribution near the leading edge. The flow pass through a flat plate is dominated by the shedding behaviour of the trailing edge vortex. Figure 4 shows the surface oil flow pattern of the wing model without the installation of a VG at α = 25° (near-stall condition). The leading-edge flow separation is shown, and the flow reattachment is observed at x* ≈ 0.83–0.90. However, there is no flow reattachment in the case for α = 45° (open separation).
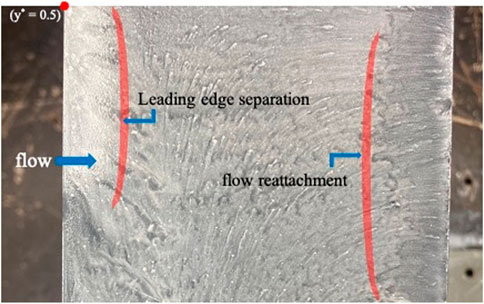
FIGURE 4. Surface oil flow pattern for the baseline case at α = 25°.
The surface pressure distributions that are measured using PSP for the model with/without the installation of a VG at different angles of attack are shown in Figure 5. For the baseline case, the region with strong suction is measured near the leading edge at a low angle of attack (α = 10°, Figure 5A), followed by a pressure recovery process and a slightly adverse pressure gradient near the trailing edge. As the angle of attack increases (α = 25°, Figure 5B), the size of suction region near the leading edge grows which leads to an increase in lift. Note that there is a reduction in low-pressure region and the area with the adverse pressure gradient increases under a deep-stall condition (α = 45°, Figure 5C). It represents the flow totally separates and is consistent with the surface oil flow visualization.
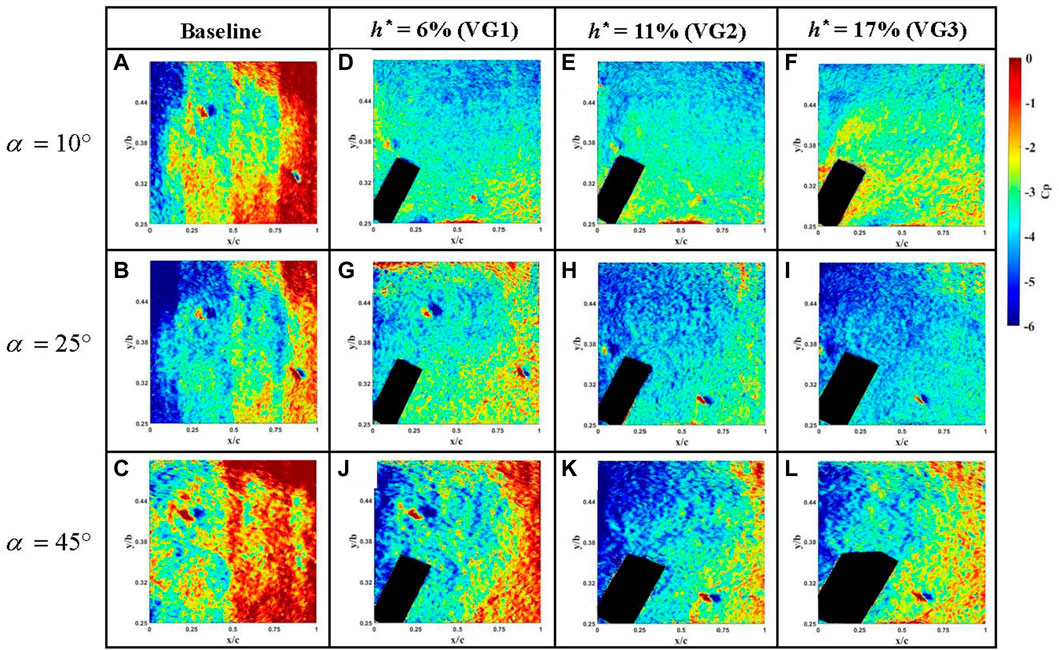
FIGURE 5. Surface pressure distributions with/without the alula-like vortex generator at different angles of attack: (A–C) Without the alula-like vortex generator, and (D–L) with different thicknesses of the alula-like vortex generators.
The function of a VG is to maintain the lift by energizing the flow in the boundary layer and delaying flow separation on the upper surface [14]. The effectiveness of the VG depends on the value of h*, which is related to the effective mixing region [19]. Therefore, VGs with different thickness were tested in different angles of attack. For a pre-stall condition (α = 10°), the surface pressure distributions on the upper surface of a flat plate with an alula-like VG are shown in Figures 5D–F. The distributions of the surface pressure in the measurement region are shown for the three different VGs. There is almost no suction near the leading edge and also no adverse pressure gradient near the trailing edge. The deployment of VG3 (h* = 17%) results in higher pressure (or less lift) than that the use of VG1 (h* = 6%) or VG2 (h* = 11%).
When the angle of attack is increased near a stall condition (α = 25°, Figures 5G–I), a thicker VG results in an extension in low-pressure region. Under a deep-stall condition (α = 45°), the VG1 maintains the suction force near the leading edge and also helps to delay the generation of the adverse pressure gradient near the trailing edge (Figure 5J). An alula-like VG prevents flow separation and enhances the generation of lift. The deployment of VG2 or VG3 on the model both creates a larger area with strong suction. Adverse pressure gradient is also barely shown (Figures 5K, L). There is larger vortical structure for flow separation control (α = 25° and 45°) as the height of VG increases. The surface pressure distribution for the model with VG2 enlarges the area of the strong suction region in the streamwise direction. This implies that the VG2 helps to maintain the strength of the leading vortical structure in both the streamwise and the spanwise directions, which is related to the generation of lift. The surface oil flow visualization in Figure 6 also shows that, the wing equipped with VG2, there is a deflection of streak lines at x* ≈ 0.7 which represents flow reattachment even at high angle of attack.
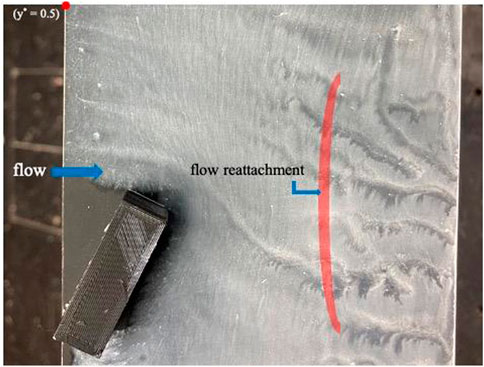
FIGURE 6. Surface oil flow visualization for a thin flat-plate at α = 45° with the installation of VG2.
The aerodynamic effect of VGs can be qualitatively and quantitatively analysed through the surface pressure distribution. Here a cubic spline method is used to fit the variation of the pressure coefficient. Figure 7A shows the variation of Cp along the streamwise direction for the baseline case at different angles of attack and y* = 0.44. At α = 10° and 25° (pre-stall and near-stall conditions), greater negative pressure coefficients are shown near the leading edge and increase along the streamwise direction. There is a significant increase in the pressure coefficient for x* > 0.8. At an angle of attack for the deep-stall condition (α = 45°), the pressure coefficients near the leading edge is greater than the cases at smaller angles of attack which represents the weaker suction on the upper surface. Besides, there is also a significant increase in the pressure coefficient at the middle of the wing along the streamwise direction. The variation of Cp along the streamwise direction with/without the installation of a VG at different angles of attack are shown in Figures 7B–D. In comparison with the baseline case, the model with an alula-like VG show a significant enhancement in the magnitude of the negative pressure coefficient on the upper surface. The VG2, with the moderate thickness, shows the best performance on alleviation of flow separation.
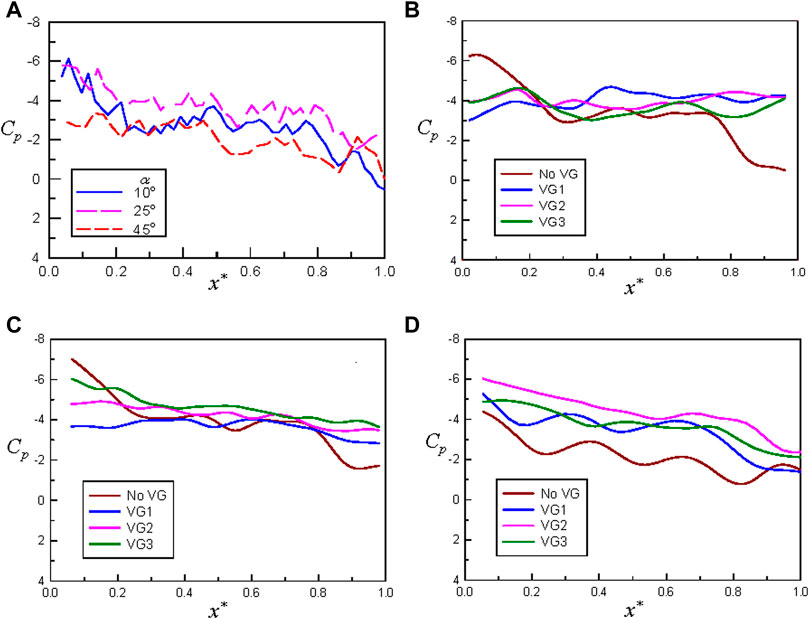
FIGURE 7. Variation of the pressure coefficient along the streamwise direction: (A) The model without an alula-like vortex generator at different angles of attack and y* = 0.44, and (B–D) comparison for the model with/without an alula-like vortex generator at y* = 0.44 and angles of attack of 10°, 25°, and 45°, respectively.
The value of CN,l corresponds to sectional suction force on the wing model. The integration of the pressure coefficients along the streamwise direction at y* = 0.32, 038, and 0.44 is calculated, as shown in Figure 8. At y* = 0.32, the data for x* = 0–0.25 is not used to integrate the value of CN,l due to the cover of a VG. For the baseline case, the magnitude of CN,l for α = 10° is less than that for α = 25°, but not for α = 45°, which already stalled. The magnitude of CN,l decreases if an alula-like VG is mounted on the wing model. For α = 10° (pre-stall), an increase in h* is less effective and creates more drag penalty. There is an opposite trend for α = 25° (near-stall). The installation of VG2 results in a lower value of CN,l for α = 45° (deep-stall). For y* = 0.38 and 0.44 (outer spanwise locations), the wings equipped with a VG all showed similar effect on CN,l as for y* = 0.32. For α = 25°, the value of CN,l of the wing equipped with VG1 is greater than that for the baseline case. In summary, the alula-like VG benefits on the increasing of entirely strength of the suction force on the upper surface of the wing and delays the stall in a post-stall condition if the VG is sufficiently thick.
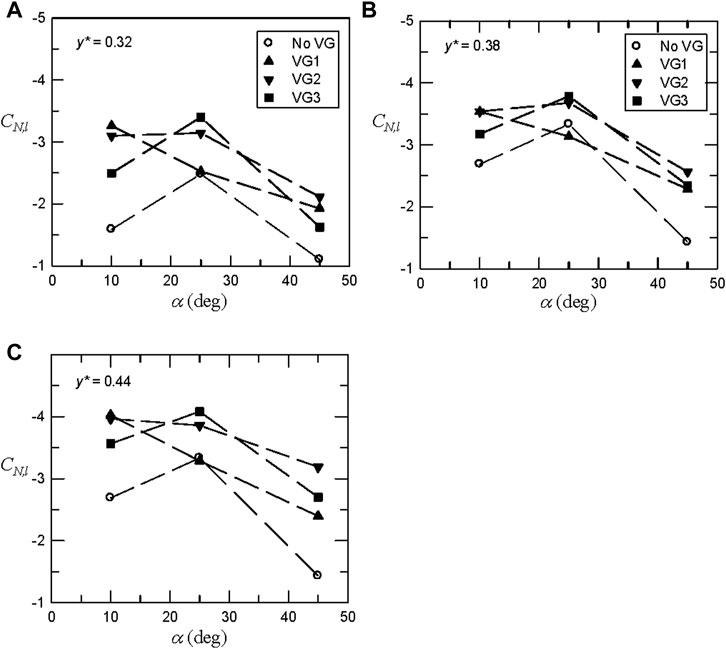
FIGURE 8. The strength of the low-pressure region on the upper surface at different spanwise locations: (A–C) Spanwise locations at y* = 0.32, 0.38, and 0.44, respectively.
The effectiveness of VGs is evaluated by the difference in the suction force coefficient, ΔCN,l [= (CN,l)VG − (CN,l)baseline], with and without the installation of a VG for the same test condition. Figure 9 shows that ΔCN,l varies with the angle of attack at different spanwise positions. For y* = 0.32, the presence of a VG results in a reduction in the value of ΔCN,l for α = 10° and 45° and there is little effect for VG1 for α = 25° (Figure 9A). In the region farther away from the VG (y* = 0.38 and 0.44), the VG helps to maintain the relatively stronger suction of flow for a deep-stall condition (Figures 9B, C). The VG induces vortex structure propagates downstream and results in a relatively more conducive to downstream attached flow in outer spanwise locations. A thin plate wing with VG2 shows the greatest increase in the strength of suction force on the wing, which related to the better aerodynamic performance.
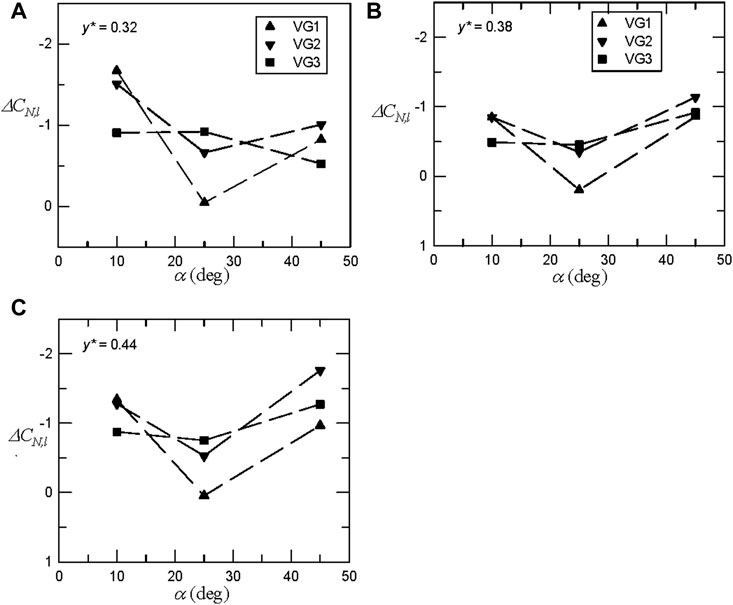
FIGURE 9. The increase in the strength of the low-pressure region on the upper surface at different spanwise locations: (A–C) Spanwise location at y* = 0.32, 0.38, and 0.44, respectively.
Discrete pressure taps cannot be used to determine global surface pressure pattern for a thin flat plate wing, and PSP technique is rarely used in a low-speed flow due to a low-pressure sensitivity. This study successfully uses PSP to determine the aerodynamic effect of an alula-like VG on a thin flat plate wing. The pressure distributions on the upper surface at different angles of attack is measured to determine the strength of the sectional suction force. An alula-like VG shows the enhancement of the suction area in both the streamwise and the spanwise directions especially under near-stall and deep-stall conditions. The region with relatively lower pressure on the upper surface was shown for an alula-mounted wing model at α = 45° (deep-stall condition). This is related to the generation of lift and avoiding the stall of wing. The vortex that is induced by a VG propagates downstream and results in an extension in the low-pressure regions or an increase in the sectional suction force coefficient, particularly at the outer spanwise locations. For a value of h* of 11%, VG2 produces the greatest performance in suction force enhancement at all angles of attack. This study successfully demonstrates the application of PSP technique used in the biomimetic low-speed/low-Re flow analysis. It plays an important role for the understanding of biomimetic aerodynamics and the design phase of advanced MAVs development.
The raw data supporting the conclusion of this article will be made available by the authors, without undue reservation.
P-HC and S-IY wrote the manuscript. S-IY initiated the concept. P-HC performed the experiments, and did the data analysis. S-IY supervised this study and reviewed the manuscript. All authors have read and agreed to the published version of the manuscript.
This study was supported by the Ministry of Science and Technology, Taiwan, grant number: MOST 110-2221-E-006-088-MY3.
The authors are grateful for the technical support of the ASTRC/NCKU technical staff.
The authors declare that the research was conducted in the absence of any commercial or financial relationships that could be construed as a potential conflict of interest.
All claims expressed in this article are solely those of the authors and do not necessarily represent those of their affiliated organizations, or those of the publisher, the editors and the reviewers. Any product that may be evaluated in this article, or claim that may be made by its manufacturer, is not guaranteed or endorsed by the publisher.
1. Han J-S, Chang JW, Han J-H. An aerodynamic model for insect flapping wings in forward flight. Bioinspiration & Biomimetics (2017) 12(3):036004. doi:10.1088/1748-3190/aa640d
2. Harvey C, Inman DJ. Aerodynamic efficiency of gliding birds vs comparable UAVs: A review. Bioinspiration & Biomimetics (2021) 16(3):031001. doi:10.1088/1748-3190/abc86a
3. Ishihara D, Horie T, Niho T. An experimental and three-dimensional computational study on the aerodynamic contribution to the passive pitching motion of flapping wings in hovering flies. Bioinspiration & Biomimetics (2014) 9(4):046009. doi:10.1088/1748-3182/9/4/046009
4. Tay W-B, Jadhav S, Wang J-L. Application and improvements of the wing deformation capture with simulation for flapping micro aerial vehicle. J Bionic Eng (2020) 17(6):1096–108. doi:10.1007/s42235-020-0100-x
5. Fu J-J, Hefler C, Qiu H-H, Shyy W. Effects of aspect ratio on flapping wing aerodynamics in animal flight. Acta Mechanica Sinica (2014) 30(6):776–86. doi:10.1007/s10409-014-0120-z
6. Abdolahipour S, Mani M, Shams Taleghani A. Pressure improvement on a supercritical high-lift wing using simple and modulated pulse jet vortex generator. Flow, Turbulence and Combustion (2022) 109(1):65–100. doi:10.1007/s10494-022-00327-9
7. Abdolahipour S, Mani M, Shams Taleghani A. Experimental investigation of flow control on a high-lift wing using modulated pulse jet vortex generator. J Aerospace Eng (2022) 35(5):05022001. doi:10.1061/(asce)as.1943-5525.0001463
8. Taleghani AS, Shadaram A, Mirzaei M. Effects of duty cycles of the plasma actuators on improvement of pressure distribution above a NLF0414 airfoil. IEEE Trans Plasma Sci (2012) 40(5):1434–40. doi:10.1109/tps.2012.2187683
9. Lee S-I, Kim J, Park H, Jabłoński PG, Choi H. The function of the alula in avian flight. Scientific Rep (2015) 5(1):9914–5. doi:10.1038/srep09914
10. Ito MR, Duan C, Wissa AA. The function of the alula on engineered wings: A detailed experimental investigation of a bioinspired leading-edge device. Bioinspiration & biomimetics (2019) 14(5):056015. doi:10.1088/1748-3190/ab36ad
11. Chung P-H, Chang P-H, Yeh S-I. The aerodynamic effect of an alula-like vortex generator on a revolving wing. Biomimetics (2022) 7(3):128. doi:10.3390/biomimetics7030128
12. Bao H, Song B, Yang W, Xue D. The function of the alula with different geometric parameters on the flapping wing. Phys Fluids (2021) 33(10):101907. doi:10.1063/5.0069176
13. Lee S-I, Choi H. Characteristics of the alula in relation to wing and body size in the Laridae and Sternidae. Anim Cell Syst (2017) 21(1):63–9. doi:10.1080/19768354.2016.1266287
14. Lin JC, Robinson SK, McGhee RJ, Valarezo WO. Separation control on high-lift airfoils via micro-vortex generators. J aircraft (1994) 31(6):1317–23. doi:10.2514/3.46653
15. Pickles JD, Narayanaswamy V. Control of fin shock induced flow separation using vortex generators. AIAA J (2020) 58(11):4794–806. doi:10.2514/1.j059624
16. Chung K-M, Su K-C, Chang K-C. The effect of vortex generators on shock-induced boundary layer separation in a transonic convex-corner flow. Aerospace (2021) 8(6):157. doi:10.3390/aerospace8060157
17. Ichikawa Y, Koike S, Ito Y, Murayama M, Nakakita K, Yamamoto K, et al. Size effects of vane-type rectangular vortex generators installed on high-lift swept-back wing flap on lift force and flow fields. Experiments in Fluids (2021) 62(8):160–17. doi:10.1007/s00348-021-03198-4
18. Pratt T, Qin N. Vortex generators for increased maximum lift and enhanced high-α stability of a Zimmerman-wing MAV at low Reynolds number. In: 2016 applied aerodynamics conference - Evolution & innovation continues - The next 150 years of concepts, design and operations, conference programme & proceedings; 2016 Jul 19–21; Bristol, United Kingdom. Royal Aeronautical Society (RAeS) (2017).
19. Seshagiri A, Cooper E, Traub LW. Effects of vortex generators on an airfoil at low Reynolds numbers. J Aircraft (2009) 46(1):116–22. doi:10.2514/1.36241
20. Genç MS, Koca K, Demir H, Açıkel HH. Traditional and new types of passive flow control techniques to pave the way for high maneuverability and low structural weight for UAVs and MAVs. Autonomous Vehicles (2020) 131–60.
21. Arunvinthan S, Raatan V, Nadaraja Pillai S, Pasha AA, Rahman MM, Juhany AK. Aerodynamic characteristics of shark scale-based vortex generators upon symmetrical airfoil. Energies (2021) 14(7):1808. doi:10.3390/en14071808
22. Mandadzhiev BA, Lynch MK, Chamorro LP, Wissa AA. An experimental study of an airfoil with a bio-inspired leading edge device at high angles of attack. Smart Mater Structures (2017) 26(9):094008. doi:10.1088/1361-665x/aa7dcd
23. Linehan T, Mohseni K. Scaling trends of bird’s alular feathers in connection to leading-edge vortex flow over hand-wing. Scientific Rep (2020) 10(1):7905–14. doi:10.1038/s41598-020-63181-7
24. Peterson JI, Fitzgerald RV. New technique of surface flow visualization based on oxygen quenching of fluorescence. Rev Scientific Instr (1980) 51(5):670–1. doi:10.1063/1.1136277
25. McLachlan BG, Bell JH. Pressure-sensitive paint in aerodynamic testing. Exp Therm Fluid Sci (1995) 10(4):470–85. doi:10.1016/0894-1777(94)00123-p
26. Mohamed A, Watkins S, Fisher A, Marino M, Massey K, Clothier R. Bioinspired wing-surface pressure sensing for attitude control of micro air vehicles. J Aircraft (2015) 52(3):827–38. doi:10.2514/1.c032805
27. Gregory J, Asai K, Kameda M, Liu T, Sullivan J. A review of pressure-sensitive paint for high-speed and unsteady aerodynamics. Proc Inst Mech Eng G: J Aerospace Eng (2008) 222(2):249–90. doi:10.1243/09544100jaero243
28. Sugioka Y, Hiura K, Chen L, Matsui A, Morita K, Nonomura T, et al. Unsteady pressure-sensitive-paint (PSP) measurement in low-speed flow: Characteristic mode decomposition and noise floor analysis. Experiments in Fluids (2019) 60(7):108–17. doi:10.1007/s00348-019-2755-9
29. Liu T. Pressure-correction method for low-speed pressure-sensitive paint measurements. AIAA J (2003) 41(5):906–11. doi:10.2514/2.2026
30. Jiao L, Chen Y, Wen X, Peng D, Liu Y, Gregory JW. Resolving vortex-induced pressure fluctuations on a cylinder in rotor wake using fast-responding pressure-sensitive paint. Phys Fluids (2019) 31(5):055106. doi:10.1063/1.5092944
31. Kruyt JW, Van Heijst GF, Altshuler DL, Lentink D. Power reduction and the radial limit of stall delay in revolving wings of different aspect ratio. J R Soc Interf (2015) 12(105):20150051. doi:10.1098/rsif.2015.0051
32. Wang S, Ghaemi S. Effect of vane sweep angle on vortex generator wake. Experiments in Fluids (2019) 60(1):24–16. doi:10.1007/s00348-018-2666-1
33. Linehan T, Mohseni K. Investigation of a sliding alula for control augmentation of lifting surfaces at high angles of attack. Aerospace Sci Technol (2019) 87:73–88. doi:10.1016/j.ast.2019.02.008
34.Turbulent modeling resource, 2D NACA 0012 airfoil validation case: NASA langley research center; Available at: https://turbmodels.larc.nasa.gov/naca0012val.html (Accessed August 15, 2022).
35. Lu F. Surface oil flow visualization. Eur Phys J Spec Top (2010) 182(1):51–63. doi:10.1140/epjst/e2010-01225-0
36. Breuer M, Jovicic N. Separated flow around a flat plate at high incidence: An LES investigation. J Turbulence (2001) 2(1):018. doi:10.1088/1468-5248/2/1/018
AR aspect ratio
B(T) pressure sensitivity
b span
Cp pressure coefficient
CN,l sectional suction force coefficient
c chord length
h height of vortex generator
h* h/c
I intensity for the luminescence
Iref intensity for the luminescence at reference pressure
p mean surface pressure
p∞ freestream static pressure
pref reference pressure, 1 atm
q∞ dynamic pressure
V freestream velocity
T temperature
x longitudinal coordinate
x* x/c
y spanwise coordinate
y* y/b
α angle of attack
ΔCN,l increment in sectional suction force coefficient
θ incidence angle of vortex generator
σ standard deviation
Keywords: alula, vortex generator, pressure sensitive paint, biomimetics, flow control
Citation: Chung P-H and Yeh S-I (2023) Aerodynamic effect of an alula-like vortex generator using pressure sensitive paint technique. Front. Phys. 11:1127081. doi: 10.3389/fphy.2023.1127081
Received: 19 December 2022; Accepted: 30 January 2023;
Published: 09 February 2023.
Edited by:
Hui Tang, Hong Kong Polytechnic University, Hong Kong SAR, ChinaReviewed by:
Arash Shams Taleghani, Ministry of Science, Research, and Technology, IranCopyright © 2023 Chung and Yeh. This is an open-access article distributed under the terms of the Creative Commons Attribution License (CC BY). The use, distribution or reproduction in other forums is permitted, provided the original author(s) and the copyright owner(s) are credited and that the original publication in this journal is cited, in accordance with accepted academic practice. No use, distribution or reproduction is permitted which does not comply with these terms.
*Correspondence: Szu-I Yeh, c2l5ZWhAbWFpbC5uY2t1LmVkdS50dw==
Disclaimer: All claims expressed in this article are solely those of the authors and do not necessarily represent those of their affiliated organizations, or those of the publisher, the editors and the reviewers. Any product that may be evaluated in this article or claim that may be made by its manufacturer is not guaranteed or endorsed by the publisher.
Research integrity at Frontiers
Learn more about the work of our research integrity team to safeguard the quality of each article we publish.