 Lin lin Wang
95% of researchers rate our articles as excellent or good
Learn more about the work of our research integrity team to safeguard the quality of each article we publish.
Find out more
ORIGINAL RESEARCH article
Front. Phys. , 13 March 2023
Sec. Fluid Dynamics
Volume 11 - 2023 | https://doi.org/10.3389/fphy.2023.1125220
This article is part of the Research Topic Editor’s Challenge in Fluid Dynamics: Flows Across the Scales View all 4 articles
At present, there are relatively few studies on the slug flow generation mode obtained by exchanging gas-liquid two-phase inlets. In this study, an experimental system combining microfluidic devices and high-speed cameras was used to study the effects of gas-liquid two-phase flow rate, liquid physical parameters, etc., On the characteristic length, generation period and other generation characteristics of slug flow, and dimensionless analysis was conducted to investigate the main factors affecting the characteristic length of gas slug. Results show that 1) when the gas flow rate affects the aeroelastic generation characteristics, the aeroelastic characteristic length increases from 443 μm when the gas flow rate increases changes to 657 μm. The generation period decreases rapidly at first and then the change amplitude slows down. The maximum value of aeroelastic generation frequency is 217 s-1; 2) when studying the effect of different liquid flow rates, increasing the liquid flow rate, the characteristic length of the gas bomb gradually decreases, and the generation period of the gas bomb gradually increases. Aeroelastic characteristic length from 770 μm changes to 378 μm. The range of aeroelastic generation cycle is 4–13.4 ms, and the maximum value of aeroelastic generation frequency is 250 s-1; 3) there is a functional relationship between the ratio of aeroelastic characteristic length to channel size L/d and dimensionless gas-liquid flow ratio Q*, Reynolds number Re, Weber number We:
Microfluidic technology is a kind of technology that emerged at the end of last century and gradually developed [1]. It meets the characteristics of integration and miniaturization advocated by modern industry. At this stage, microbubbles are mainly used in disease diagnosis and treatment, food safety and environmental governance [2]. Efforts should be made to add other functions to microbubbles and broaden their application scope. Study the generation process and mechanism of microbubbles, analyze the changes of the phase interface through the combination of experiment and simulation, and obtain the physical field information and force situation in the whole generation process, so the research on the generation mechanism and control mechanism of microbubbles needs to be deepened. Deepening the understanding of the mechanism of microfluidic technology controlling the generation of microbubbles will help to further promote and apply this technology.
The study of flow characteristics in microchannels includes flow patterns, phase interfaces, heat and mass transfer, velocity and pressure changes, etc. [3] Common flow patterns include bubble flow, slug flow (also known as Taylor flow), stratified flow, annular flow, etc. At present, there are three main problems in the study of flow patterns [4, 5]: (i) the definition of flow pattern is vague: at present, the definition of flow pattern is mostly based on the results of subjective observation, with strong subjective factors; (ii) diversified definitions of flow patterns: the names of flow patterns are diverse, and a set of unified definitions have not been established; (iii) qualitative characteristics of flow pattern: flow pattern can only be judged qualitatively, and there is no quantitative judgment method. Although the definition of flow pattern is subjective, the common flow pattern is recognized. Triplett et al. believed that flow patterns mainly include bubble flow, slug flow, turbulent flow, slug annular flow and annular flow [6]. The bubble flow size is usually smaller than the pipe size. In the liquid phase fluid by separation, the bubble shape is uneven. Bubbles in slug flow occupy most of the cross section of the channel, forming a relatively regular aeroelastic shape. The long and thin bubbles in the agitated flow are unstable and produce obvious confusion at the tail. In the annular flow, the gas phase occupies most of the area in the center of the pipe, and the liquid phase forms a liquid film and flows along the pipe wall [7].
Under the experimental conditions of Triplett, the phenomenon of stratified flow, which often occurs in the macro field of gas-liquid two-phase flow, has not been observed. In stratified flow, gas-liquid two-phase flows up and down the pipe respectively, with obvious phase boundaries in the middle, and stratified flow cannot produce bubbles [8]. Chung et al. showed that slug flow, mixed flow and slug annular flow accounted for a large proportion in the flow pattern diagram, indicating that these three flow patterns were more likely to occur under the conditions of gas-liquid flow rate shown in the diagram [9]. When the gas and liquid velocities are both low, the flow pattern appears to be slug flow, and the flow pattern changes to bubble flow with increasing liquid velocity. The distribution area of slug flow in flow pattern diagram is larger than that of bubble flow, which indicates that slug flow has wide operating conditions and strong controllability [10]. When the gas flow rate increases, the flow pattern changes to agitated flow and annular flow, indicating that the proportion of gas phase increases and the fluctuation in the channel intensifies [11]. As several flow patterns are distinguished by transition lines, there is basically no transition area, so when the two-phase flow rate conditions are changed, the flow pattern may change greatly [12]. Fu et al. studied the transition process and characteristics of bubble generation mechanism from “squeezing” to “dripping” in T-shaped microchannels [13]. In the “squeezing” state, a longer gas slug is obtained, and the extrusion pressure is dominant in the generation process. The bubble size is proportional to the gas-liquid flow rate ratio. In the “dripping” state, dispersed bubbles are obtained, and the shear force resists the surface tension. The bubble size is related to the liquid capillary number [14]. At this time, the extrusion force still affects the bubble formation process. When the shorter gas slug appears in the transition state, the extrusion pressure, shear force and surface tension all affect the formation of the bubble, and the bubble size is related to the liquid capillary number and the gas-liquid flow rate ratio [15].
Dimensionless number is an effective method in discussing flow force [16]. The five dimensionless numbers are Capillary number, Weber number, Bond number, Reynolds number and Ohnesorge number. Because the experimental conditions used by researchers are different, there is no general gas-liquid two-phase flow pattern diagram [17]. The flow pattern and the transition between flow patterns are mainly affected by channel size, phase apparent velocity, liquid interfacial tension, wall wettability, channel structure, fluid flow direction and liquid viscosity [18]. Under the influence of these factors, the flow pattern and its transformation trend still have laws to follow. S. Arias et al. studied gas-liquid two-phase flow in a T-shaped device with an inner diameter of 1 mm, and obtained the bubble characteristic length and its change rule in bubble flow and slug flow through analysis. It is found that the bubble length is the result of the balance of gas-liquid two-phase flow rate, and the bubble length can be expressed as a function of the apparent velocity of gas-liquid two-phase flow [19]. Su et al. studied the influence of viscosity on the flow process of liquid phase fluid in microchannels, and found that the traditional theory can accurately predict the single-phase flow of high viscosity fluid in microchannels [20]. The viscosity of dispersed phase has a significant effect on slug flow in microchannel. The capillary number formula is established by modifying the capillary number, and the error of the empirical formula deduced is within 10%. The two-phase flow process in the microchannel is different from that in the macro scale. Due to the different experimental conditions and experimental personnel, the experimental results are highly subjective, and the flow pattern judgments obtained are different [21]. The slug flow pattern can produce microbubbles with uniform size and strong controllability.
The empirical numerical simulation is a commonly used method for the study of gas-liquid two-phase flow in microchannels [22]. Through experiments, different flow patterns and their changes with experimental conditions can be observed. However, the physical field information such as the velocity and pressure of gas-liquid two-phase flow in microchannels cannot be accurately obtained by using experimental methods alone [23]. With the rapid development of computer technology, numerical simulation has become an important means to study gas-liquid two-phase flow in microchannels. Computational Fluid Dynamics (CFD) can analyze physical phenomena such as fluid movement and heat transfer through computer calculation and solution. At present, the commonly used numerical methods to study the phase interface motion include the volume of fluid method, level set method, phase field method, and labeled particle element method (MAC) [24]. These methods provide an effective way to study two-phase flow in microchannels, and VOF method has become the main means to simulate slug flow generation in microchannels. Guo et al. found that the capillary number of extrusion mechanism and shear mechanism is 5.8
Before the 1990s, the research on two-phase flow in T-shaped channels was mainly focused on the research of small-size equal-diameter channels; In recent years, more and more attention has been paid to the flow law of two-phase flow in microchannels [26–29]. However, in the research of similar equal-diameter T-shaped channel, the so-called liquid separation is essentially a process of separation, which is a problem of two-phase uniformity in the branch pipe, rather than a real two-phase separation. For the problem of two-phase flow separation in a quasi-equal-diameter T-shaped microchannel, its flow characteristics are mainly affected by several factors such as channel structure, inlet flow pattern, inlet flow rate, and physical properties of working medium [30–34]. The effect of the inlet flow pattern is obvious. With the transition of the inlet flow pattern from slug to annular, the phase separation curve gradually moves from the gas-phase enrichment zone to the liquid-phase enrichment zone. The slug circulation curve is located in the transition zone between the slug and annular flow curves. The change of the apparent velocity of the liquid phase in the inlet apparent velocity has a greater impact on the overall phase separation, which is due to the high density of the liquid phase itself, the more sensitive liquid membrane separation effect close to the wall, and other characteristics. At the same time, it can be seen from the flow pattern diagram that the effect of the apparent velocity is roughly the same as that of the flow pattern, showing the same rule [35–38]. The cross-scale T-shaped microchannel can realize the true separation of two-phase flow. The interface movement and interface pressure difference are the power or essence of two-phase flow separation, and the relative size of the channel, the back pressure at the outlet of the separation and the liquid shear force are all important factors affecting the separation; However, the research on the liquid separation process is still not perfect, especially the influence of the wave motion and instability of the two-phase flow on the phase separation effect is still not involved, and further in-depth research is needed [39–42].
At present, the numerical simulation of slug flow in microchannels mainly adopts VOF method to study the influence of two-phase flow rate, physical parameters and contact angle on the flow process. It can not only obtain the basic parameters such as two-phase flow pattern, slug flow length and generation period, but also deeply analyze the information such as velocity field and pressure field in the flow process, thus making up for the shortage of simple experimental research [43].
Currently, research questions of studies in terms of slug flow in microchannel are mainly concentrated in flow characteristics in microchannel, numerical simulation of slug flow generation process, microbubble characteristics, etc. However, problems still need to be discussed including 1) the definition of flow pattern is mostly based on the results of subjective observation, with strong subjective factors; 2) the flow characteristics of slug flow in microchannels are not clear; 3) the influence factors and function relations of flow characteristics of slug flow in microchannels are unknown. Because the experimental conditions used by researchers are different, there is no general gas-liquid two-phase flow pattern. The flow pattern and the transition between flow patterns are mainly affected by the channel size, phase apparent velocity, liquid interfacial tension, wall wettability, channel structure, fluid flow direction and liquid viscosity. Under the influence of these factors, the flow pattern and its changing trend still have rules to follow. The two-phase flow process in the microchannel is different from the two-phase flow in the macro scale. Due to the different experimental conditions and personnel, the experimental results have strong subjectivity, and the flow pattern judgments are different. The slug flow pattern can produce microbubbles with uniform size and strong controllability.
Although a lot of research has been done on the generation process of slug flow in gas-liquid two-phase flow, the research on the generation process and generation characteristics of slug flow in microchannels still needs to be deepened. Especially, the influence factors and functional relationship of the generation characteristics of the gas bomb are still unclear. Therefore, in this paper, we aimed to 1) explore generation characteristics of gas bomb; 2) investigate impact factors of gas bomb; 3) reveal the functional relationship between aeroelastic generation characteristics and influencing factors through mathematical methods. We supplement the deficiency that the experiment cannot obtain the information such as the physical field in the microchannel.
We used an experimental system combining microfluidic devices and high-speed cameras to study the effects of gas-liquid two-phase flow rate, liquid phase physical parameters, etc., On the characteristic length, generation period and other generation characteristics of slug flow, and conducted a dimensionless analysis to investigate the main factors affecting the characteristic length of gas slug.
The materials used in the experiment include: the liquid phase fluid is the mixed aqueous solution of sodium alginate (SA) and surfactant sodium dodecyl sulfate (SDS) or Tween 20, and the gas phase fluid is air. Sodium alginate is a natural polysaccharide with good solubility, stability, certain viscosity and high safety. It has the characteristics of concentrated solution, film forming and gel forming. SDS is a white or pale yellow powder anionic surfactant, which has emulsifying, decontaminating and excellent foaming ability. It is often used as emulsifier, fire extinguishing agent and foaming agent in chemical production. Tween 20 is a kind of non-ionic surfactant, commonly used as emulsifier, solubilizer, stabilizer, etc., The three materials can be soluble in water, and the viscosity and surface tension of the solution can be changed by changing the mass fraction of the added materials. Deionized water is used to prepare sodium alginate mixed water solution. When the experiment is completed, it is also used to clean the device in combination with absolute ethanol (see Table 1).
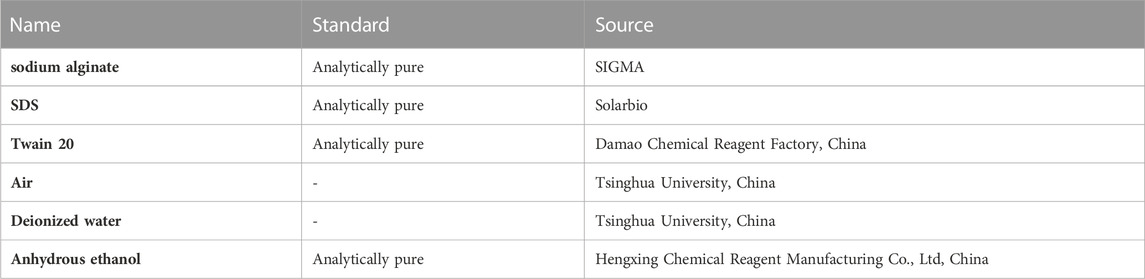
TABLE 1. Experimental material.
The experimental system consisting of microfluidic chip, micro feeding system and high-speed camera is used to study the generation process and generation characteristics of slug flow. The main experimental equipment is shown in Table 2. The gas-liquid two-phase flow is powered by a micro feed pump with the same specification. The channel size in the microfluidic chip is micrometer, so it needs to be magnified and observed with a microscope. The high-speed camera is connected to the microscope through the C interface. The microscope acts as a lens for the high-speed camera and provides light source for shooting. The high-speed camera is controlled by a computer to achieve high-speed photography, supported by an iron frame, and waste liquid is collected through a waste liquid bottle.
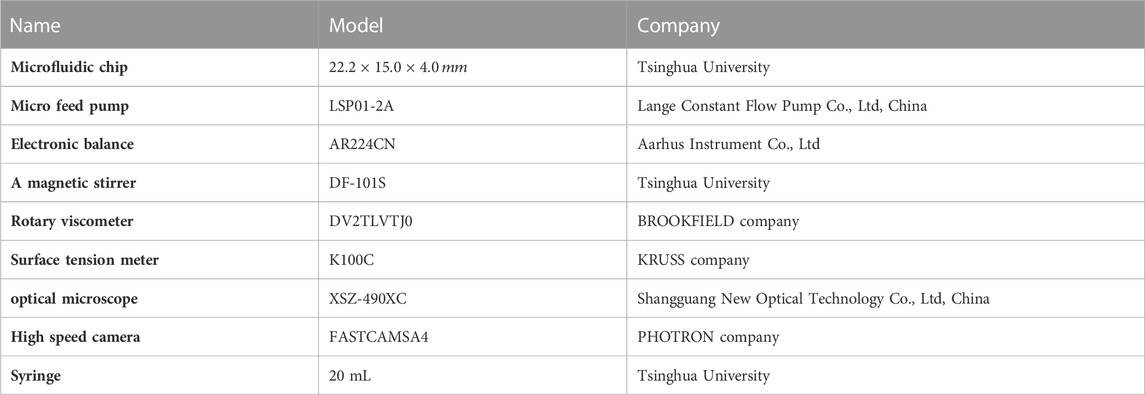
TABLE 2. The main experimental equipment of study.
The micro feed pump used in the experiment was purchased from Baoding Lange Constant Flow Pump Co., Ltd., the model of which is the laboratory precision injection pump LSP01-2A, and the minimum flow can be accurate to 0.0002 μl/min, meeting the regulation accuracy of this experiment. A variety of different types of syringes can be selected. The specification of the syringe used in this experiment is 20 mL. Because the slug flow generated at a high rate during the experiment, it could not be observed and recorded accurately by the naked eye, so a high-speed camera was needed as an auxiliary tool. The high-speed camera used for image recording is produced by Photon Company of Japan. The model is Fastcam SA4. The shooting speed of the high-speed camera is 125–500000 fps. The greater the frame rate, the greater the exposure required, and the clearer the image captured in the bullet flow generation process. Under the condition that clear slug flow can be obtained and light intensity conditions allow, it is determined that the frame rate used in this experimental condition is 5000 fps. The high-speed camera controls the shooting and saving through the computer software PFV Ver.351. The shooting is cached in the high-speed camera and the data is transmitted to the computer for post-processing.
The actual microfluidic chip used in the experiment is as shown in Figure 1. The intermediate chip is made of glass. A piece of glass is etched by hydrofluoric acid to form a T-shaped channel, and another piece of glass with the same size is sealed by hot bonding, leaving only the inlet and outlet channels. The internal channel can also be modified by chemical methods.
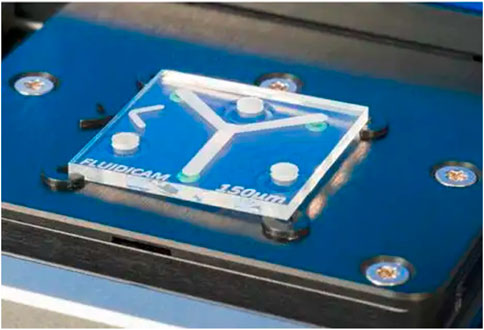
FIGURE 1. Experimental model of microfluidics chip.
Chip dimensions (L × W × H) is 22.5 mm × 15.0 mm × 4.0 mm with two inlets and one outlet. The chip is fixed by a clamp and connected with the external pipe. The clamp and chip are sealed by a rubber plug with a channel. When installing the chip and clamp, ensure that the T-shaped channel is aligned with the rubber plug channel, and adjust the screw tightness to prevent air and liquid leakage or poor flow. Chips and fixtures are purchased from Suzhou Wenhao Chip Technology Co., Ltd.
In addition to the devices involved in the above experimental system, the devices for preparing solutions and measuring physical properties are also required. The devices used for preparing solution mainly include electronic balance and magnetic stirrer. The model of the electronic balance is AR224CN, the weighing range is 0.01–220 g, and the calibration graduation value e is 0.001 g. Since the amount of solution required for each experiment is small, considering the weighing error and the range of the electronic balance, it is determined that the mass of solution prepared each time is 100 g. Taking the SA mass fraction of 0.1 wt% as an example, the weighed sodium alginate is 0.1 g. The magnetic stirrer model is DF-101S heat collecting constant temperature heating magnetic stirrer. The mixing and heating functions can be controlled separately. The speed range is 0–2400 r/min. The constant temperature water bath temperature can be set as required. The measuring devices for liquid phase physical parameters mainly include rotary viscometer, surface tension meter and density bottle. The rotary viscometer is manufactured by BROOKFIELD Company of the United States. The model is DV2TLVTJ0. The measuring range of viscosity value is
Preparation of sodium alginate mixed aqueous solution: considering the measurement error and dosage of the solution, the mass of the uniformly prepared solution is 100 g, and then the mass of the required materials is calculated according to the mass fraction of the corresponding materials in the experimental condition table. Put a 250 ml washed and dried beaker on the electronic balance, and return to zero after the balance reading is stable. Use a spoon to take a small amount of sodium alginate solid powder into the beaker, and gradually add it until the indication is the amount of sodium alginate used for calculation. After removing the residual agent on the spoon surface, take the surfactant SDS and add it to the beaker until the indication is the total amount of the two agents calculated. After the drug measurement is completed, use another beaker to take deionized water and slowly add it to the beaker on the balance through a clean glass rod in the way of drainage. When the indicator is 2–3 g away from the 100 g indicator, use a rubber tip dropper to drop deionized water into the beaker until the indicator is 100 g. After adding deionized water, stir the solution until it is homogeneous and transparent, and gently put the rotor along the wall into the beaker after weighing. Place the beaker in the center of the magnetic stirrer, and turn on the middle and low level of the magnetic stirrer to stir for about 20 min. If there is no solid block visible to the naked eye, it can be considered that the stirring is even.
The experimental working condition table is designed according to the variables considered. In Table 3, No.1 corresponding to gas phase fluid and No.2∼9 corresponding to liquid phase fluid are taken from the data corresponding to Table 3 of gas-liquid two-phase physical property parameters. When studying the influence of gas phase flow rate on slug flow generation process and slug flow generation characteristics, choose No.1∼5 corresponding operating conditions, and by analogy, choose No.3 and No.6∼9 when studying the influence of liquid phase flow rate, No.3 and No.10∼12 when studying the influence of surface tension, and No.3 and No.13∼16 when studying the influence of viscosity.
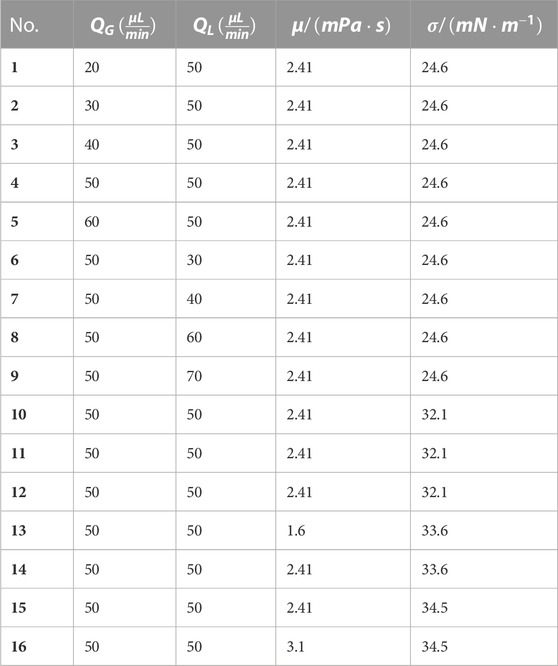
TABLE 3. Experimental case.
Setting up the experimental device: the experimental device is mainly set up to connect the microscope and high-speed photography, and the XSZ was used.
The viewing head in the vertical direction of the optical microscope can be connected to the high-speed camera with the lens removed through the C-type interface. At this time, the objective lens of the microscope is equivalent to the lens of the high-speed camera. Connecting the two together is one of the highlights of this experiment. The high-speed camera is upside down on the upper part of the microscope and is supported and fixed by an iron frame. Use the computer software PFV Ver.351 to control the high-speed camera shooting, and complete the data storage and transmission through the data line. After the microfluidic chip and fixture are installed, they are placed on the microscope stage. Move the stage to align the T-shaped intersection position of the chip with the center of the objective lens. Adjust the thickness of the microscope and the focusing screw to adjust the clarity of the field of vision. The magnification of the objective lens selected in this experiment is ×10. The microfluidic chip is connected to the syringe through a polytetrafluoroethylene (PTFE) tube with an outer diameter of 1.6 mm. Two syringes are respectively filled with gas-liquid and gas-liquid fluids, and a micro feed pump is used to drive the feed. A beaker is used at the outfeed side of the microfluidic chip to receive the experimental waste liquid to avoid environmental pollution.
Conduct the experiment: during the experiment, set the feeding speed of the micro feeding pump, and the flow process of the liquid phase fluid can be seen with the naked eye. After a period of time, when the microbubble can be seen to form stably, turn on the microscope switch to minimize the brightness. After the high-speed camera is turned on, run the computer software PFV Ver.351 to gradually enhance the brightness and adjust the thickness of the focusing spiral to make the channel contour in the software clearer. After selecting the high-speed camera to capture the frame rate of 5000 fps, click to capture. The photos taken are cached in the high-speed camera, and you can select some of the photos you want to save in the computer folder. After each shooting, turn off the high-speed camera and microscope switch, and adjust the parameters for a period of time before taking the next shot.
Complete the experiment: after measuring and recording multiple groups of experimental results, turn off the power supply of the microscope and high-speed camera, and disassemble the high-speed camera and bracket. Change the solution in the syringe into deionized water, and use the micro feed pump to flush the pipe and chip. After flushing, close the micro feed pump, remove the microfluidic chip clamp and air dry it, tidy up the rest of the experimental devices, and clean up the waste liquid. Finally, the experimental data were processed.
On the premise of accurate description of physical problems, in order to improve the computational efficiency, reasonable assumptions were made in the process of establishing the numerical model: 1) the flow in the microchannel was treated as laminar flow; 2) The gas-liquid two-phase flow is incompressible; 3) In the flow process, the gas-liquid two-phase physical parameters remain unchanged, mainly the two-phase density, liquid viscosity and surface tension remain unchanged; 4) Ignore the influence of gravity.
In this paper, the multi-phase flow VOF method is used to capture the change of gas-liquid two-phase interface. The VOF model can simulate a variety of immiscible fluids by solving the continuity equation, momentum equation and processing the volume fraction of each phase of the fluid in the region through which it passes.
The width of the T-shaped channel used in the experiment is micrometer. Considering that the location of the slug flow is near the intersection of the T-shaped channel, the physical model of the T-shaped microchannel used in the numerical simulation is determined by reasonable simplification and focusing on highlighting the change of the phase interface at the intersection. Take the intersection point O (0,0) of the centerlines of the two feeding channels as the coordinate origin, the horizontal direction is the x coordinate, and the vertical direction is the y coordinate. The length from the midpoint of the two entrances to the coordinate origin is 500 μm. In order to fully display the motion state of slug flow generation and bubble separation in the microchannel, the length from the origin to the outlet midpoint is 3000 μm. The gas phase fluid is introduced horizontally, and the channel width is 178 μm; The liquid phase is introduced vertically, and the channel width is 172 μm. The two values are the actual size of the T-shaped microchannel obtained from the micrograph measurement. In this paper, the two-dimensional T-channel model is used, and the modeling software Gambit 2.4.6 is used to establish the physical model of the T-channel and divide it into 10 μM.
Before using the above control equation to calculate the two-phase flow in the microchannel, it is necessary to set the initial conditions and boundary conditions for the control equation. The initial conditions are as follows: (1) set the initial time when the microchannel is filled with liquid phase; (2) At the initial time, the gauge pressure in the channel is 0, which is atmospheric pressure; (3) At the initial time, the computing unit speed in the channel is zero. In the physical model of T-shaped microchannel, there are two inlets, one outlet and the wall. It is necessary to set the boundary conditions for the inlet and outlet and wall characteristics.
1) Set the liquid phase as the primary phase and the inlet as the velocity inlet. The velocity is calculated by the flow; Phase holdup is
2) Set the gas phase as the secondary phase and the inlet as the velocity inlet. The velocity is calculated by the flow; Phase holdup is
3) The outlet is a free outflow boundary condition, and the flow in the outlet direction is fully developed;
4) The wall is set as a non-slip boundary condition, that is, the fluid velocity at the wall is zero. In addition, the wall contact angle is set at 140°, which is hydrophobic wall.
According to the research of Brackbill, the continuous surface tension model in the fluid volume function method combined with wall adhesion needs to specify the wall contact angle, and the contact angle between the fluid and the wall is often used to adjust the surface normal direction of the element near the wall.
This paper focuses on the change of the formation process of gas-liquid two-phase slug flow in the microchannel and considers that the density is constant, so the transient solver is selected to solve based on the pressure. Explicit Scheme is used for the volume fraction equation in the multiphase flow model, which is suitable for the transient calculation, and the phase interface is clearer. The implicit body force is selected for the body force equation, and the pressure gradient term is partially balanced with the surface tension to improve the convergence of the solution. PISO (Pressure Implicit with Splitting of Operators) algorithm is selected for pressure-velocity coupling. The PISO algorithm is a two-step correction method, which mainly includes the prediction step, the first correction step and the second correction step. Compared with the SIMPLC algorithm, it adds a correction step, which is suitable for solving transient flow problems. The gradient difference is mainly for the diffusion phase, and the Green-Gauss Cell Based format is selected. PRESTO is selected for pressure difference! (Pressure Staging Option) scheme, the momentum equation uses the second order upwind scheme. Geo-Reconstruction is selected for gas-liquid two-phase interface, which is helpful to improve the accuracy of interface tracking.
According to the Fluent help file, the VOF method itself follows the conservation of volume. It tracks the volume fraction of a specific phase in the cell to get the interface. The disadvantage of this method is the calculation of the spatial derivative, because the volume fraction of a certain phase of VOF is discontinuous on the interface. The level set function is smooth and continuous, which can accurately calculate the interface curvature and the surface tension generated by it. However, the level set function has some defects in maintaining the volume conservation. The two methods can be coupled to remedy the defects, and this method is only applicable to two-phase flow and transient flow problems. Therefore, this model starts the level set equation and selects the coupling level set and VOF solution method.
Grid size is 10 μm. This dimension represents the size of space step in the model. The relationship between space step and time step can be obtained from the Courant Number formula. Usually, the CN value is used to adjust the stability and convergence of the calculation. Generally speaking, the convergence rate is slow when the CN value is small, but the computational stability is good; If the CN value is large, the convergence speed is fast, but the computational stability is poor. Through a large number of simulation tests and comparison, the simulation CN value is set at 0.25, and the time step length is finally selected as 10–6 s, with a maximum of 20 iterations in each time step. The Intel Xeon server with a main frequency of 2.13 GHz, two processors and 8 GB RAM is used to solve the generation process of gas-liquid two-phase slug flow (
In order to further study the changes of the physical field in the microchannel during the simulation process, especially the pressure field, three monitoring points and one monitoring line are set in the simulation process, as shown in Figure 2. Wherein, point O is the intersection of the two entrance centerlines, and monitoring points A (- 0.1, 0), B (0, 0.1) and C (0.3, 0) are set, with the unit of mm. The monitoring line is the center line from point O to the horizontal exit channel. Through a large number of simulation calculations, monitoring points A and B record the pressure changes of gas-liquid phase before entering the T-shaped intersection during the generation of slug flow, and monitoring point C records the pressure changes near the gas phase fracture location. The monitoring line can record the change of two-phase length and pressure during the formation of slug flow in the microchannel under different conditions.
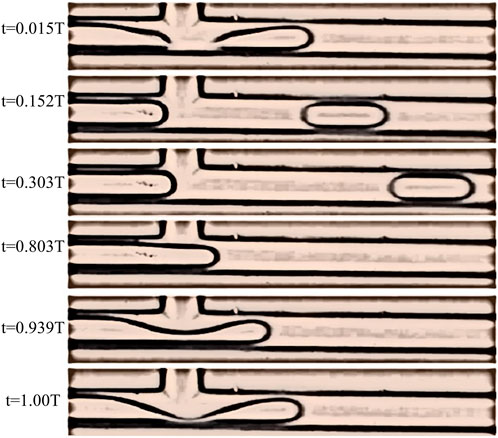
FIGURE 2. Slug flow in experiment.
The flow rate is one of the important factors that affect the characteristics of slug flow. In the experiment, the flow rate of gas phase or liquid phase can be changed according to the control variable method when two kinds of fluids are introduced. The numerical simulation can get the information of the physical field inside the channel and the characteristic length of the gas bomb. However, the simulation results need to be verified by experiments to analyze the reliability of the simulation results. Therefore, in addition to studying the influence of different gas flow rates on the aeroelastic generation characteristics, this study further compares the experimental results with the simulation results, and discusses the error between the results of the numerical model and the actual situation. Compared with the simulated flow pattern, it can be found that the formation process of the slug flow photographed in the experiment is highly similar to the simulation results on the whole. The gas phase breaks at the T-shaped intersection. Before the break, the gas phase is squeezed by the liquid phase to form a depression at the intersection. The shape of the depression and the position of the fracture of the gas phase are similar to the simulation results, which indicates that the accuracy of the simulation results at the angle of the slug flow pattern is high.
According to the subjective judgment of the reliability of the simulation results of flow patterns, further quantitative comparison is made through the length of aeroelastic characteristics. Figure 3 shows the comparison of aeroelastic characteristic lengths under different gas phase flow rates obtained from experiments and simulations. The error between the experimental and simulation results is small, and the gas phase flow rate is 56.1 μl/min. Therefore, the gas flow rate of 50 μl/min is taken as an example to study the slug flow generation process. Compared with the experimental results, the simulated gas phase characteristic length is more linear. Increasing and decreasing the gas flow rate error will increase. Based on the experimental results, the gas phase flow rate is 30 μ. The maximum error is only 5.4% at L/min. Therefore, the overall error of simulation is small at the angle of aeroelastic characteristic length. Considering the flow pattern and the characteristic length of aeroelasticity, the error between the numerical model established in this paper and the actual situation is acceptable from the subjective and quantitative perspectives, and has high reliability.
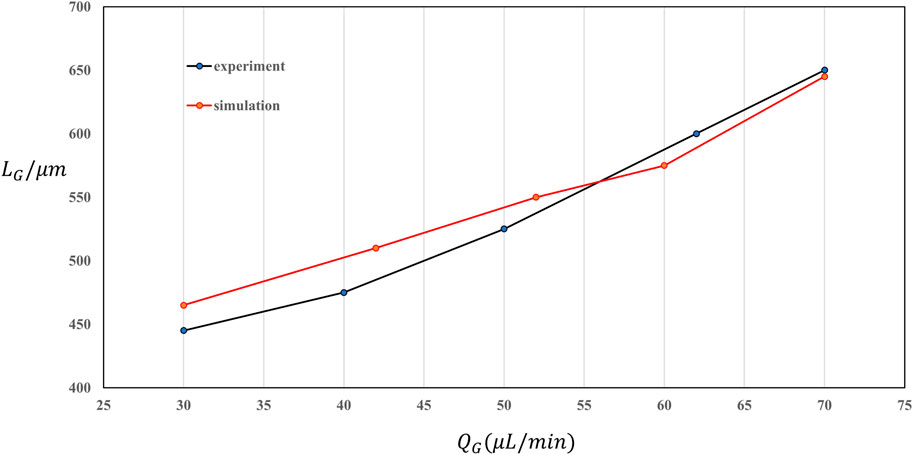
FIGURE 3. Comparison results of experiment and simulation.
As shown in Table 4, No.1∼5 are selected to study the influence of different gas phase flow rates on slug flow generation characteristics. When studying the influence of gas phase flow rate on slug flow generation characteristics, control the liquid phase flow rate to 50 μl/min, gas phase flow rate at 10 μl/min is the gradient change. The generation characteristics of slug flow mainly consider the characteristic length, generation period and generation frequency of aeroelastic. It can be seen from the table that the characteristic length of aeroelastic increases with the increase of gas phase flow rate, and the aeroelastic length is 443 μm changes to 657 μm. The variation is 214 μm. Moreover, the linear relationship between the gas elastic length and the gas flow rate is good. When the gas phase flow rate is increased, the gas entering the channel increases, making the length of the gas slug increase.
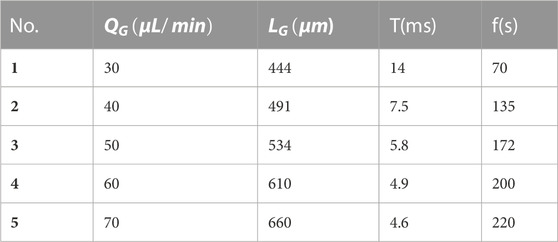
TABLE 4. Generation features of different gas flow rate.
Figure 4 shows the aeroelastic generation cycle with different gas phase flow rates. It can be seen from the figure that with the increase of gas phase flow rate, the aeroelastic generation cycle decreases rapidly at first and then gradually slows down. The aeroelastic generation period is reduced from 14 m to 4.6 m, and the corresponding aeroelastic generation frequency is increased from 71 s-1 to 217 s-1. The maximum frequency of gas slug generation is 217 s-1, and about 217 bubbles can be generated per second, which indicates that using microfluidic technology to generate microbubbles can have a high yield. In general, the gas phase flow rate has a great impact on the characteristics of aeroelastic generation, which can both make the characteristic length of aeroelastic approximate linear change and affect the aeroelastic generation period. Especially when the gas phase flow rate is low, increasing the flow rate value will make the aeroelastic generation period change significantly.
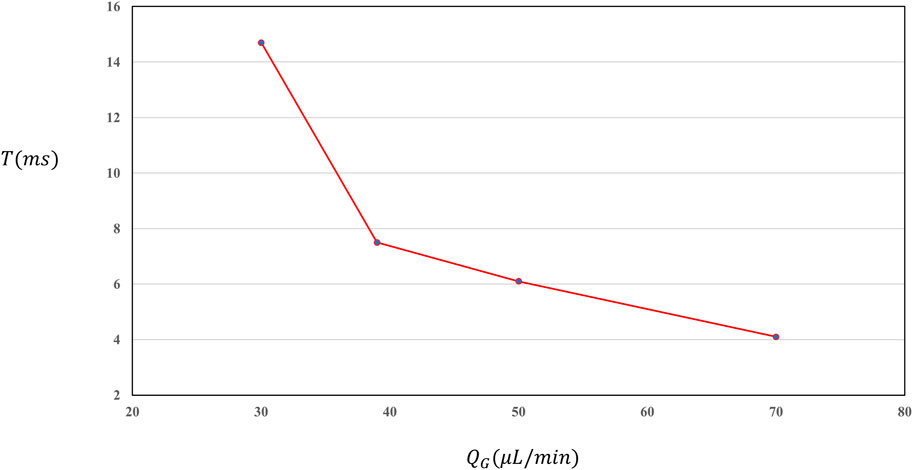
FIGURE 4. Generation cycle under different gas flow rate.
When studying the influence of different liquid flow rates on the characteristics of aeroelastic formation, five groups of conditions, namely, No. Three and No. 6–9, were selected. Fixed gas phase flow rate is 50 μl/min, the liquid phase flow rate is 10 μ L/min is the gradient change. It can be seen from Figure 5A that the characteristic length of aeroelastic under different liquid flow rates decreases with the increase of liquid flow rate. The relationship between them is linear, but the change of aeroelastic length decreases gradually. With the increase of liquid flow rate, the liquid phase fluid entering the channel increases, the resistance generated by liquid phase to gas phase increases, and the characteristic length of aeroelastic decreases. According to the aeroelastic generation characteristics in Table 5, it can be found that the aeroelastic characteristic length value ranges from 770 μm changes to 378 μm. The variation is 392 μm. Compared with the change of aeroelastic characteristic length under different gas flow rates, it is found that the change range of aeroelastic length is wider when the liquid flow rate is changed, indicating that the change of liquid flow rate has greater influence on the characteristic length of aeroelastic. The change rule of gas slug characteristic length by changing the liquid phase flow rate is just opposite to the result of changing the gas phase flow rate, indicating that the formation process of gas slug is the result of the competition between gas and liquid phases.
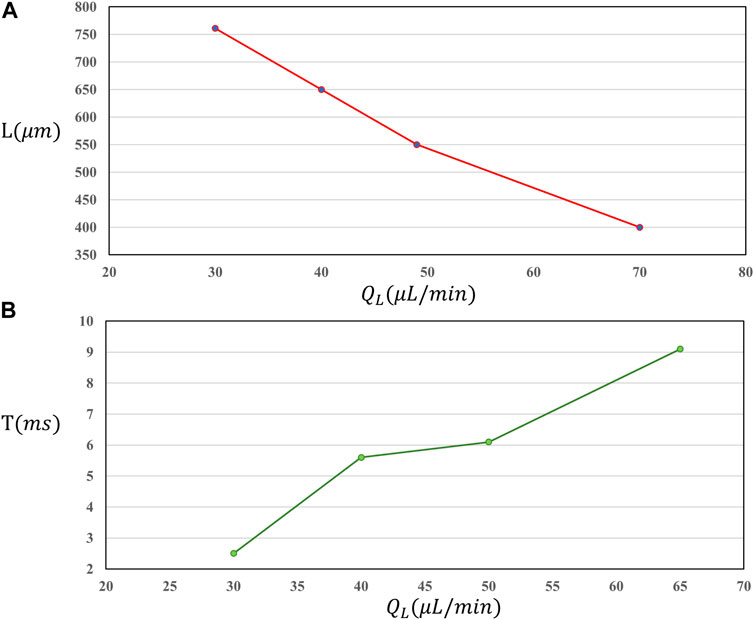
FIGURE 5. Characteristic length of slug under different liquid flow rate (A); Generation cycle under different liquid flow rate (B).
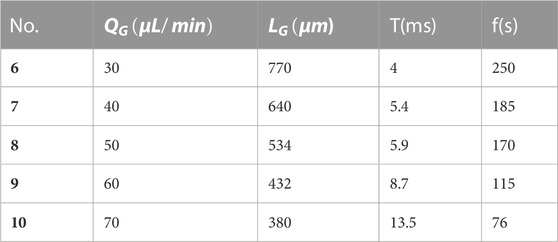
TABLE 5. Generation features of different liquid flow rate.
It can be seen from Figure 5B that the generation period of gas slug under different liquid phase flow rates is increasing with the increase of liquid phase flow rates, and the range of change is increasing as a whole. This shows that it takes longer to generate gas slugs when the gas phase flow rate is increased. From the data table, the generation cycle is increased from 4 ms to 13.4 ms, and the corresponding generation frequency is reduced from 250 s-1 to 75 s-1. By comparing the changes in gas phase flow rate, it can be found that the change range of the number of bubbles generated per second in the two methods is not much different. Therefore, in terms of aeroelastic generation cycle, the variable liquid phase flow rate and the variable gas phase flow rate have similar effects on the generation cycle. To sum up, when studying the influence of different gas-liquid two-phase flow rates on the characteristics of gas slug generation, the main difference is that the change of liquid phase flow rate has a greater impact on the characteristic length of gas slug, but the difference of gas slug generation cycle is small. Therefore, considering the characteristic length and generation cycle of gas slug, the change of liquid phase flow rate has a greater impact on the characteristics of gas slug generation than the change of gas phase flow rate.
In addition to controlling the two-phase flow rate, the physical parameters of the solution can also be changed by changing the mass fraction of the material when preparing the solution. It is mainly to change the mass fraction of sodium alginate (SA) and surfactant SDS to change the viscosity and surface tension of the solution [44].
Four conditions, No. Three and No. 10–12, were selected to study the influence of surface tension on aeroelastic generation characteristics. Fixed gas-liquid two-phase flow rate is 50 μ L/min, the mass fraction of SA is 0.1 wt%, and the mass fraction of surfactant SDS is 0.1 wt%—0.4 wt%. The surface tension values corresponding to the four different working conditions are listed in Table 6. The surface tension of the solution increases when the mass fraction of surfactant is increased. In addition, the characteristic values of aeroelastic generation under different surface tensions are also shown in Table 6.
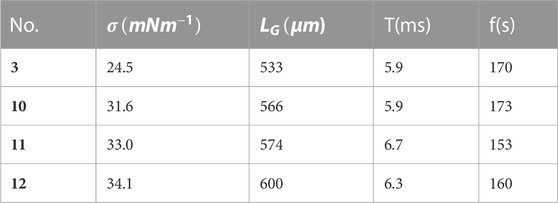
TABLE 6. Generation features of different liquid flow rate.
When the surface tension is increased, the aeroelastic characteristic length increases slightly, but the change amplitude is small. Aeroelastic characteristic length from 533 μm increased to 601 μm. The variation is 68 μm. The change range of surface tension characteristic length is smaller than that of gas-liquid two-phase flow rate (Figure 6A). It is not obvious to change the forming period of tension bomb on the solution surface. The aeroelastic generation cycle changes in about 6 m. It can also be seen from the aeroelastic generation characteristics table that the aeroelastic generation frequency is maintained at about 160 s-1. It shows that changing the surface tension of solution has little effect on the aeroelastic generation period (Figure 6B).
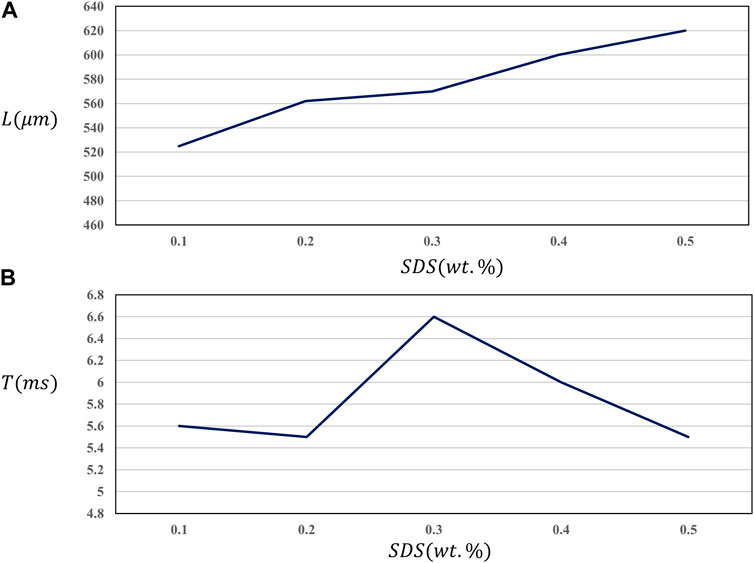
FIGURE 6. Characteristic length of slug under different surface tension (A); Generation cycle under different surface tension (B).
No. 13–16 was selected to study the influence of liquid viscosity on the characteristics of aeroelastic formation. Average gas-liquid two-phase flow rate 50 μl/min, Tween 20 mass fraction 0.1 wt%, SA mass fraction 0.1 wt%—0.4 wt%.
The viscosity values corresponding to four different working conditions are listed in Table 7, and the viscosity of solution increases with the increase of SA mass fraction. It can be seen from Figure 7A that different from the effect of surface tension, increasing the viscosity of the solution reduces the aeroelastic characteristic length, and the change range of the characteristic length gradually slows down.
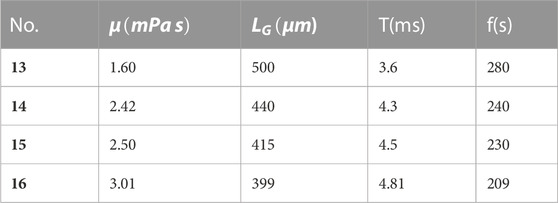
TABLE 7. Generation features of different viscosity.
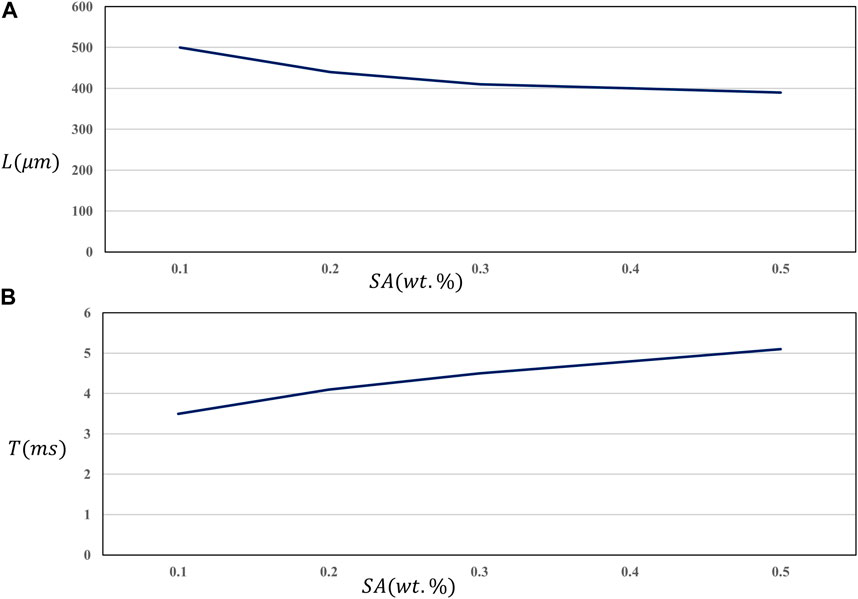
FIGURE 7. Characteristic length of slug under different viscosity (A); Generation cycle under different viscosity (B).
From the aeroelastic generation characteristic table, it can be seen that the characteristic length is from 500 μm changes to 398 μm. The variation is 102 μm. From the angle of aeroelastic characteristic length, the influence of viscosity is between the gas-liquid two-phase flow rate and surface tension. It can be seen from Figure 7B that with the increase of solution viscosity, the aeroelastic generation cycle increases slightly. It may be that when the viscosity increases, the flow resistance of the liquid phase increases, and the time required for the formation of the gas slug increases. From the value of characteristic length, increasing the viscosity of solution will help to get smaller bubbles, and the bubble generation frequency is higher than that of other working conditions. To sum up, the mixed solution of SA and Tween 20 can produce bubbles with better characteristics.
The formation of slug flow is affected by many factors, and the formation characteristics of gas slug are related to the gas-liquid two-phase flow field [45]. Ordering to the specific analysis of this experiment, the main parameters affecting the gas-liquid two-phase flow field are: gas phase flow rate
There are seven related physical quantities, i.e.,
Then the dimension power equation is solved Π Exponent in expression. Finally, we obtained:
We defined that
That is to say, the aeroelastic characteristic length L is a function of the flow ratio
Through multiple linear regression analysis, we obtained:
The results show that the index d of Weber number is far less than the indexes of flow ratio and Reynolds number, so Weber number can be ignored. Finally, the fitting function relationship is
When the channel size is constant, the aeroelastic characteristic length is positively related to the gas-liquid flow rate ratio, negatively related to the Reynolds number, and not significantly related to the Weber number. According to the practical physical significance of each dimensionless number, it is considered that in a certain range of operating conditions, increasing the gas phase flow rate and decreasing the liquid phase flow rate can increase the characteristic length of aeroelastic. In the process of flow, both inertial force and viscous force can affect the characteristic length of aeroelasticity, and the influence of surface tension can be ignored.
In gas-liquid slug flow, the viscosity of dispersed phase gas can be ignored, so the shear force of dispersed phase interface can also be ignored. However, the decrease of viscosity difference of two-phase fluid in liquid-liquid slug flow means the increase of interfacial shear force. Therefore, the hydrodynamic parameters of liquid-liquid slug flow are different from that of gas-liquid slug flow. When the number of capillaries is small, the length of liquid slug varies slightly with the increase of the number of capillaries. However, the length of liquid slug tends to decrease with the further increase of capillary number. The length of liquid slug increases with the increase of volume flow of dispersed phase and decreases with the increase of volume flow of continuous phase. The distribution of the liquid film along the length of the dispersed phase liquid slug is not uniform, which is divided into uniform liquid film region and transition region. The length of the liquid slug has no effect on the liquid film thickness, but the liquid film thickness becomes thicker with the increase of the number of capillaries. Due to the lubrication of the liquid film, the velocity of the dispersed liquid slug is slightly greater than the mixing velocity of the two phases. There is a good linear relationship between the velocity of dispersed liquid slug and the mixing velocity, and the difference between the velocity of liquid slug and the mixing velocity increases with the increasing of the mixing velocity. The two geometric shapes of the co-flow T-shaped pipe and the cross-flow (continuous phase flow is parallel to the pipe) T-shaped pipe have no effect on the hydrodynamic parameters of the slug flow. When the inlet flow rate is the same, the inlet diameter increases, and the length, liquid film thickness and velocity of dispersed liquid slug will increase.
Although the hydrodynamic characteristics and functional relationship of slug flow have been obtained in this study, the study of multiphase flow in microchannels can still be expanded and improved from other entry points, and some problems that need to be solved have also been found in the simulation study. In this study, a two-dimensional physical model was used to study the formation mechanism of slug flow in T-shaped pipes. The formation mechanism of slug flow in pipes with trapezoidal, triangular and other cross sections can be further expanded and improved by combining three-dimensional physical model with actual experimental operation. This paper mainly studies the influence of the volume flow rate of two-phase fluid on the hydrodynamic parameters. In addition, the influence of the physical properties of the fluid (viscosity, surface tension, etc.) and the contact angle on the hydrodynamic parameters of slug flow needs further study. In future work, more experimental data on the influence of inlet geometry and size on the hydrodynamic parameters of slug flow can be obtained, so as to explain the influence of inlet shape on the hydrodynamic parameters of slug flow in detail.
In this chapter, by establishing a T-shaped microchannel experimental system, connecting a high-speed camera with a micro camera system, we can conduct visual research and study the characteristics of aeroelastic generation under different control conditions. Through analysis, we can draw the following main conclusions.
1) When studying the influence of different gas flow rates on the characteristics of aeroelastic generation, the characteristic length of aeroelastic increases with the increase of gas flow rates. With the increase of the gas phase flow rate, the aeroelastic generation cycle decreases rapidly at first and then gradually slows down, and the maximum aeroelastic generation frequency is 217 s-1. By comparing the flow pattern and aeroelastic characteristic length obtained from the experiment with the simulation results, the rationality of the numerical model is further verified.
2) When the influence of different liquid flow rates is studied, the characteristic length of gas slug decreases and the generation period of gas slug increases with the increase of liquid flow rate. Aeroelastic characteristic length from 770 μm changes to 378 μm. The variation range of aeroelastic generation cycle is 4–13.4 m, and the maximum aeroelastic generation frequency is 250 s-1. The influence of liquid physical parameters on the characteristics of aeroelastic formation mainly considers the liquid surface tension and viscosity. Surface tension has little effect on aeroelastic generation characteristics. Increasing the liquid viscosity is helpful to obtain smaller microbubbles and maintain a higher generation frequency.
3) The dimensionless method is used to analyze the effect of each physical quantity on the aeroelastic characteristic length. Establish the functional relationship between the ratio of aeroelastic characteristic length to channel size L/d and dimensionless gas-liquid flow ratio
The original contributions presented in the study are included in the article/supplementary material, further inquiries can be directed to the corresponding author.
LW guided the research, implemented the calculation and simulation, wrote this article, and translated the paper and checked the language.
The work of present study is completed by LW alone. The author in present study thanks reviewers/reviewer for their contribution to improve study and Du Shuping who give the author for academic help and submit paper to Journal.
The authors declare that the research was conducted in the absence of any commercial or financial relationships that could be construed as a potential conflict of interest.
All claims expressed in this article are solely those of the authors and do not necessarily represent those of their affiliated organizations, or those of the publisher, the editors and the reviewers. Any product that may be evaluated in this article, or claim that may be made by its manufacturer, is not guaranteed or endorsed by the publisher.
1. Yang X, Guo S, Ergun K. A numerical simulation study of the impact of microchannels on fluid flow through the cement–rock interface. Appl Sci (2022) 12(9).
2. Mohammad SL. Fluid flow and heat transfer in microchannel with and without porous medium under constant heat flux. Sādhanā (2022) 47(2).
3. Bian X, Li F, Jian Y. The streaming potential of fluid through a microchannel with modulated charged surfaces. Micromachines (2021) 13(1):66. doi:10.3390/mi13010066
4. Kourosh J, Habib K, Touraj A. Lattice Boltzmann simulation of fluid flow and heat transfer in a micro channel with heat sources located on the walls. Superlattices and Microstructures (2021) 160:107069. doi:10.1016/j.spmi.2021.107069
5. Amir Hossein N, Mohammad Reza M. Impact of hydrodynamic and interfacial interactions on scale formation in a capillary microchannel. Langmuir : ACS J Surf Colloids (2021) 37:13746–56. doi:10.1021/acs.langmuir.1c02514
6. Triplett KA, Ghiaasiaan SM, Abdel-Khalik SI, Sadowski D. Gas-liquid two-phase flow in microchannels. Part I: Two-phase flow patterns. Int J Multiphase Flow (1999) 25(3):377–94. doi:10.1016/s0301-9322(98)00054-8
7. Ajeeb W, Oliveira Monica SA, Nelson M, Sohel Murshed SM. Numerical approach for fluids flow and thermal convection in microchannels. J Phys Conf Ser (2021) 2116(1):012049. doi:10.1088/1742-6596/2116/1/012049
8. Maloth RKN, Khayat RE, DeGroot CT. Bubble growth in supersaturated liquids. Fluids (2022) 7:365. doi:10.3390/fluids7120365
9. Chung PMY, Kawaji M. The effect of channel diameter on adiabatic two-phase flow characteristics in microchannels. Int J Multiphase Flow (2004) 30(7-8):735–61. doi:10.1016/j.ijmultiphaseflow.2004.05.002
10. Monakhov A, Bukharin N. Experimental study of cavitation development and secondary circulation flow between two eccentric cylinders. Fluids (2022) 7:357. doi:10.3390/fluids7110357
11. Taylor GI. Stability of a viscous liquid contained between two rotating cylinders. Philos Trans R Soc Lond (1923) 223:289–343. Series A, Containing Papers of a Mathematical or Physical Character. Transi. Roy. Soc. Lond. A. doi:10.1098/rsta.1923.0008
12. Bukharin N, El Hassan M, Omelyanyuk M, Nobes D. Applications of cavitating jets to radioactive scale cleaning in pipes. Energy Rep (2020) 6:1237–43. doi:10.1016/j.egyr.2020.11.049
13. Fu T, Ma Y. Bubble formation and breakup dynamics in microfluidic devices: A review. Chem Eng Sci (2015) 135:343–72. doi:10.1016/j.ces.2015.02.016
14. Soto M, Lohse D, van der Meer D. Diffusive growth of successive bubbles in confinement. J Fluid Mech (2020) 882:A6. doi:10.1017/jfm.2019.806
15. Yao C, Liu Y, Xu C, Zhao S, Chen G. formation of liquid-liquid slug flow in a microfluidic T-junction: Effects of fluid properties and leakage flow. Aiche J (2017) 64:346–57. doi:10.1002/aic.15889
16. Zhao C. Multiphase flow microfluidics for the production of single or multiple emulsions for drug delivery. Adv Drug Deliv Rev (2013) 65(11-12):1420–46. doi:10.1016/j.addr.2013.05.009
17. He K, Wang S, Huang J. The effect of flow pattern on split of two-phase flow through a micro-T-junction. Int J Heat Mass Transfer (2011) 54(15-16):3587–93. doi:10.1016/j.ijheatmasstransfer.2011.03.028
18. Osher S, Sethian JA. Fronts propagating with curvature-dependent speed: Algorithms based on Hamilton-Jacobi formulations. J Comput Phys (1988) 79(1):12–49. doi:10.1016/0021-9991(88)90002-2
19. Su Y, Chen G, Yuan Q. Effect of viscosity on the hydrodynamics of liquid processes in microchannels. Chem Eng Technol (2014) 37(3):427–34. doi:10.1002/ceat.201300468
20. Arias S, González-Cinca R. Analysis of the characteristic lengths in the bubble and slug flow regimes generated in a capillary T-junction. Int J Multiphase Flow (2016) 87:167–74. doi:10.1016/j.ijmultiphaseflow.2016.09.011
21. Zhu J. Superficial velocity in heterogeneous two-phase systems with truncated fractal distribution of particle concentration. Fluids (2022) 7:347. doi:10.3390/fluids7110347
22. Baas JH, Baker ML, Buffon P, Strachan LJ, Bostock HC, Hodgson D, et al. Blood, lead and spheres: A hindered settling equation for sedimentologists based on metadata analysis. Depos Rec (2022) 8:603–15. doi:10.1002/dep2.176
23. Lockett MJ, Al-Habbooby HM. Relative particle velocities in two-species settling. Powder Technol (1974) 10:67–71. doi:10.1016/0032-5910(74)85033-3
24. Sun Z, Zhu J. A four-quadrant flow regime map for two-phase liquid-solids and gas-solids fluidization systems. Powder Technol (2021) 394:424–38. doi:10.1016/j.powtec.2021.08.050
25. Guo F, Chen B. Numerical study on taylor bubble formation in a micro-channel T-junction using VOF method. Microgravity Sci Tech (2009) 21(S1):51–8. doi:10.1007/s12217-009-9146-4
26. Chen S, Liu K, Liu C, Wang D, Ba D, Xie Y, et al. Effects of surface tension and viscosity on the forming and transferring process of microscale droplets. Appl Surf Sci (2016) 388:196–202. doi:10.1016/j.apsusc.2016.01.205
27. Kandlikar SG, Grande WJ. Evolution of microchannel flow passages-thermohydraulic performance and fabrication technology. Heat Transfer Eng (2003) 24(1):3–17. doi:10.1080/01457630304040
28. Deng Y, Zhu C, Fu T, Ma Y. Coalescence dynamics of nanofluid droplets in T-junction microchannel. Chem Eng Sci (2023) 265:118243. doi:10.1016/j.ces.2022.118243
29. Yin Y, Zhang X, Zhu C, Fu T, Ma Y. Formation characteristics of Taylor bubbles in a T-junction microchannel with chemical absorption. Chin J Chem Eng (2022) 46:214–22. doi:10.1016/j.cjche.2021.06.002
30. Chen JF, He K, Huang JZ, Li F, Wang S. Study of phase splitting at a micro-T-junction. Heat Transfer Eng (2014) 35(11-12):1114–21. doi:10.1080/01457632.2013.863133
31. Saieed A, Pao W, Hashim FM. Effect of T-junction diameter ratio on stratified-wavy flow separation. J Nat Gas Sci Eng (2018) 51:223–32. doi:10.1016/j.jngse.2018.01.015
32. Wang L, Yang YR, Li YX, Wang L Dynamic behaviors of horizontal gas-liquid pipes subjected to hydrodynamic slug flow: Modeling and experiments. Int J Press Vessels Piping (2018) 161:50–7.
33. Kim S, Sang YL. Split of two-phase plug flow with elongated bubbles at a micro scale branching T-junction. Chem Eng Sci (2015) 134:119–28. doi:10.1016/j.ces.2015.04.020
34. Davis MR, Fungtamasan B. Two-phase flow through pipe branch junctions. Int J Multiphase Flow (1990) 16(5):799–817. doi:10.1016/0301-9322(90)90005-4
35. Li HW, Li JW, Zhou YL, Liu B, Sun B, Yang D, et al. Phase split characteristics of slug and annular flow in a dividing micro-T-junction. ExperimentalThermal Fluid Sci (2017) 80:244–58. doi:10.1016/j.expthermflusci.2016.08.024
36. Sun WC, Liu YC, He K, Wang S. The phase distribution of gas-liquid two-phase flow in microimpacting T-junctions with different branch channel diameters. Chem Eng J (2018) 333:34–42. doi:10.1016/j.cej.2017.09.136
37. Chen JF, Wang SF, Ke HF, Zhou M, Li X. Experimental investigation of annular two-phase flow splitting at a microimpacting T-junction. Chem Eng Sci (2014) 118(9):154–63. doi:10.1016/j.ces.2014.07.018
38. Yang ZC, Bi QC, Liu B, Huang K. Nitrogen/non-Newtonian fluid two-phase upward flow in non-circular microchannels. Int J Multiphase Flow (2010) 36(1):60–70. doi:10.1016/j.ijmultiphaseflow.2009.07.011
39. DziubinskI M, Fidos H, Sosno M. The flow pattern map of a two-phase non-Newtonian liquid-gas flow in the vertical pipe. Int J Multiphase Flow (2004) 30(6):551–63. doi:10.1016/j.ijmultiphaseflow.2004.04.005
40. Wang SF, Huang JZ, He K, Chen J. Phase split of nitrogen/non-Newtonian fluid two-phase flow at a micro-T-junction. Int J Multiphase Flow (2011) 37(9):1129–34. doi:10.1016/j.ijmultiphaseflow.2011.06.014
41. He K, Wang SF, Huang JZ. The effect of surface tension on phase distribution of two-phase flow in a micro-T-junction. Chem Eng Sci (2011) 66(17):3962–8. doi:10.1016/j.ces.2011.05.027
42. He K, Wang SF, Zhang LZ. Transient split features of slug flow at an impacting micro-T-junction: A numerical study. Int J Heat Mass Transfer (2017) 112:318–32. doi:10.1016/j.ijheatmasstransfer.2017.04.106
43. Aissa A, Silmani MEA, Mebarek-Oudina F, Fares R, Zaim A, Kolsi L, et al. Pressure-driven gas flows in micro channels with a slip boundary: A numerical investigation. FDMP-Fluid Dyn Mater Process (2020) 16(2):147–59. doi:10.32604/fdmp.2020.04073
44. Gourari S, Mebarek-Oudina F, Makinde OD, Rabhi M. Numerical investigation of gas-liquid two-phase flows in a cylindrical channel. Defect and Diffusion Forum (2021) 409:39–48. doi:10.4028/www.scientific.net/ddf.409.39
Keywords: t-junction microchannel, numerical simulation, slug flow, phase interface, fluid characteristic
Citation: Wang Ll (2023) Study on effect of gas-liquid two phase physical feature on slug flow in microchannels. Front. Phys. 11:1125220. doi: 10.3389/fphy.2023.1125220
Received: 16 December 2022; Accepted: 02 March 2023;
Published: 13 March 2023.
Edited by:
Angiolo Farina, University of Florence, ItalyReviewed by:
Fateh Mebarek-Oudina, University of Skikda, AlgeriaCopyright © 2023 Wang. This is an open-access article distributed under the terms of the Creative Commons Attribution License (CC BY). The use, distribution or reproduction in other forums is permitted, provided the original author(s) and the copyright owner(s) are credited and that the original publication in this journal is cited, in accordance with accepted academic practice. No use, distribution or reproduction is permitted which does not comply with these terms.
*Correspondence: Lin lin Wang, bGlubGlud2FuZ0B4YXdsLmVkdS5jbg==
Disclaimer: All claims expressed in this article are solely those of the authors and do not necessarily represent those of their affiliated organizations, or those of the publisher, the editors and the reviewers. Any product that may be evaluated in this article or claim that may be made by its manufacturer is not guaranteed or endorsed by the publisher.
Research integrity at Frontiers
Learn more about the work of our research integrity team to safeguard the quality of each article we publish.