 Xueguang Meng1*
 Chengjian Deng
 Shujie Jiang
94% of researchers rate our articles as excellent or good
Learn more about the work of our research integrity team to safeguard the quality of each article we publish.
Find out more
ORIGINAL RESEARCH article
Front. Phys., 22 February 2023
Sec. Biophysics
Volume 11 - 2023 | https://doi.org/10.3389/fphy.2023.1125205
The jellyfish-like flying machine is a new development direction of the future bionic flapping-wing aircraft besides the insect-mimic and bird-mimic micro air vehicles (MAVs). To better understand the underlying fluid mechanisms of the jellyfish-like flyer, we numerically simulated the aerodynamic forces of the three-dimensional flapping wings under different control parameters. The effects of flapping amplitude, vortex wake, up-flight speed, and wing–wing interaction on aerodynamic performance were investigated. The results show that, at hovering, the mean lift rises rapidly at first and then tends to be stable with the increase in flapping amplitude. The vortex wake can improve the lift at large flapping amplitudes, while it reduces the lift at very small flapping amplitudes. With the increase in up-flight speed, the lift decreases. However, the sources of lift reduction are different for different flapping amplitudes. When the two wings flap together and the distance between the wings is small enough, the wing–wing interaction can improve the lift by about 15% compared with that of a single wing, but much higher power is required, resulting in lower efficiency. The results of this study provide new insights into the flight mechanism of the jellyfish-like aircraft and have important guiding significance for the design and optimization of the jellyfish-like flying machine.
After hundreds of millions of years of evolution, flying creatures can obtain astonishing aerodynamic performance by flapping wings, which has become the inspiration for designing bionic aircraft. The design of bionic aircraft is generally based on two typical types of motion: the lift-based stroke in a horizontal plane (also termed the normal mode) [1], like that of the hummingbird, and the drag-based paddling stroke in a vertical plane [2], like that of the dragonfly. Since the conventional steady-state aerodynamic theory is insufficient to explain the high aerodynamic force coefficients required by these small creatures [3], much endeavor has been put into obtaining the unsteady aerodynamic interpretations. The revealed unsteady aerodynamic mechanisms include delayed stall, rapid pitching rotation, rapid acceleration (or added mass), clap and fling, and wake capture [4–7]. Although the flapping-powered robotic flyer shows great potential in producing high aerodynamic forces and energy efficiency relying on these unsteady mechanisms, it also needs to be equipped with feedback control systems to maintain stable flight due to its inherent instability [8–11].
In an experimental study, Childress et al. [12] observed that a pyramid-shaped flexible body with an array of four wings can achieve a stable hovering within a vertically oscillating airflow. Motivated by this experiment, Ristroph and Childress [13] developed a prototype of the jellyfish-like flying machine. This flapping-wing air vehicle can achieve self-righting hovering by opening and closing four downward-pointing wings, without relying on additional aerodynamic surfaces and without feedback control. Each wing of the aircraft was hinged on the upper horizontal loop and rotates around a pivot point, which is very similar to the simple pitching motion. This provides a new way of movement for designing bionic aircraft.
This intrinsically stable jellyfish-like flying machine and the relatively simple actuation motion attracted the attention of researchers, prompting them to carry out more detailed research on the aerodynamics and flows of such flyers. Using two-dimensional (2D) models, Fang et al. [14] and Zhang et al. [15] explored the aerodynamics and flight dynamics of the flying machine with theoretical and numerical methods, respectively. Both studies found that pitching amplitude and wing separation played a determining role in the locomotion state and aerodynamic performance. In addition, Zhang et al. [16] simulated the passive flight of a pair of 2D flexible pitching foils with a concave-down configuration in the vertically oscillating airflow. It was shown that flexibility can strongly affect the weight-supporting capability and stability of the flyer.
It is worth noting that all the aforementioned studies that were carried out on the jellyfish-like aircraft are 2D studies. More recently, Liu et al. [17] experimentally investigated the effect of the time asymmetric pitching motion on the lift generation and the flow-field characteristics of this kind of ornithopters, which is the only three-dimensional (3D) research on hovering. They found that the fast downstroke and slow upstroke pitching pattern was superior to symmetric pitching. Although the flow-field was 3D in their study, the vortex structures were still displayed by the 2D PIV measurement. The evolution of the side-edge vortex was not considered, and its effect on the forces of the wing remains unclear so far. The experimental study by Buchholz and Smits [18] demonstrated that the streamwise vorticity formed at the 3D panel edges tended to dominate the wake formation. Other studies [19–21] have also demonstrated that the 3D effect plays a key role in the formation of vortices and the aerodynamic performance of the flapping wings. Therefore, with respect to this jellyfish-like flyer, it is still far from being possible to fully understand the details of 3D vortex evolution and aerodynamics, especially the vortex structures around all edges of the wing.
In contrast to the previous 2D studies, this paper numerically investigated the aerodynamics of 3D flapping wings employing the locomotion of the jellyfish-like flyer. The hovering was emphasized because it is an indispensable flight mode for MAVs to perform special tasks. This is also different from most other works, which studied the pitching wing in an incoming flow [18–21]. The aerodynamic performance under some key motion parameters was examined and related to the flow fields. In addition, the wing–wake interaction was also considered, which was neglected in previous studies. The remainder of the paper is organized as follows: the wing motion and the numerical method with its validation are described in Section 2. The simulated results are presented in Section 3. In Section 3.1, the influence of flapping amplitude on the aerodynamics of a single wing under hovering conditions is studied first, and then the vortex structures are examined in detail. The role of vortex wake is also emphasized in Section 3.2. Next, the effect of up-flight speed on aerodynamic performance is investigated in Section 3.3. Finally, in Section 3.4, the interference effect between wings is studied and comparisons with relevant biological data are presented. In Section 4, we summarize the conclusions and discuss future research avenues.
In this work, the wing was modeled as a flat plate with rounded edges. The wing shape is similar to the teardrop-shaped wing of the jellyfish-like aircraft manufactured by Ristroph and Childress [13] (Figure 1A). The aspect ratio
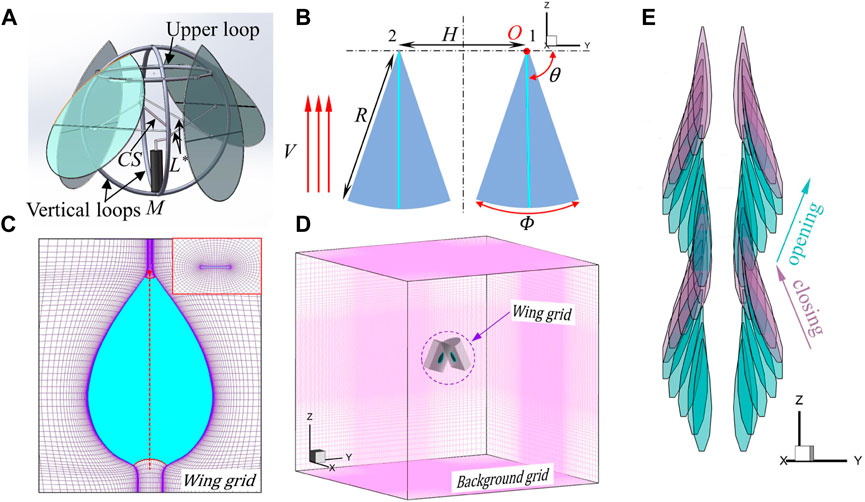
FIGURE 1. (A) Three-dimensional model of the jellyfish-like flying machine manufactured by Ristroph and Childress [13]. The prototype pulls in and pushes out four wings by using a motor (M) to rotate a crankshaft (CS) that connects via a link (L*) to each wing. The body of the flyer consists of two crossed vertical loops that support the motor below and a horizontal upper loop. More detailed information about this flyer can be found in [13]. (B) Simplified wing-pair model. Here, V is the up-flight speed;
To facilitate the flow-field analysis, one opposing pair of wings was used instead of the bell-like configuration of four pieces of wings in the original prototype of the ornithopter. It should also be noted that the simple drive mechanism shown in Figure 1A does not close all four wings simultaneously but rather causes one opposing pair to lead the other by a quarter period. Figure 1B illustrates the pitching motion. The two wings flap about the wing root with a mirror-symmetric sinusoidal pitching motion in time. The origin of the Cartesian coordinates OXYZ coincides with the pivot of the right wing, with the Y-axis passing through the two wing roots and the Z-axis pointing vertically upward (Figure 1B). The wings can move upward at a speed of V, and
where n is the wingbeat frequency and t is the time. A dimensionless time (τ) is defined as that varies between 0 and 1 for each flapping cycle. One flapping cycle includes two strokes, with
This paper first studied the aerodynamics of a single wing (the right wing) at different flapping amplitudes and up-flight speeds, assuming that the wing–wing spacing is large enough and there is no interference between the left and right wings. The opening angle for the single wing was set at
The flows and aerodynamic forces were computed using the method of computational fluid dynamics (CFD), and the laminar flow model was used due to the low Reynolds number. The governing equations of the flow are the three-dimensional incompressible unsteady Navier–Stokes (N–S) equations:
In the aforementioned equations,
Here, Re is the Reynolds number, and
The method for solving the N–S equations is the same as that in the previous studies [23, 24]. The algorithm is based on the method of artificial compressibility developed by Rogers et al. [25] and Rogers and Pulliam [26]. To discretize the time derivative of the momentum equations, a three-point backward differencing formula with second-order accuracy is used. Moreover, a pseudo-time and a pseudo-time derivative of pressure are introduced into the continuity equation. The resulting system of equations is iterated in pseudo-time. As long as the pressure derivative in pseudo-time approaches zero, the velocity divergence at the new time level approaches zero. The derivatives of the viscous fluxes in the momentum equation are approximated using second-order central differences. The upwind differencing method based on the flux-difference splitting technique is used for the derivatives of convective fluxes. For points located close to boundaries, the second-order upwind differencing is employed; for points located toward the interior, the third-order upwind differencing is used. This algorithm was described in detail in [25, 26]. Under the far-field boundary conditions, at the inflow boundary, the relative velocity at the boundary is used to determine the velocity components, while pressure is extrapolated from the interior; at the outflow boundary, the velocity is extrapolated from the interior, and pressure is set to be equal to the static pressure of the still air. On the wing surfaces, impermeable wall and no-slip boundary conditions are applied, and the pressure on the boundary is obtained through the normal component of the momentum equation written in the moving coordinate system.
To facilitate the study of the wing–wing interaction, the technique of moving overset grids was employed. Figures 1C, D show the grid system that consists of two body-fitted curvilinear wing grids that extend a relatively short distance from the wing surfaces and a Cartesian background grid that extends to the domain’s far-field boundaries. The wing grid captures features such as boundary layers, separated vortices, and vortex–wing interactions, and the background grid captures the vortex wake and carries the solution to the far field. Data are interpolated from one grid to another at the inter-grid boundary points using tri-linear interpolation. The wing grid (O-H type) was created using a Poisson solver, which was based on the work of Hilgenstock [27]. It allows fast generation of the three-dimensional wing grid with full boundary control. The background grid was generated algebraically. The non-dimensional time step (
After the pressure and velocity of the fluid are obtained, the aerodynamic forces are calculated by integrating the pressure and the viscous stresses on the wing surface. The lift (
The code has been verified by comparing the calculated forces with those of experimental measurement of flapping insect wings [28]. It showed that the calculated results matched the experimental measurements closely. To further ensure that our code is correct, Figure 2 compares our calculations with the work of Li and Lu [29], which studied the forces of pitching and heaving flat plates in an incoming flow. Again, the aerodynamic data are in good agreement. In addition, according to the previous research of our group [24], this flow solver can accurately predict the wing–wing or wing–wake interactions.
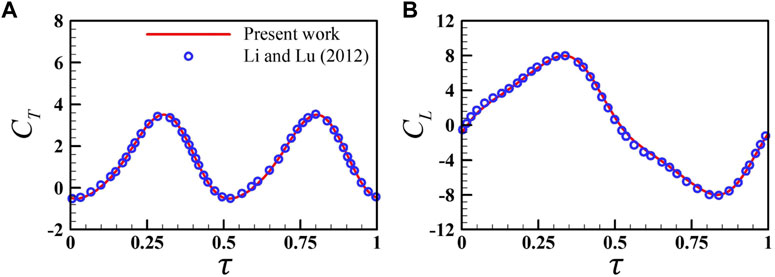
FIGURE 2. Comparison of the present instantaneous lift coefficient (A) and drag coefficient (B) with previous data obtained by Li and Lu [29] for a rectangular plate with an aspect ratio of 0.5 at
As mentioned in Section 2.2, the non-dimensional wingbeat period (
In this section, the aerodynamics and flow structures of a single wing under the condition of hovering are simulated first because hovering is an important flight mode for the MAVs to perform specific tasks. The amplitude of pitching is varied from
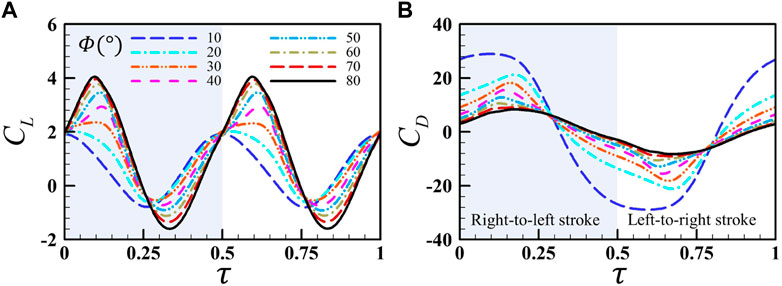
FIGURE 3. Comparison of the instantaneous lift coefficient (A) and drag coefficient (B) of a single wing for different flapping amplitudes
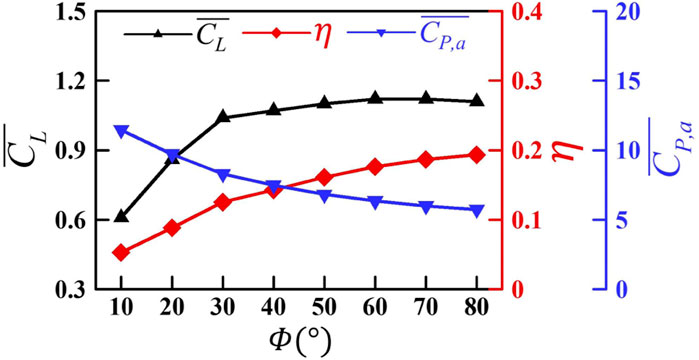
FIGURE 4. Variation in the mean lift coefficient
Next, we further discuss the vortex structures around the wing under different flapping amplitudes. Figure 5 illustrates the evolution of the vortex structures around the wing at eight typical instants during one flapping cycle at
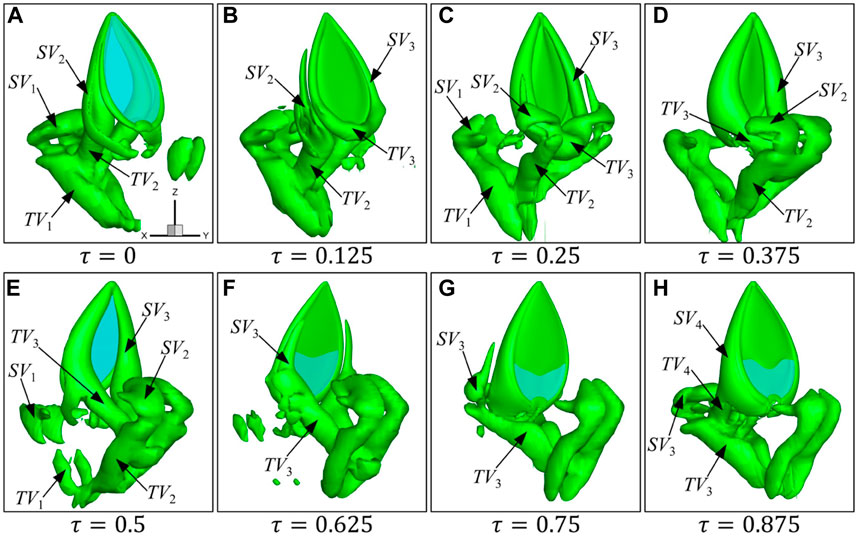
FIGURE 5. Formation and evolution of vortices at eight typical instants (A–H) during one flapping cycle for a single wing at
As shown in Figure 5, when the wing starts to flap from right to left (
The vortex structures under different flapping amplitudes at
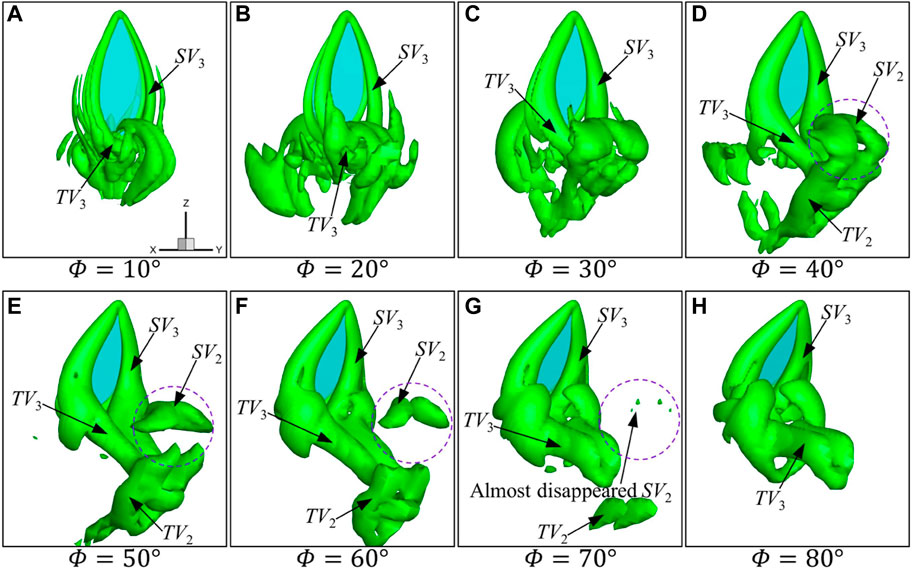
FIGURE 6. Instantaneous vortex structure of the wing for different amplitudes at Φ (A–H)
The iso-surfaces of time-averaged velocity
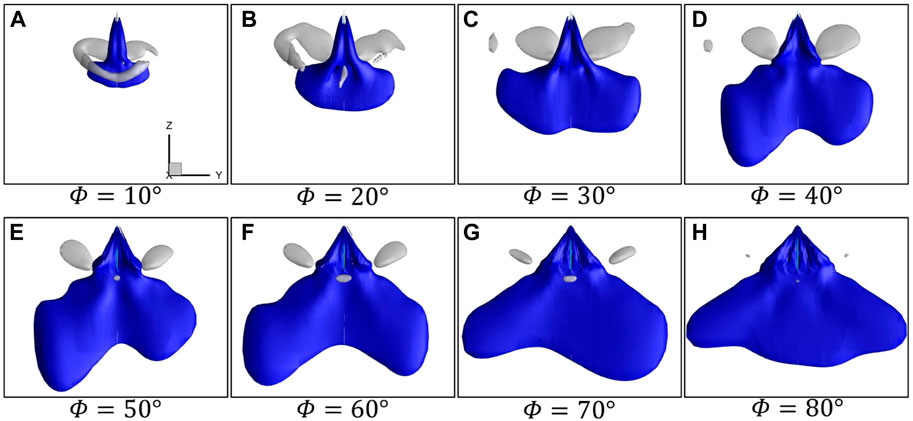
FIGURE 7. Iso-surfaces of time-averaged velocity
According to the vortex structures and downwash in Figure 6 and Figure 7, it can be summarized that with the increase in the flapping amplitude from 10° to 40°, SV and TV on the wing surface are significantly enhanced, forming a stronger vortex ring to induce stronger downwash, thus causing a larger lift. As the flapping amplitude increases further, the vortex wake, as well as the accompanying downwash, mainly widens in the horizontal direction, but the strength of the vortex and the downwash in the vertical direction changes little, resulting in basically no change in the lift.
For flapping wings at hovering, the vortices are convected away from the wing at a very small speed due to the lack of incoming flow. Hence, as a wing decelerates and reverses to start the next stroke, the wing inevitably captures and interacts with the remaining wake from the previous stroke. It is necessary to explore the wake effect under different amplitudes at hovering, which has not been examined for the jellyfish-like wing motion in previous studies.
The contribution of wake capture to the aerodynamic force is isolated by comparing the averaged lift force of the first stroke when the wing starts to flap in a quiescent fluid and the wake effect is absent, with that of the ninth stroke after the periodic flow field has been established. The results are shown in Figure 8. It is seen that with the increase in
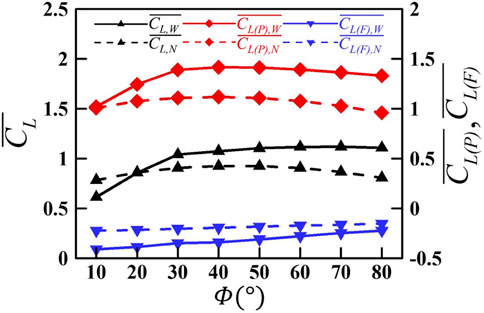
FIGURE 8. Variation in the mean lift and the pressure- and friction-based lift of the wing as a function of the flapping amplitude
Next, we analyzed the case of
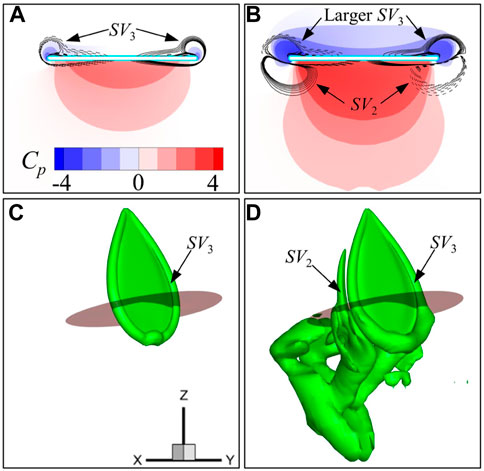
FIGURE 9. Pressure and spanwise vorticity (
For the first stroke, only SV3 is generated at this time instant (Figures 9A, C). In contrast, for the ninth stroke in Figures 9B, D, besides the newly generated SV3 on the upper wing surface, two edge vortices (SV2) can be seen on the lower surface of the wing, and they are part of the vortex ring generated in the preceding stroke (Figure 9D). The two edge vortices (SV2) or the previous vortex ring can induce favorable fluid velocity toward the lower surface of the wing, resulting in higher pressure as shown in Figure 9B. Furthermore, it is noted that on both edges of the wing, the vorticity signs of the newly generated vortex and wake vortex are opposite (Figure 9B). Therefore, as the wing approaches the vortex wake, narrow channels are formed between SV3 and SV2, which will accelerate the fluid in the middle and promote the strength of SV3 at the same time. As a result, larger side-edge vortices (SV3) are generated on the upper wing surface, resulting in lower pressure. This wake capture effect is similar to the findings of Birch and Dickinson [32], and Lua et al. [33]. These findings indicated that the wake capture can improve the lift of insect wings. However, it is somewhat different from the study of Wu and Sun [34], which shows that the vortex wake can reduce the lift of the wing by generating a downwash.
It has been shown in Figure 6 that with the decrease in flapping amplitude, the strength of the vortex gets weaker. At
The reason for the negative CL(F) is easy to understand. The flapping wing obtains upward reaction force by driving the fluid to convect downward. The downward movement of fluid causes a velocity gradient near the wing surface, which can result in the negative lift. When there is a vortex wake, the downward velocity will be enhanced by the downwash, leading to an increase in the friction force. Thus, the negative friction-based lift becomes smaller when there is a vortex wake.
By changing the flapping amplitude, the jellyfish-like aircraft can switch between hovering, ascending, and forward flight states [13]. In this section, we further explored the aerodynamic performance of a single wing at different up-flight speeds (V, see Figure 1B). Figure 10 plots the mean lift coefficient
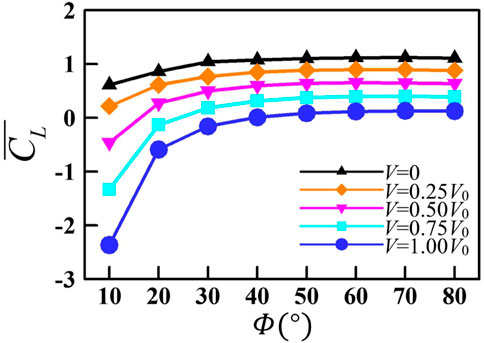
FIGURE 10. Variation in the mean lift coefficient
The vortex structures of the wing with different up-flight speeds at
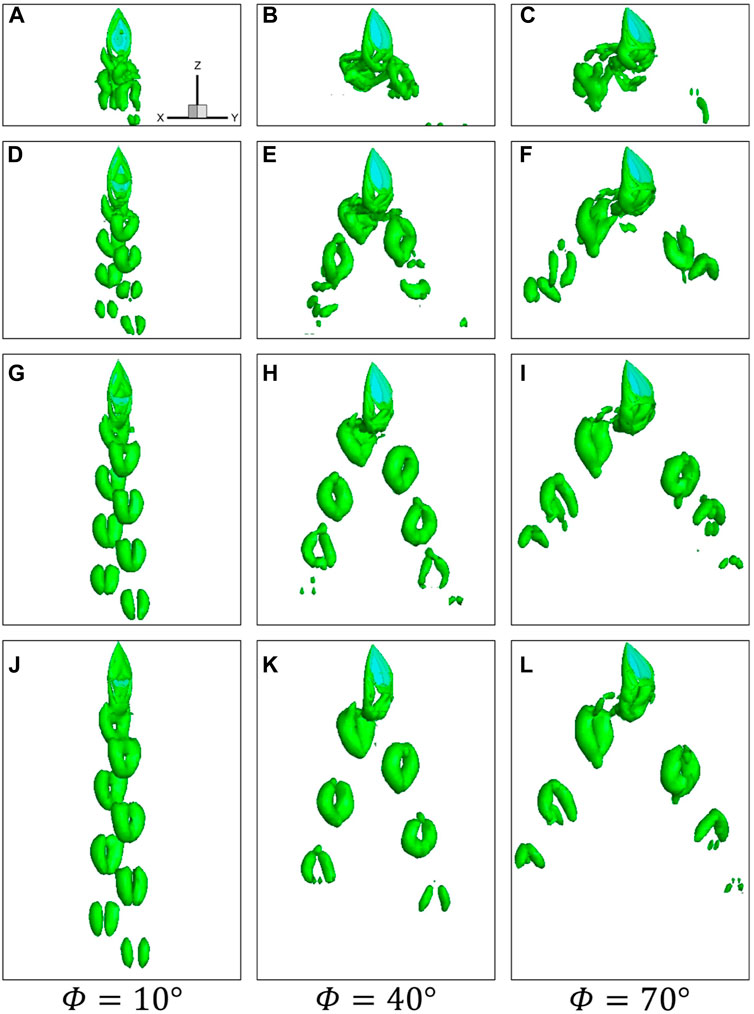
FIGURE 11. Instantaneous vortical structures visualized by the iso-surface of
Figure 12 plots the instantaneous lift coefficients and its two components (CL, CL(P), and CL(F)) of the wing for
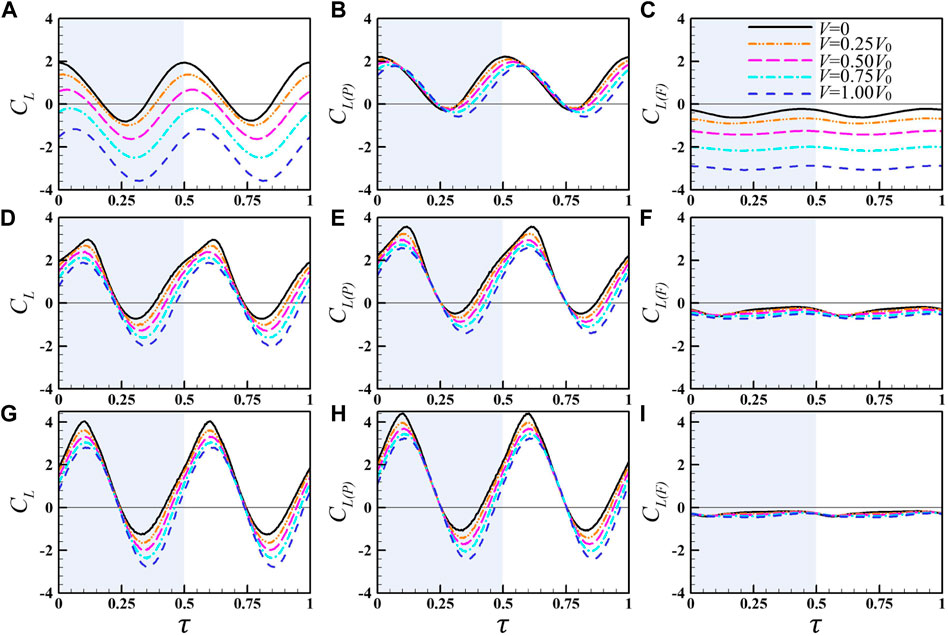
FIGURE 12. Instantaneous lift coefficients and its two components (the pressure-based lift and friction-based lift) of the wing for
When
Using the wing-pair model in Section 2.1, we explored the effect of the aerodynamic interaction between two wings at different separations (H, see Figure 1B) at the hovering state. The opening angle
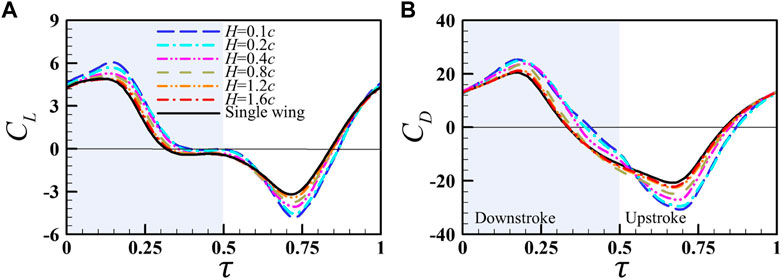
FIGURE 13. Instantaneous (A) lift and (B) drag coefficients of the right wing of the wing pair at different wing–wing separations (H), with the results of the single wing for comparison.
The flow-field information of two wing-pair cases (
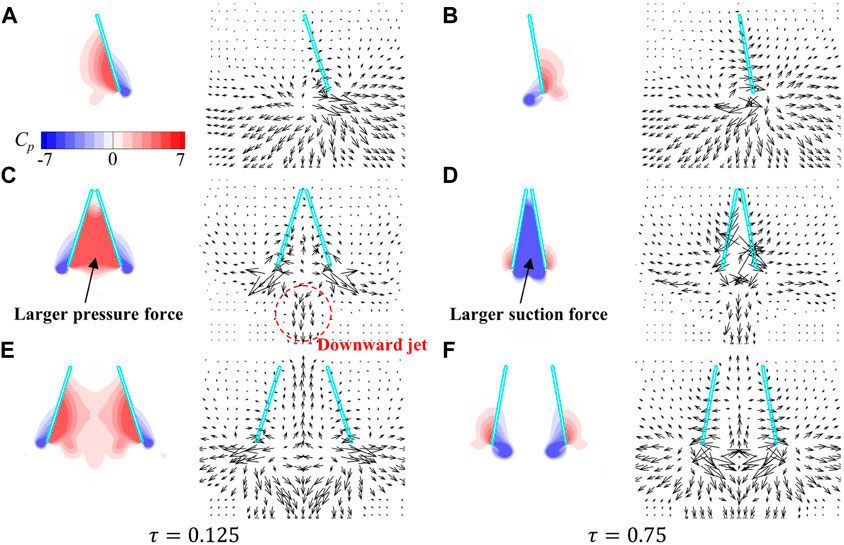
FIGURE 14. Pressure contours and the velocity vectors around the wings in the YOZ plane for the (A,B) single wing case, (C,D)
The variation in
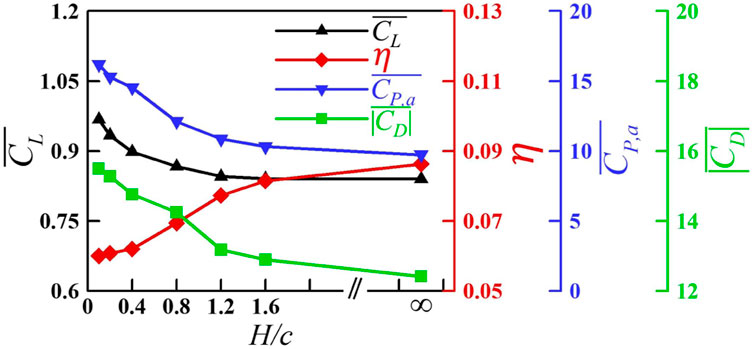
FIGURE 15. Variation in
It is instructive to test our calculation results against biological observations. For real jellyfish, there are two main mechanisms for propulsion [39]. One is the jet propulsion mechanism used by the elongated jellyfish. During the contraction stroke of the elongated jellyfish, it drives the entire bell and creates a powerful jet in the subumbrellar cavity. Periodic bell contractions cause the ejected jets to form a series of uniform vortex rings with the same rotational direction in the wake. This motion can produce rapid acceleration and swimming speed but require high energy expenditure. The other is the “rowing mechanism” used by the oblate jellyfish [40]. For oblate jellyfish, contractions occur primarily at the bell margin, which is similar to using paddles (the bell margin) to row a boat (the body). An oblate jellyfish produced periodic vortex wake instead of strong jets. A train of closely spaced vortex ring pairs was formed in the wake and convected downstream. This motion was more efficient in propulsion. For the numerical results in this study, the velocity fields at
By solving the incompressible Navier–Stokes equation, we numerically investigated the aerodynamic performance of the flapping wing of the jellyfish-like flyer under some control parameters, including the flapping amplitude, up-flight speed, and the spacing of the wing pair. The wake capture effect and wing–wing interaction were emphasized and discussed. Different from previous 2D models, the 3D wing model with a shape similar to that of the jellyfish-like aircraft wing was used in this study.
With the increase in the flapping amplitude, the lift of the wing first rises rapidly and then becomes approximately stable. As the flapping amplitude increases from 10° to 40°, the vortices generated at the wing edge are significantly enhanced, forming an intenser vortex ring to induce stronger downwash. When the flapping amplitude increases further, the vortex wake, as well as the accompanying downwash, mainly widens in the horizontal direction, but the strength of the vortex and the downwash in the vertical direction changes little, resulting in basically no change in lift.
The wake capture effect changes from reducing the lift at
When the wing has an up-flight speed, the variation in lift with amplitude is similar to the results at hovering. At a specific
The aerodynamic effect of the wing–wing interaction was also studied. It is found that when the distance between wings is small enough, the wing–wing interaction can improve the lift of the wing, but it requires more power consumption and results in lower efficiency, which is unfavorable to the aircraft. When the wings’ spacing is the same as that of the prototype of the jellyfish-like flyer, the aerodynamic interference between multiple wings can be neglected.
The findings in this study may shed some light on further understanding of the aerodynamics of the jellyfish-like flapping wing and provide useful insights into the future design of jellyfish-like aircraft. While the flyer is described as being “jellyfish-like”, there are some apparent differences between the kinematics of its wings and that of a jellyfish’s bell. During swimming, jellyfish contracts and expands the soft deformable bell very complicatedly, with asymmetries in the contraction and expansion phases. Therefore, it is necessary to consider the effects of flexibility and time asymmetry motion while adopting the 3D wing model, as well as to evaluate the postural stability of the air vehicle.
The original contributions presented in the study are included in the article/supplementary material, further inquiries can be directed to the corresponding author.
XM, DW, and SJ conceived the project. CD carried out the simulations. All the authors performed the data analyses. XM wrote the manuscript with contributions from CD, DW, and SJ.
This research was sponsored by grants from the National Natural Science Foundation of China (No. 12172276), the Foundation of National Key Laboratory of Science and Technology on Aerodynamic Design and Research (No. 614220121020116), and the Laboratory of Aerodynamic Noise Control (No. 2101ANCL20210101) governed by China Aerodynamics Research and Development Center.
The authors declare that the research was conducted in the absence of any commercial or financial relationships that could be construed as a potential conflict of interest.
All claims expressed in this article are solely those of the authors and do not necessarily represent those of their affiliated organizations, or those of the publisher, the editors, and the reviewers. Any product that may be evaluated in this article, or claim that may be made by its manufacturer, is not guaranteed or endorsed by the publisher.
1. Wood RJ. The first takeoff of a biologically inspired at-scale robotic insect. IEEE Trans Rob (2008) 24:341–7. doi:10.1109/TRO.2008.916997
2. Ratti J, Vachtsevanos G. A biologically-inspired micro aerial vehicle: Sensing, modeling and control strategies. J Intell Rob Syst (2010) 60:153–78. doi:10.1007/s10846-010-9415-x
3. Ellington CP. The aerodynamics of hovering insect flight. IV. Aerodynamic mechanisms. Philos Trans R Soc B (1984) 305:79–113. doi:10.1098/rstb.1984.0052
4. Ellington CP, Van Den Berg C, Willmott AP, Thomas ALR. Leading-edge vortices in insect flight. Nature (1996) 384:626–30. doi:10.1038/384626a0
5. Dickinson MH, Lehmann FO, Sane SP. Wing rotation and the aerodynamic basis of insect flight. Science (1999) 284:1954–60. doi:10.1126/science.284.5422.1954
6. Sun M, Tang J. Unsteady aerodynamic force generation by a model fruit fly wing in flapping motion. J Exp Biol (2002) 205:55–70. doi:10.1242/jeb.205.1.55
7. Lighthill MJ. On the Weis-Fogh mechanism of lift generation. J Fluid Mech (1973) 60:1–17. doi:10.1017/S0022112073000017
8. Lyu YZ, Sun M. Dynamic stability in hovering flight of insects with different sizes. Phys Rev E (2022) 105:054403. doi:10.1103/PhysRevE.105.054403
9. Taylor GK, Krapp HG. Sensory systems and flight stability: What do insects measure and why? Adv Insect Physiol (2007) 34:231–316. doi:10.1016/S0065-2806(07)34005-8
10. Ma KY, Chirarattananon P, Fuller SB, Wood RJ. Controlled flight of a biologically inspired, insect-scale robot. Science (2013) 340:603–7. doi:10.1126/science.1231806
11. Ristroph L, Bergou AJ, Ristroph G, Coumes K, Berman GJ, Guckenheimer J, et al. Discovering the flight autostabilizer of fruit flies by inducing aerial stumbles. Proc Natl Acad Sci U S A (2010) 107:4820–4. doi:10.1073/pnas.1000615107
12. Childress S, Vandenberghe N, Zhang J. Hovering of a passive body in an oscillating airflow. Phys Fluids (2006) 18:117103. doi:10.1063/1.2371123
13. Ristroph L, Childress S. Stable hovering of a jellyfish-like flying machine. J R Soc Interf (2014) 11:20130992. doi:10.1098/rsif.2013.0992
14. Fang F, Ho KL, Ristroph L, Shelley MJ. A computational model of the flight dynamics and aerodynamics of a jellyfish-like flying machine. J Fluid Mech (2017) 819:621–55. doi:10.1017/jfm.2017.150
15. Zhang X, He G, Wang S, Zhang X. Locomotion of a bioinspired flyer powered by one pair of pitching foils. Phys Rev Fluids (2018) 3:013102. doi:10.1103/PhysRevFluids.3.013102
16. Zhang X, He G, Wang S, Zhang X. Passive hovering of a flexible Λ-flyer in a vertically oscillating airflow. J Fluid Mech (2019) 878:113–46. doi:10.1017/jfm.2019.633
17. Liu YY, Pan C, Liu Y. Propulsive performance and flow-field characteristics of a jellyfish-like ornithopter with asymmetric pitching motion. Phys Fluids (2020) 32:071904. doi:10.1063/5.0010938
18. Buchholz JHJ, Smits AJ. The wake structure and thrust performance of a rigid low-aspect-ratio pitching panel. J Fluid Mech (2008) 603:331–65. doi:10.1017/S0022112008000906
19. Buchholz JHJ, Smits AJ. On the evolution of the wake structure produced by a low-aspect-ratio pitching panel. J Fluid Mech (2006) 546:433–43. doi:10.1017/S0022112005006865
20. Green MA, Smits AJ. Effects of three-dimensionality on thrust production by a pitching panel. J Fluid Mech (2008) 615:211–20. doi:10.1017/S0022112008003583
21. Li GJ, Kemp G, Jaiman RK, Khoo BC. A high-fidelity numerical study on the propulsive performance of pitching flexible plates. Phys Fluids (2021) 33:051901. doi:10.1063/5.0049217
22. Sarkar S, Venkatraman K. Numerical simulation of thrust generating flow past a pitching airfoil. Comput Fluids (2006) 35:16–42. doi:10.1016/j.compfluid.2004.10.002
23. Meng XG, Sun M. Aerodynamics and vortical structures in hovering fruitflies. Phys Fluids (2015) 27:031901. doi:10.1063/1.4914042
24. Meng XG, Chen ZS, Zhang Y, Chen G. Aerodynamic performance and flow mechanism of multi-flapping wings with different spatial arrangements. Phys Fluids (2022) 34:021907. doi:10.1063/5.0080395
25. Rogers SE, Kwak D, Kiris C. Steady and unsteady solutions of the incompressible Navier–Stokes equations. AIAA J (1991) 29:603. doi:10.2514/3.10627
26. Rogers SE, Pulliam TH. Accuracy enhancements for overset grids using a defect correction approach. AIAA J (1994) 94:0523.
27. Hilgenstock A. A fast method for the elliptic generation of three-dimensional grids with full boundary control. Numer Grid Gen Comput Fluid Mech (1988) 88:137.
28. Meng XG. Ceiling effects on the aerodynamics of a flapping wing at hovering condition. Phys Fluids (2019) 31:051905. doi:10.1063/1.5094661
29. Li GJ, Lu XY. Force and power of flapping plates in a fluid. J Fluid Mech (2012) 712:598–613. doi:10.1017/jfm.2012.443
30. Van Buren T, Floryan D, Smits AJ. Scaling and performance of simultaneously heaving and pitching foils. AIAA J (2019) 57:3666–77. doi:10.2514/1.J056635
31. Zhang CY, Huang HB, Lu XY. Effect of trailing-edge shape on the self-propulsive performance of heaving flexible plates. J Fluid Mech (2020) 887:A7. doi:10.1017/jfm.2019.1076
32. Birch JM, Dickinson MH. The influence of wing-wake interactions on the production of aerodynamic forces in flapping flight. J Exp Biol (2003) 206:2257–72. doi:10.1242/jeb.00381
33. Lua KB, Lim TT, Yeo KS. Effect of wing-wake interaction on aerodynamic force generation on a 2D flapping wing. Exp Fluids (2011) 51:177–95. doi:10.1007/s00348-010-1032-8
34. Wu JH, Sun M. The influence of the wake of a flapping wing on the production of aerodynamic forces. Acta Mech Sin (2005) 21:411–8. doi:10.1007/s10409-005-0064-4
35. Floryan D, Van Buren T, Rowley CW, Smits AJ. Scaling the propulsive performance of heaving and pitching foils. J Fluid Mech (2017) 822:386–97. doi:10.1017/jfm.2017.302
36. Cheng X, Sun M. Very small insects use novel wing flapping and drag principle to generate the weight-supporting vertical force. J Fluid Mech (2018) 855:646–70. doi:10.1017/jfm.2018.668
37. Lyu YZ, Sun M. Power requirements for the hovering flight of insects with different sizes. J Insect Physiol (2021) 134:104293. doi:10.1016/j.jinsphys.2021.104293
38. Dewey PA, Quinn DB, Boschitsch BM, Smits AJ. Propulsive performance of unsteady tandem hydrofoils in a side-by-side configuration. Phys Fluids (2014) 26:041903. doi:10.1063/1.4871024
39. Peng JF, Alben S. Effects of shape and stroke parameters on the propulsion performance of an axisymmetric swimmer. Bioinspiration Biomimetics (2012) 7:016012. doi:10.1088/1748-3182/7/1/016012
Keywords: aerodynamics, jellyfish-like flyer, vortex structures, flapping wing, computational fluid dynamics
Citation: Meng X, Deng C, Wang D and Jiang S (2023) Numerical study on the aerodynamic performance of the three-dimensional wing of a jellyfish-like flyer. Front. Phys. 11:1125205. doi: 10.3389/fphy.2023.1125205
Received: 16 December 2022; Accepted: 06 February 2023;
Published: 22 February 2023.
Edited by:
Hui Tang, Hong Kong Polytechnic University, Hong Kong SAR, ChinaReviewed by:
Cetin Canpolat, Çukurova University, TürkiyeCopyright © 2023 Meng, Deng, Wang and Jiang. This is an open-access article distributed under the terms of the Creative Commons Attribution License (CC BY). The use, distribution or reproduction in other forums is permitted, provided the original author(s) and the copyright owner(s) are credited and that the original publication in this journal is cited, in accordance with accepted academic practice. No use, distribution or reproduction is permitted which does not comply with these terms.
*Correspondence: Xueguang Meng, bWVuZ3hnQHhqdHUuZWR1LmNu
Disclaimer: All claims expressed in this article are solely those of the authors and do not necessarily represent those of their affiliated organizations, or those of the publisher, the editors and the reviewers. Any product that may be evaluated in this article or claim that may be made by its manufacturer is not guaranteed or endorsed by the publisher.
Research integrity at Frontiers
Learn more about the work of our research integrity team to safeguard the quality of each article we publish.