
94% of researchers rate our articles as excellent or good
Learn more about the work of our research integrity team to safeguard the quality of each article we publish.
Find out more
ORIGINAL RESEARCH article
Front. Phys., 20 April 2023
Sec. Medical Physics and Imaging
Volume 11 - 2023 | https://doi.org/10.3389/fphy.2023.1125143
This article is part of the Research TopicEditor's Challenge in Medical Physics and Imaging: Quantitative Medical ImagingView all 11 articles
 Kunal Kumar1†
 Melanie Fachet1*†
 Marwah Al-Maatoq1
 Amit Chakraborty1
 Rahul S. Khismatrao1Shreyas V. Oka1Theresa Staufer2Florian Grüner2Thilo Michel3Heike Walles4
 Christoph Hoeschen1
Introduction: Accurate diagnosis and personalized treatments involving site-targeted cancer localization, drug delivery, therapeutic strategy, and disease pathways identification, rely on a precise understanding of biomarker kinetics, drug pharmacokinetics, and mechanistic behaviour of functionalized tracers through in vitro and in vivo studies. X-ray fluorescence (XRF) computed tomography (XFCT) offers a potential alternative to current 3D imaging techniques for spatiotemporal localization of nanoparticle-tracers with high spatial resolution and sensitivity. In this work, the applicability of a benchtop cone-beam system with a polychromatic X-ray source was examined with regard to physical constraints of engineered tissue models.
Methods: A tissue engineering approach based on a decellularized scaffold was used to establish a 3D breast cancer model with MDA-MB-231 cells in co-culture with primary human fibroblasts. The 3D breast cancer system, in combination with small-animal-sized phantoms, was used to demonstrate the novel integrated pre-clinical imaging approach to perform in vitro surrogate investigations and non-destructive analysis on biophantoms. These models are adopted to evaluate the functionality and optimize the setup for high-spatial-resolution, fast, and fully-3D quantitative imaging. Polychromatic X-rays from a microfocus source are used for XRF stimulation from conventional Gadolinium (Gd) and nanoparticle-based Molybdenum (MoNPs) contrast agents.
Results and Discussion: The intestinal scaffold allowed the invasion of the breast cancer cells over this barrier and therefore provides a valuable tool to study metastasis formation of tumor cells from epithelial origin. The breast cancer model was well suited for the development and validation of the proposed XRF imaging, with spatial resolution under <2 mm and contrast dose in the order of a few 100 μg/mL (∼0.3 mg/mL for Gd and ∼0.5 mg/mL for MoNPs), radiation dose in the order of a few 100 cGy (280 cGy for Gd and 94 cGy for MoNPs, with a possible reduction of an order of magnitude for Gd and 67% for MoNPs), and imaging time in the order of 10 min for Gd (33 min total) and 100 min (2.8 h total) for MoNPs, approaching in vivo conform conditions for pre-clinical studies. High-resolution XFCT for tissue-engineered cancer models would be of significant interest in biomedical research and diagnostic imaging, e.g., for an increased mechanistic understanding of molecular processes in tumor formation or early cancer detection.
Engineered tissue models are valuable test systems to study cell homeostasis as well as the development and progression of diseases. The development of microphysiological tissue models opens new possibilities for testing and development of diagnostic and therapeutic approaches at a pre-clinical or translational stage [1]. Composed of various cell types with different tissue origins, three-dimensional (3D) models closely recapitulate tissue architecture and are able to unravel mechanistic insights into tumor formation and metastasis [2]. In the field of cancer research, especially for drug efficacy screening and toxicity testing, many experiments are still performed in traditional two-dimensional (2D) cell cultures, xenografts or small animal models [3]. Although 2D models have the advantage of simple handling, they are unable to mimic the complexity of cell-cell or cell-matrix interactions and this can result in loss of crucial cellular signaling pathways and changes in cell responses to stimuli [4]. Moreover, 2D cultures do not provide satisfactory conservation of cellular properties such as cellular shape, polarization and heterogeneity [5]. In contrast, the collection of pre-clinical data from animal models is usually expensive, time consuming and associated with high regulatory hurdles impairing the fast translation of innovative treatments from bench to bedside [6]. Here, a critical impetus to meaningful pre-clinical theranostic (therapeutic and diagnostic) investigations is the validity of small-animal models to simulate human physiological behaviour, which otherwise manifests significant physiological and metabolic differences. Particularly, in cancer diseases, dissimilarities in animal-human tumor vascularization and drug pharmacology may undermine such investigations [7]. Tissue-engineered 3D models can overcome these limitations and bridge the gap between human relevance, reproducibility and physiological relevance [8]. Similar to in vivo conditions, tissue models can reproduce mechanical and biochemical properties that are crucial for cancer development and progression, such as morphology, cellular migration, tissue stiffness and integration of multiple cell types simultaneously [9]. While current standardized approaches in personalized cancer therapy allow cancer classification and prognosis prediction via human-relevant pharmacokinetic and pharmacodynamic models, they rely on data from large cohort studies with low specificity on comorbidities [7, 10]. Herein, prediction of individual response is difficult as the data requirement is large and generalized rather than targeted while ignoring individual comorbidities. Therefore, surrogate investigations on replicable patient-derived organoids or tissue cultures may allow systematic evaluations with reproducible results. Recent results indicate a close relationship between the response of 3D in vitro cancer models and the patient response to therapy [2]. As such, in vitro human-based cell models have the potential to predict patient response to therapy, thereby a valuable tool to study personalised drug response [11]. Moreover, with the development of functional in vitro models, complex cell systems such as bioartificial organs with vascular structures and in vivo-like organ functionality can be constructed for such investigations.
While non-invasive bio-imaging modalities using near-infrared (NIR) optical photons, like optical fluorescence imaging with, e.g., quantum dots (QDs) and conjugated NP-fluorophores, have been successful in non-ionizing molecular imaging with high spatiotemporal resolution in the sub-millimeter/sub-second (μm-mm/ms-hr) range, they are limited to only superficial depths, therefore, limiting imaging of deep organs and complex bioartificial systems [12, 13]. While in photoacoustic and ultrasound imaging, the spatial resolution is depth dependent due to frequency-dependent acoustic attenuation and decreases significantly at deeper penetration depths, the mechanical coupling of ultrasound receivers in the case of engineered tissue systems and bioreactor systems may be challenging [14–16]. Alternatively, as a non-invasive (neglecting ionizing radiation damage) technique, X-ray fluorescence computed tomography (XFCT) can allow molecular imaging and quantitative analysis of 3D elemental composition inside deep samples and organs. XFCT combines principles of absorption-based CT imaging with emission tomography in the form of X-ray fluorescence (XRF) detection from elements within the sample [17]. XRF emissions from high atomic number target elements, i.e., contrast agents posed as markers, are typically instigated by the excitation of inner shell electrons from monochromatic X-rays, such as in X-ray fluorescence imaging (XFI) with polarised synchrotron-based sources [18–22]. The resulting XRF photons along with scattered photons are detected and analyzed in order to spectrally identify, spatially localize, and quantify the elemental composition with respect to their photon energies. Owing to the spectroscopic nature of XFCT, the computed tomography extension of XFI, has unique capabilities compared to attenuation or contrast-based imaging modalities (e.g., X-ray CT and its variants), such as inherent specificity due to the characteristic element-specific energy lines of XRF photons, leading to high detection sensitivity of very small marker concentrations [23–26]. Besides, the spatial resolution offered by XFI is adjoining that of morphological imaging modalities (CT, MRI, etc.) and substantially higher than that of present functional imaging modalities like PET and SPECT [18, 19, 21].
With the XFCT technique, besides 3D elemental mass localization inside imaging objects, X-ray attenuation maps can also be simultaneously obtained within the same imaging setup. As characteristic XRF photons stimulated from atoms have much higher energies and a higher penetration depth than visible light photons, XRF imaging has fundamentally distinct advantages of high sensitivity in deeper tissues or organs [27]. Here, the XRF penetrability depends on the atomic number (symbol Z) of the target element, with higher Z (or high-Z) leading to higher energy with a squared proportionality on Z [28] and, therefore, a greater transmission probability through large objects from energetic K-shell/L-shell photons [17].
In XFI and pencil beam XFCT, the spatial resolution is primarily determined by the pencil beam diameter, specifically for XFI in the axial and transverse directions, and majorly by the focal depth-dependent detection solid angle in the longitudinal direction [19, 20, 26]. However, in cone-beam XFCT, a full-body fast scanning is possible, allowing full-3D reconstruction of tracer distribution while preserving dynamic tracking, i.e., a higher full-body scanning temporal resolution is offered at the cost of high spatial resolution as delivered by XFI or pencil beam XFCT. The spatial resolution of cone-beam XFCT is primarily limited by scattering noise and instrumentation challenges. Specifically, loss of spatial resolution may occur from the optical components or collimation optics due to geometrical unsharpness in pinhole/parallel-hole collimators from the detection solid angle, septal penetration in the collimator, and collimator scattering. With the use of pixelated hybrid photon counting detectors (HPCD), these losses can also be attributed to correlation effects such as the charge-sharing effect, intrinsic detector scattering, sensor-intrinsic fluorescence, and fluorescence escape. In contrast, PET imaging, which is considered the gold standard for molecular assessment of tissues in cancer clinics, is constrained by fundamental spatial resolution limits arising from positron range and photon non-collinearity. From either imaging technique, a perpetual tradeoff between the scannable field-of-view (FOV) and achievable spatial resolution exists. Moreover, present 3D techniques in PET and SPECT still suffer from inevitable tradeoffs between managing cell viability and feasibility of longitudinal scanning (i.e., repeated imageability over multiple time-points allowing progression studies). This is due to the intrinsic half-life of radionuclides and radioactivity accumulation, specifically for slow biological processes, where the radiation dose is also delivered when imaging is not being performed [19]. Furthermore, it is challenging to confine the radiation dose of the radiotracer to specific target locations in PET and SPECT, as the radiotracer can spread to different regions of the target tissue and organs. In contrast, this is avoided in XFCT due to no intrinsic loss of XRF signals through the use of externally controlled excitations and known scanning regions [19]. These advantages render XFCT a highly promising candidate for a future modality in clinical molecular imaging of high-Z probes such as metallic nanoparticles (NPs) with active or passive tumor targeting [25, 29].
Paralleling synchrotron-based approaches, in benchtop XFCT settings, state-of-the-art lies in spectrally-matched quasi monoenergetic focused pencil-beam (Montel-type X-ray focusing mirror) excitation from liquid metal x-ray tubes that offer high flux, narrowband excitation, and high spatial resolution, but are limited to low atomic number nanoparticles [25, 26]. The high brilliance of, e.g., Indium-based liquid metal source requires NP tracers with K-edges close to the Indium K-alpha emission line at 24–24.2 keV, leaving only a small range of excitable elements with sufficiently high atomic numbers to allow NP multiplexing and minimize losses from XRF signal absorption [18, 25, 26]. Though, as shown in previous studies, the spatial resolution in cone-beam XFCT is currently limited to the millimeter range (
Considering in vivo constraints for pre-clinical investigations, achieving high spatial resolution with currently available benchtop x-ray technology poses a challenging task. The in vivo constraints, e.g., for cell tracking and drug delivery studies in live animals (e.g., mice) are expected to have total NP mass in the order of micrograms and sub-millimeter spatial resolution, imaging scan-times within the effective anaesthetized periods, i.e., typically under 60 min, and radiation dose under 30 cGy (lethal dose LD50/30 in the range 500–760cGy) corresponding to that of micro-CT imaging [18, 19, 33–35]. In dose-enhanced radiation therapy, the NP contrast doses in the mg/g levels, e.g., with gold nanoparticles (AuNPs), have been found to have a year of survival in mice [25, 36]. For conventional Gadolinium (brand name Dotarem, Gd-DOTA) contrast agents, the intravenous lethal dose for 50% (i.v.-LD50) of mice is typically seen to be 10–15 mmol/kg, while the clinically recommended dose is 0.1 mmol/kg [37, 38]. With MoNPs, dose limits of up to 21 mmol/kg/day for 14 days have been considered in certain studies, concluding LD50 ≥ 83.4 mmol/kg with no sign of toxicity or mortality [39, 40]. In our study, for imaging the breast cancer models using XFCT, these values are taken as the upper and lower-bound reference values, and the feasibility of high-spatial-resolution imaging is examined.
The recent advances and unique properties of NPs have resulted in a rapid increase in their applications in biomedical and pharmaceutical applications [39]. In XFCT imaging NPs serve as functional or molecular contrast agents, which can be combined with functionalizations for targeted drug delivery and therapy. Compared to conventional contrast agents, NPs offer several advantages such as loadability, tunability and multifunctionality in different medical imaging modalities [41]. A systemic administration of NPs via intravenous injection and the subsequent drug delivery to the site of action is achieved through passive and active targeting [42]. In passive drug targeting strategies, the pathophysiological vascular permeability of tumor blood vessels and the enhanced retention in tumor tissue was successfully exploited for NP delivery, while active targeting uses conjugated ligands on the NP surface to improve the drug selectivity for tumor cell-specific biomarkers or receptors [25].
Here, we present a novel integrated pre-clinical approach to perform in vitro surrogate investigations and non-destructive analysis on bio fabrications, like engineered 3D tissues, for interventional cancer radiology, assisted through in situ, easily accessible benchtop XFCT imaging. In the current work, a tissue-engineered 3D microphysiological breast cancer model is examined in the context of feasibility evaluation and development of a quantitative 3D cone-beam XFCT setup. Compared to conventional 2D cell cultures, the proposed microphysiological cancer model overcomes the lack of histological complexity and functionality to reflect the complex biological behavior in a more accurate way. The quantitative tomographic XRF imaging of NPs in the microphysiological breast cancer model is demonstrated with spatial resolution at scan-times, contrast dose, and radiation dose approaching conform conditions for in vivo and in vitro experiments. The method is performed via passive targeting with metallic contrast agents, namely, a conventional Gd-containing (Z = 64) solution based on Gadoteric acid and MoNPs (Z = 42).
The static 3D tissue culture was performed according to established and standardized protocols on the Small intestine submucosa + mucosa (SISmuc) scaffold derived from a porcine jejunum [43, 44]. The SISmuc scaffold was fixed in a cell crown between two supporting rings. Subsequently, 1 ⋅ 105 MDA-MB-231 cells and 7.5 ⋅ 104 primary fibroblast cells were seeded on the luminal side of the scaffold. The cell crowns were placed in 12-well plates and covered with approx. 2.5 mL cell culture medium containing 10% FCS (RPMI-1640 for MDA-MB-231 cells and DMEM for primary fibroblasts). The cells were maintained in 5% CO2 under high humidity at 37 °C and a medium exchange was performed every 2–3 days. After 14 days of culture, the monolayer tissue was assembled to a multilayer structure with the following order: Fibroblast layer, MDA-MB-231 layer followed by a layer of SISmuc scaffold without cells.
Afterwards, the multilayer breast cancer model was treated with Gd-containing contrast agent (Gadoteric acid, brand name Dotarem®, 0.5 mmol/mL) and MoNPs. MoNPs with a particle size less than 100 nm (measured by TEM) and 99.8% purity (trace metal analysis) were purchased from Sigma-Aldrich (St. Louis, United States) in the form of black powder and suspended in deionized distilled water to prepare the required concentrations.
Scaffolds were fixed in embedding medium Tissue-Tek and stored at −80°C. Prior to staining, the multilayer tissue was cut in cross-sections of 10μm thickness using a microtome (CM3050 S, Leica Microsystems). Immunohistochemistry staining was performed with primary antibodies against Ki67 (Rabbit, 1015, Merck Millipore), Vimentin (Rabbit, EPR3776, Merck Millipore) and Pro-Collagen (Mouse, 3468667, Merck Millipore) with a 2-step HRP polymer detection system (Super Vision 2 HRP Polymer-Kit, DCS Innovative Diagnostik-Systeme, Germany). The primary antibodies for Ki67 and Vimentin were diluted 1:100 and for Pro-Collagen 1:1000 in 0.5% BSA in PBS and incubated at room temperature for 1 h. Nuclei were counterstained by Haematoxylin. Images were acquired using a digital microscope (Evos XL Core, Thermo Fisher Scientific).
Immunohistochemistry stainings for Ki67 were performed as described above. Three images per sample with a magnification of ×10 were counted for the ratio of Ki67-positive signal (brown color) compared to a Haematoxylin-positive signal (blue color) within the respective tissue layers: I) primary fibroblast layer and II) MDA-MB-231 breast cancer cell layer.
Three-dimensional linear attenuation maps were obtained using the transmission cone-beam CT (CBCT) technique to account for and correct internal attenuation of incident excitation photons and emitted XRF photons within the sample. Figures 3A,B shows the benchtop XFCT imaging system with the incorporated CBCT arrangement. A series of 6 flat panel array X-ray detectors (RadEye TM1, Teledyne Rad-Icon Imaging), each featuring a fully integrated CMOS silicon photodiode array with a scintillator having 24.6 mm × 49.2 mm active area, 48 μm pixel size, and 512 × 1024 matrix, were butted together to integrate a large-area detection into the XFCT setup. A tungsten-target microfocus X-ray tube (Oxford Nova 600) with 90 kV nominal tube voltage, 2.0 mA maximum beam current, 80 W nominal radiographic anode input power, 254 μm Beryllium window (Be, Z = 4), and 14–20 μm diameter focal spot size (at maximum voltage and minimum power) was used as an excitation source for both the CBCT and XFCT imaging modes. The micro-sized focal spots are critical for spatial resolution enhancement and radiation flux concentration, e.g., via coupling with X-ray poly-capillary optics or Bragg-reflection-based bent focusing crystals [31, 32]. Bragg-reflection-based bent mosaic crystals, offering better reflection efficiencies, form a crucial aspect of our future work for focusing and monochromatizing. In the present investigation, we implemented a multi-leaf collimator system on the microfocus x-ray tube to generate cone-beam X-rays without supplementary focusing optics. The custom-made multi-leaf lead (Pb, Z = 82) beam collimation system was mounted and aligned at the tube exit window to allow excitation-beam shaping and minimize inherent leakage radiation. The X-ray tube with the collimation system was mounted on a high-accuracy multi-axis robot arm (KR 60 HA, KUKA) to allow positioning and alignment under different imaging modes. For the tomographic scanning geometry, a rotation stage (URS50CPP, Newport ™) was mounted on a vertical-axis alignment (M-443, Newport ™) platform, needed for the axial positioning within the cone-beam profile and rotational sampling (X-ray projections) of the tissue model phantoms and small-animal-sized calibration phantoms.
Scan parameters for the Gd imaging configuration were set to 90 kV peak tube voltage, operated at 0.9 mA tube current with 0.3 mm Copper (Cu, Z = 29) filtration, with 40.5 cm source-to-isocenter and 55.7 cm source-to-detector distance, allowing a full-field scan. A total of 30 projections were acquired at 12° angular sampling interval and approx. 6 s exposure time per projection.
For MoNP contrast agents, the image acquisition parameters were set to 45 kV peak tube voltage, operated at 1.8 mA tube current with 6 mm Aluminium (Al, Z = 13) filtration, with 16.8 cm source-to-isocenter and 31.5 cm source-to-detector distance. The set tube voltage was higher than the XFCT configuration to allow better contrast in transmission images and lower the overall CBCT scan-time. Here, a total of 60 projections (6° interval) were acquired at approx. 10 s exposure time per projection.
The XFCT imaging geometry consisted of a cone-beam sampling scheme using the same mechanical stage/platform arrangement for tomography with the collimated microfocus X-ray tube, as mentioned in Section 2.4. For XRF detection, energy-resolving X-ray detectors were used for discriminating primary XRF/scattered counts in the XRF signal bins from accompanying secondary (Rayleigh and Compton) events in the neighboring bins since there exists a proportionality between the absorbed energy in the sensor and electron-hole pairs produced upon intrinsic interactions within the atoms of the semiconductor material leading to differentiability between detected signals depending on the sensor energy resolution. In the current XFCT setup, Timepix3 HPCD (55 μm × 55 μm pixels size, ∼14 mm × 14 mm active detection area, 1 mm CdTe sensor thickness, ∼4–6 keV FWHM energy resolution around Gd XRF energies, Minipix TPX3, Advacam) was irradiated behind circular aperture single-pinhole arrangements. The XRF detector was operated in various modes: Time-of-Arrival (ToA) and Time-over-Threshold (ToT) continuous pixel-event readout mode, giving photon interaction position (pixel coordinates), arrival time, and deposited energy.
For Gd contrast agents, the pinhole collimator was made out of Lead (Pb), having an opening diameter of 0.4 ± 0.05 mm and a thickness of 1.5 ± 0.05 mm. The X-ray tube was operated under the same excitation-beam settings as in CBCT, i.e., at 90 kV tube voltage, 0.9 mA beam current, and 0.3 mm Cu filtering. However, to allow full-field scanning in geometrically/mechanically constrained large CT detector arrangement in the setup, the source-to-isocenter distances were set differently, i.e., for 30 mm internal region-of-interest (ROI) FOV and 20 mm longitudinal FOV, 14 cm source-to-isocenter, 5.5 cm isocenter-to-pinhole, and 1.5 cm pinhole-to-detector distance was used. To minimize the object and geometry-dependent elastic and Compton scattered background, and to improve the signal-to-background ratio, the geometry of the fluorescence detectors and acquisition/post-processing parameters were optimized. Specifically, detector angle optimization for total-scatter minimization (primarily Compton-scattered photons) was carried out for the chosen polychromatic excitation-beam properties (see Figure 1) using Monte Carlo (MC) simulations on the GEANT4 toolkit, and task-specific optimal bin widths were determined under Poisson point process assumptions for sum spectrum binning of the X-ray projection data [21, 45, 46]. The detector was positioned at 42 ± 3° polar angle with respect to the primary photon ray (central projection axis in the imaging mid-plane) in order to minimize the background interference in signal bins. A compressed sensing-based sparse-view image acquisition strategy was adopted to minimize radiation dose with 10 angular projections (in 360° scan) at an exposure time of 150 s per projection [47].
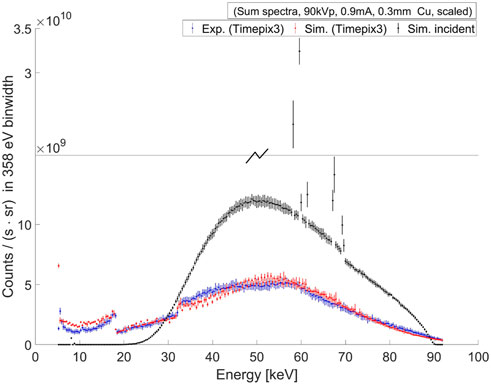
FIGURE 1. A comparison between the experimental and simulated sum-spectra of the excitation beam for the Gd case (with 90 kV tube voltage, 0.9 mA tube current, 0.3 mm copper filter) is shown here. The experimental measurements (blue) were taken using the Timepix3 detector, and simulations (red) were performed using MC (Geant4) particle transport with the Timepix3 sensor charge-transport and digitization model of the read-out electronics. The simulated incident sum-spectrum is obtained at the entrance surface of the detector (black) through surface flux scoring of the incident gamma tracks. Both the measured and simulated spectra are scaled by radiometric correction factors, as neither a physical measurement of direct high-flux is possible by Timepix3 detectors, nor a simulation of a large number of particles with Geant4 is computationally tractable.
For MoNP imaging, the pinhole collimator consisted of an opening diameter of 0.4 ± 0.03 mm in 1.2 ± 0.05 mm thick Iron (Fe, Z = 26). Here, Fe was chosen in order to minimize interference from Pb L-shell XRF on the lower end of the Mo K-shell XRF bins. The X-ray tube was operated at 30 kV to minimize intrinsic CdTe XRF interference in Mo K-Shell XRF bins, with 2 mA beam current and 6 mm Al filtration. An approximately 30 mm internal ROI-FOV was realized with 9 cm source-to-isocenter, 4.5 cm isocenter-to-pinhole, and 1 cm pinhole-to-detector distance. For the chosen beam properties (see Figure 2), the detector was positioned at an optimum polar angle of 114 ± 3°. A total of 30 angular projections (in 360° scan) were obtained at an exposure time of 300 s per projection.
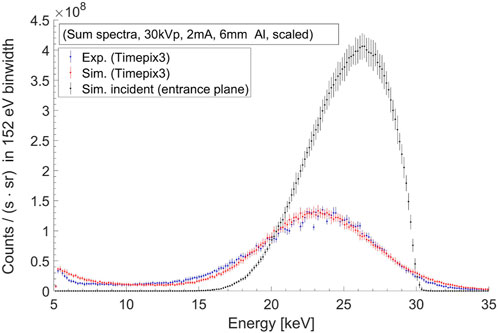
FIGURE 2. Excitation beam sum-spectra in the MoNP case (with 30 kV tube voltage, 2 mA tube current, 6 mm aluminium filter) from experimental measurements using Timepix3 detector (blue), detector simulations (red), and the simulated incident sum-spectrum (black).
Calibration standards in varying concentrations with Gd, based on Gadoteric acid (C16H25GdN4O8), and MoNPs were used as contrast agents on a custom-made water-equivalent phantom for system characterization and multi-layer in vitro 3D tissue models for simulated in vivo investigations.
For XFCT calibration experiments, approx. 0.75 mL volume of 0–3.1 mg/mL Gd dilutions (see Figure 3C) made from 0.5 mmol/mL (∼78.5 mg/mL) stock solution were filled in polypropylene microcentrifuge tubes (1.5 mL maximum volume, 10 mm diameter, 9° taper angle) and embedded in water-filled 50 mm maximal diameter, ∼ 60 mm high hexagonal borosilicate glass containers behaving as small animal surrogates (see Figure 3C, right). Calibration experiments with MoNPs involved approx. 1.8 mL volume of 0–10 mg/mL MoNP dilutions (see Figure 3D) filled in cryogenic vials (2 mL maximum volume, 12.5 mm diameter) embedded in water-filled phantoms (see Figure 3D, right). The assembled samples of the multilayer breast cancer model (as described in Section 2.1) were each immersed in approx. 12 mL cell culture medium held inside separate borosilicate containers (see Figure 3E) after treatment with 0.16, 0.78, 1.57, and 3.15 mg/mL Gd and 0.01, 0.05, 0.1, and 0.2 mg/mL MoNP. Blank cell crown phantoms (see Figure 3F) were used for task-based optimization of the XFCT system [48].
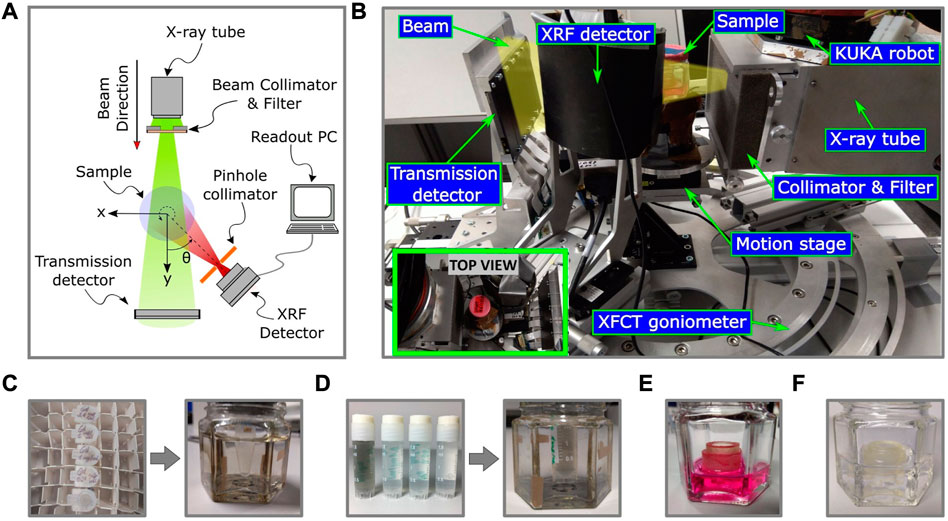
FIGURE 3. The schematic diagram (A) and the experimental setup (B) of the benchtop XFCT system is shown here, including the imaging phantoms (C), (D) (E), and (F). Image (B) showcases the imaging geometry and the various components involved, including a microfocus X-ray tube with a collimator and beam filtering system, a motion and mounting platform, a transmission detector, and a shielded XRF detector with single pinhole collimation. The inset image in (B) shows the top view of the setup. The Gd (C) and MoNP (D) calibration samples are embedded in water and held inside borosilicate glass containers. The Gd calibration samples (C) have concentrations ranging from 0–3.1 mg/mL, and the MoNP calibration samples are shown in (D) (only 0, 0.1, 0.25, and 0.5 mg/mL are shown here). The 3D breast cancer tissue model is immersed in cell growth medium (E) and blank cell crown samples are held in water for XRF background analysis (F).
The ToA and ToT event-information from XFCT projections were used to carry out energy calibration and event clustering (Pixet Pro, Advacam) to reconstruct events degraded by the charge-sharing effect, intrinsic CdTe XRF, and intrinsic Compton scattered events. Contrary to the detection based on large-area single-pixel or multi-pixel detectors, individual small pixels (55 μm) of the Timepix3 sensor led to insufficient detected counts for the in vivo scan-time and dose constraints. Therefore, single-pixel spectra were binned together to form sum spectra, and a spatial-filtering-based optimization problem (similar to [21, 49]) was modelled and solved for cone-beam polychromatic X-rays to obtain the subset of pixels that maximizes the signal-to-background ratio (limit set at SNR
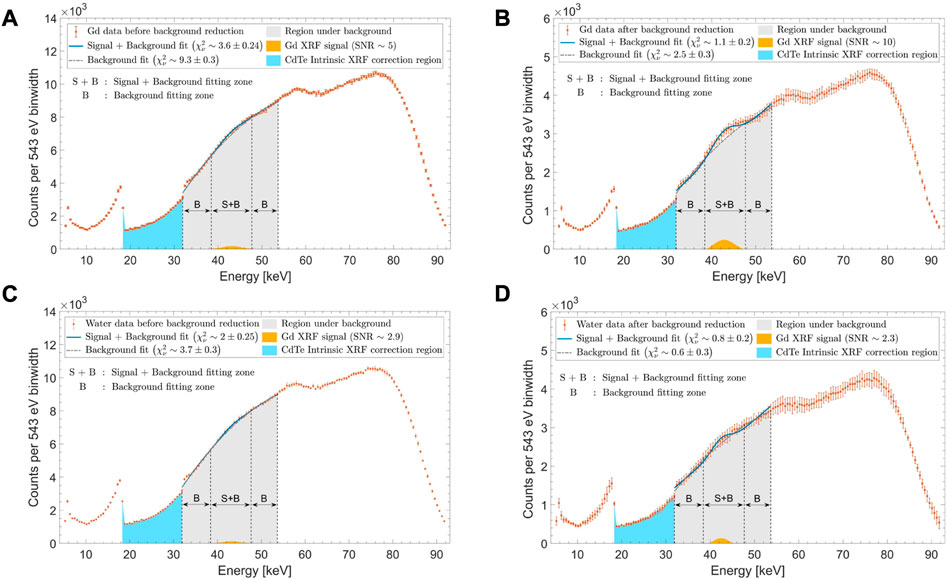
FIGURE 4. Typical XRF sum spectra (A,C) prior to and (B,D) post signal optimizations are shown here for (A,B) 1 mg/mL Gd concentration and (C,D) water background (0 mg/mL Gd concentration). An overall fitting region (gray shaded area) is in the energy range of 32–53.5 keV. The background fitting zone “B” is defined in the energy range of 32–38.5 keV and 47.5–53.5 keV, while the signal plus background fitting zone “S + B” is within 38.5–47.5 keV. The extracted Gd XRF signal (shown in yellow) is seen to have (A) SNR∼5 before optimization and (B) SNR∼10 post-optimization through background reduction and signal maximization. For water, (C) pre-optimization and (D) post-optimization SNRs were ∼2.9 and ∼2.3, respectively.
Through the iterative process, signal and background batch fittings were performed for a large number of pixels. The signal region was defined as bins with K-shell XRF energies, i.e., at 42–43 keV and 17–17.5 keV peaks for Gd and MoNPs, respectively, with a spread of 3σdet, (here, σdet is the sigma or the width parameter of the Gaussian fit function representing the detector energy resolution post charge-sharing reconstruction;
It is important to note that while the spatial filtering technique delivers a solution to the intrinsic background problem in XFI for large-sized (human-sized) objects by exploiting the spatial anisotropy of single Compton scattering, its applicability to small-animal cases is less warranted [21, 49]. Primarily because, with narrowband and high excitation energies in XFI, which lie far away (taking into account the reduction of fluorescence cross-section) from the XRF signal energy range, the intrinsic background problem becomes quasi-background-free. In this case, the background noise from Compton scattering is less pronounced, as there are not enough multiple energetic scatterings in the small-animal-sized geometry to lose sufficient energy and reach the XRF energy bins. For medium-Z (medium atomic number) contrast agents with adequately high excitation energy and narrow energy bandwidth, the signal background may, at most, consist of higher Compton orders, which leads to a nearly isotropic background spatial distribution. Therefore, spatial noise filtering is unsuitable if higher-order Compton scattering is likely, or if the signal region is already quasi-background-free. Optimization, in this case, may even deteriorate the signal sensitivity. However, this can be exploited in our case, as the excitation energies are close enough to the XRF signal region (see Figures 1, 2), and first-order Compton still poses an anisotropic distribution on the detector surface.
In Figures 5A, B, the spatial distribution of total Compton (i.e., all Compton orders) scattered photons within the Gd K-shell XRF energy range are compared between a cylindrical (having a height of 60 mm and 50 mm diameter) and a spherical (50 mm diameter) water phantom. Here, the calculations over the polar (θ) and azimuthal (ϕ) angles are performed relative to the primary beam direction. In this case, a 4π uncollimated detector was used and the difference in the total Compton scattered photon between the maximum value over the polar angle θ and the detector’s optical axis (depicted by a brown dashed line) is slightly less than a factor of two. For the first-order Compton photons (denoted as C1) in Figures 5C, D, this difference is of a factor of two. However, in our simulations with the 4π uncollimated detector, we observed that this difference is more sensitive to the spectral bandwidth of the excitation beam than to the requirement of spatial coherence, i.e., having a pencil-beam-like configuration (see Supplementary Figure S1). With a microfocus source, where narrow bandwidth energies are used via spectral beam-shaping filters, a pencil beam configuration may already surpass the scan-time constraints of 30–60 min. Although the utility of pencil beams, also in the polychromatic case, has been well demonstrated for the human-size scale (as noted in [21]), our study acknowledges the limited margin of improvements in small-animal sizes for the optimization problem at hand. Nonetheless, the improvement factor scales with larger-sized objects, e.g., bioreactor systems and bio fabrications, which we intend to use in our future studies.
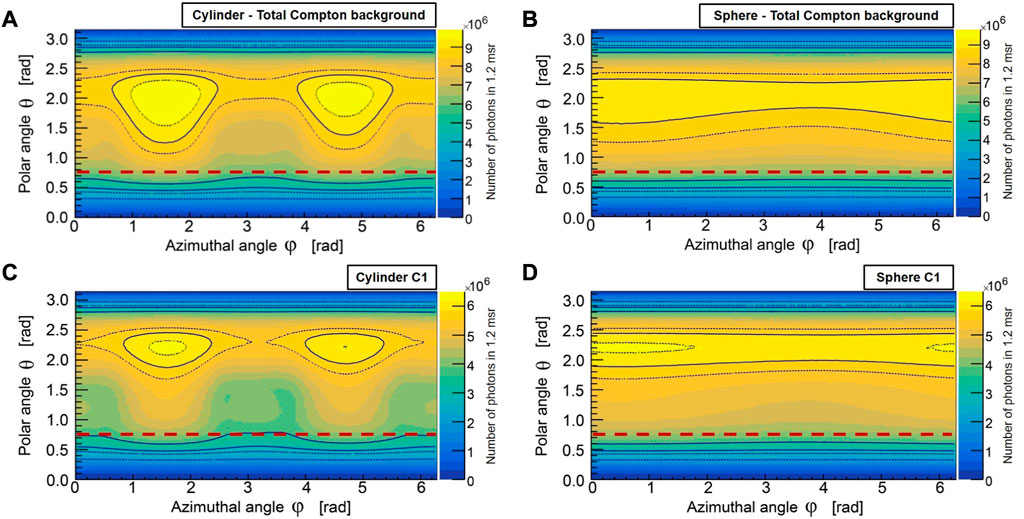
FIGURE 5. The spatial distribution of total Compton (A, B), and single-Compton (C, D) scattered photons in the Gd K-shell energy range for cylindrical and spherical water phantoms are shown here for a 4π uncollimated spherical detector (MC). The brown dashed line represents the polar angle of the detector’s optical axis (z-axis of the sensor) with respect to the primary beam direction. The total Compton scattering at the detector’s optical axis differs slightly less than a factor of two from the maximum value over the polar angle θ, while the single-Compton scattering differs by a factor of two. The asymmetry observed in ϕ, in the cylindrical water phantom (A, C), arises from the excess path length that photons must traverse through the volume along the height of the cylinder compared to its radial direction, resulting in an increased likelihood of higher-order Compton scattering and photoelectric absorption. This effect is also partly due to the collimated incident beam cross-section (30 mm × 20 mm FOV). The spherical water phantom (B, D) exhibits weaker asymmetry in ϕ due to its radially symmetric volume geometry.
For the pinhole collimation case, spatial anisotropy of photons within the Gd XRF energy window can be seen by comparing the detected (MC) Compton spatial distributions from Figure 6A, which shows the C1 photons, and Figure 6B, which shows the second-order Compton (denoted as C2) photons. The higher-order Compton scattered photons (only C2 shown in Figure 6B), which reduce spatial anisotropy, are minimized through an intrinsic reduction in small volumes and via pinhole collimation. From Figures 6D, E, almost an order of magnitude reduction of C2 photons can be seen compared to C1 photons. In Figures 6D, E, the nonuniformity in the geometric response of the detector is corrected using a pixel-wise analytical model to account for the solid angle effects on the Compton background (see Supplementary Appendix A). The peak normalized solid angle of detection,
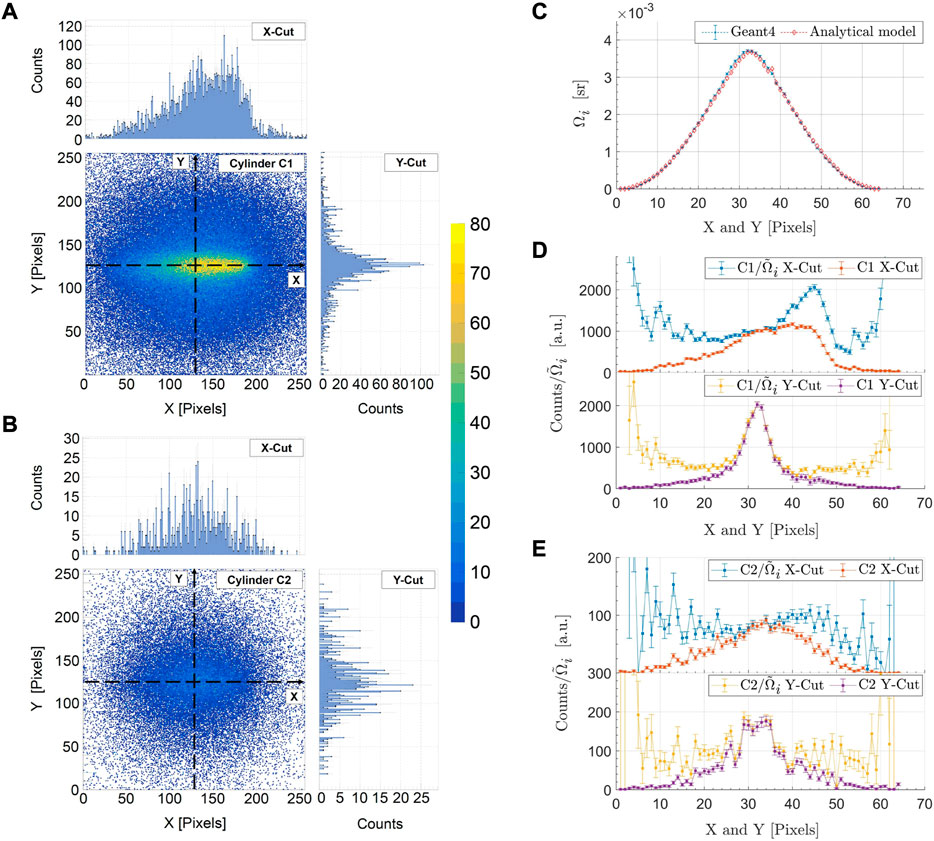
FIGURE 6. The detected (MC) spatial distribution of singly (C1) (A) and doubly (C2) (B) scattered Compton photons in the Gd K-shell energy range for the single-pinhole collimated detector is shown here. The spatial anisotropy of C1 photons (A) about the detector’s optical axis can be seen in comparison to the C2 photons (B). The detection solid angle, Ωi, is compared between MC simulations and an analytical model in (C). The C1 (D) and C2 (E) photon profiles are shown along the horizontal (X-Cut) and vertical (Y-Cut) directions of the detector. The numerical calculations of the analytical model are performed over a 64 × 64-pixel grid in order to minimize computational efforts, resulting in a rebinning of the data in (C, D, E) by combining 4 × 4 pixels.
Due to the highly undersampled scanning methodology and inherently count-limited nature of XRF imaging, iterative statistical image reconstruction methods were chosen for XFCT. A variation of the maximum likelihood expectation maximization technique (MLEM) with prior, i.e., the MAP (Maximum A Posteriori) technique, in the form of Green’s one-step late total variation (TV-EM) algorithm is given by Eq 1 [50, 51],
where, ψj is the relative concentration of the contrast agent, aij is the contribution from voxel j to projection at i, pi is the XRF projection at i, β is the regularization parameter controlling the effect of total variation (TV) prior, and TV (ψ(k)) is the TV norm of the current image estimate ψ(k). For the sparse-view XRF imaging of thin 3D tissue samples, anisotropic TV prior is chosen to slightly weaken the solutions that promote oblique structures (edges). For internal attenuation correction of the excitation and XRF photons, measured attenuation maps from CBCT scans at effective CT energies and calibrated XRF energies (obtained from simple bilinear scaling methods [52, 53]) were used to find the attenuation coefficients required in the element-by-element product (Hadamard product in matrix form) of the depth-dependent point response (modelled analytically) with the task-specific (object dependent) attenuation factors (calculated using radiological path lengths from Siddon’s algorithm [54]), thus, forming the forward projection/system matrices with elements aij. Here, an additional self-correction applies in the reconstruction step via the back-projection process that reduces the chances of false signal detection, whereby if particular background bins are selected posing as XRF signals, which would differ in each projection, the back-projection of the sparse solutions from NNLS will weaken the false signal intensity.
The CBCT projections in MoNP scan settings were reconstructed using FDK cone-beam filtered back-projection algorithm [55]. For CBCT scans with Gd contrasts, an isotropic TV-EM algorithm was used. As reconstruction algorithms are different, comparative quantitative imaging would be more challenging, requiring their effects to be studied more carefully. Here, we are only looking at the general feasibility of the approach.
The microphysiological breast cancer model used in this study is based on a biological matrix derived from decellularized porcine jejunum that contains an intact basal membrane and therefore permits rapid engraftment of epithelial cancer cells [44]. Two widely established cell types, the breast cancer cell line MDA-MB 231 and primary fibroblast were seeded onto the matrix. Upon static 3D culture, the breast cancer model could be routinely established and displayed a consistent phenotype with characteristic architecture shown in Figure 7. The upper layer of the breast cancer model consisting of primary human fibroblasts formed a dense cell layer, whereas the breast cancer cell line MDA-MB231 invaded from the second layer into the third layer of SISmuc scaffold indicating the invasive potential of this cell line (see Figure 7). Neither the treatment with different concentrations of MoNPs nor the treatment with Gd-containing contrast agents had an effect on the tissue morphology investigated by HE staining (see Figure 7A).
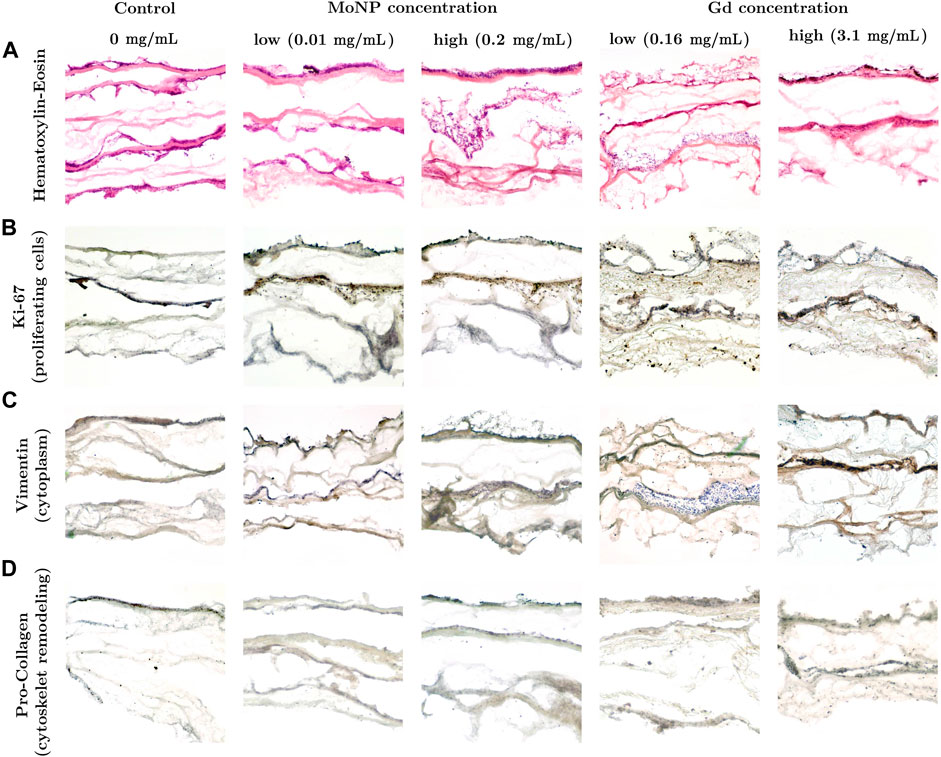
FIGURE 7. (A) HE staining and (B) immunohistochemical staining against Ki-67, (C) Vimentin and (D) Pro-Collagen in the 3D breast cancer model composed of three layers: primary human fibroblasts, MDA-MB-231 and scaffold after 48 h incubation.
An immunohistochemistry staining was performed to further investigate the functional and molecular properties of the cancer tissue model. Staining with Ki-67 showed that the highest proportion of proliferative cells (brown color) were found in the second tissue layer that was seeded with MDA-MB 231 cells (see Figure 7B). The MDA-MB 231 cells that invaded the third layer with SISmuc scaffold appeared mainly in a blue nuclei color from the Haematoxylin counter staining pointing towards a higher proportion of non-vital cells. The upper tissue layer covered by a dense layer of primary fibroblasts showed an almost equal proportion between vital and non-vital cells. Due to the non-invasive nature of these cells and the dense cell population, there might be a limited gas and nutrient exchange leading to a higher fraction of non-vital cells compared to the breast cancer tissue layer. The staining with Vimentin served as a marker for intermediate filaments comprising the cytoskeleton. As shown in Figure 7C, for control and low MoNP concentrations, Vimentin is present in both, primary human fibroblasts and MDA-MB 231 cells. Pro-Collagen is a precursor for collagen synthesis, a structural protein in the extracellular matrix found in various connective tissues. In this study, it serves as a marker for potential cytoskeleton remodeling induced by the treatment with contrast agents. Compared to the control condition (see Figure 7D, control), the treatment with MoNPs led to a significant increase in the Pro-Collagen signal (see Figure 7D, at MoNP and Gd treatments), indicating that the treatment with MoNPs and Gd-containing contrast agents already in low concentrations induced cellular processes related to the remodeling of the cytoskeleton.
The influence of the investigated contrast agents in various concentrations on the cell vitality was investigated with immunohistochemistry staining and subsequent counting of Ki-67 positive nuclei (brown signal corresponding to vital cells) compared to Haematoxylin-positive nuclei (blue color corresponding to dead cells) (see Figures 8A, B). We could not detect any concentration-dependent changes in the vital cell ratio in the two tissue layers for all tested Gd- and MoNP doses. In addition, we found a comparable vitality ratio in the apical fibroblast tissue layer compared to the basal breast cancer cell layer which indicates that there is no impact on the inner tissue layer due to a potential sub-optimal gas or nutrient supply. Furthermore, we performed a 3-(4,5-dimethylthiazol-2-yl)-2,5-diphenyl tetrazolium bromide (MTT) assay under 2D and 3D conditions to assess the cell vitality after treatment with the investigated contrast agents (see Supplementary Appendix C). Under all investigated conditions, the breast cancer cell line MDA-MB-231 had significantly higher absorption signals compared to the primary human fibroblasts in the MTT assay. The treatment of both cell types under 2D and 3D conditions with Gd-containing contrast agents had no effect on the cell vitality for the investigated conditions ranging from 0.16–3.15 mg/mL (see Supplementary Appendix C). For the treatment with MoNPs ranging from 0.01–0.2 mg/mL, we observed an increasing absorption signal for the MTT conversion reaction in both, 2D and 3D conditions. Therefore, we assume that the presence of MoNPs led to an unwanted side reaction for the conversion of the MTT dye in a concentration-dependent manner.
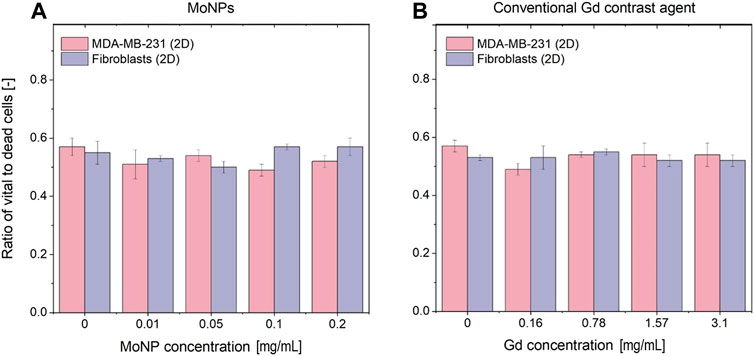
FIGURE 8. Cytotoxicity of the investigated conventional and nanoparticle-based contrast agents measured by Ki-67 immunohistochemistry staining and cell counting (A) for MoNP treatment and (B) Gd treatments in the 3D tissue-engineered breast cancer model after 48 h incubation. The data points are represented as the mean ± standard deviation of triplicate measurements.
Here, we present the results of our pilot study on small-animal-sized phantom measurements considering in vivo-relevant imaging parameters. MC simulations were carried out for the in vitro imaging-task characterization and quantitative performance analysis of the multislice cone-beam XFCT setup. The spatial resolution was estimated using two point-sized emitters, each with a 0.4 mm diameter, embedded in a cylindrical water phantom with a diameter of 50 mm and located at the center of the field of view. For Gd as contrast agents, the sources emitted X-ray photons in the characteristic energy range of the Gd K-shell (42–43 keV). The emitters can be interpreted as point sources with reference to the expected spatial resolution. Assuming at least 3σ (where σ (sigma) represents the standard deviation of the background noise) XRF signal differentiability over the background noise, an achievable spatial resolution of about 1.6 ± 0.1 mm was determined at the ∼ 3.29
Figure 9 shows the reconstructed axial slices of the Gd-containing calibration samples (0–3.1 mg/mL) embedded inside a water phantom. The calibration curve in Figure 10, obtained from the reconstructed data, shows the measured relative net XRF signal intensities for the known Gd calibration concentrations. The relative intensities are obtained through normalization by the maximum net XRF signal intensity. A linear relationship was detected between the relative net XRF signal intensity and Gd concentration, with a slight deviation from zero in the intercept of the regression line. This discrepancy in the intercept of the regression line may be attributed to background noise, but with a larger sample size of low-concentration calibration samples, this trend could potentially be corrected. The minimum detectable Gd concentration of 0.031 wt% (0.31 mg/mL), also the least detectable calibration sample concentration, was defined as the XFCT detection sensitivity in the Gd imaging scheme. This sensitivity limit was determined (methodology similar to [23]) as the net measured XRF signal, detectable above the 3σ (3 times the background standard deviation, or the upper limit of the
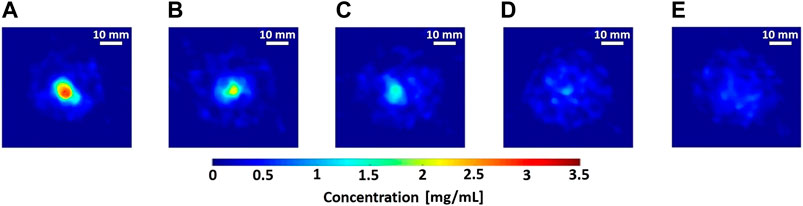
FIGURE 9. (A–E) Reconstructed axial slices of 3.1–0 mg/mL Gd calibration samples (8 mm diameter polypropylene microcentrifuge tubes) embedded in water phantom (50 mm maximal diameter), performed with 10-view projections using anisotropic total variation (TV) based sparsifying transform in Green’s one-step-late TV-EM algorithm [50, 51]. Scale bar: 10 mm.
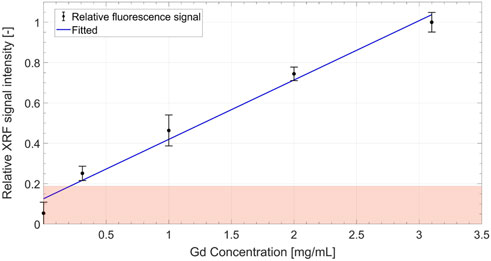
FIGURE 10. Calibration curve showing a linear increase in the relative (normalized by the maximum net XRF signal intensity) net XRF signal intensity with increasing Gd concentration. The boundary of the shaded zone represents the 3σ (i.e.,
The XFCT imaging time for the Gd tissue and the phantom scans with 10-view sparse tomography (30 mm interior region-of-interest FOV, 20 mm longitudinal-FOV) was just under ∼30 min, including the sample rotation and data acquisition, leading to an estimated (MC) XFCT imaging dose of about 276cGy (∼23cGy per projection estimated dose, i.e., the absorbed energy in a scoring volume held inside the 50 mm cylindrical water phantom at the isocenter of the scan cone-beam profile) at the isocenter. The estimated absorbed dose for the CBCT scans, using Gd as a contrast agent for either phantom, was approximately 3.3 cGy (∼1.1 mGy per projection) at the isocenter for an exposure time of 6s s per projection.
An achievable spatial resolution of 1.8 mm (1.8 ± 0.2 mm) is estimated for MoNPs using MC simulations, which were conducted as described for the Gd case but with molybdenum K-shell characteristic energies and MoNP scan geometry. The MoNP detection limit (see Figure 11) was estimated with a relaxed noise condition in comparison to the Gd case, i.e., with a 95% confidence interval about the background level. Therefore, the sensitivity in the in vitro setting was about 0.05 wt% with an estimated (MC) dose at the isocenter of ∼3 cGy and ∼0.33mGy per projection for XFCT and CBCT scans, respectively. This resulted in a total imaging dose of about 94 cGy for MoNPs. The imaging time was about ∼ 2.6 h and 12 min for XFCT and CBCT, respectively.
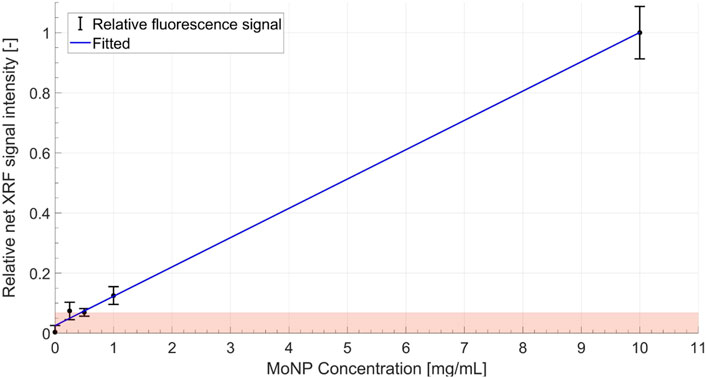
FIGURE 11. Calibration curve showing a linear increase in the relative (normalized by the maximum net XRF signal intensity) net XRF signal intensity with increasing MoNP concentration. Here a relaxed noise limit is considered due to the low-count statistics in MoNP imaging, i.e., the boundary of the shaded zone represents the 1.96σ (i.e.,
In either imaging configuration, the spatial resolution and low-concentration sensitivity were limited primarily by the small detection area of the Timepix3, constraining the focal distances for the FOV choice and instrumentation challenges of designing multi-pinhole collimation, besides the predominant signal loss effect from intrinsic background interference. Table 1 summarises the primary XFCT and CBCT imaging performance for the two contrast-agent scanning schemes and their respective dose estimates.
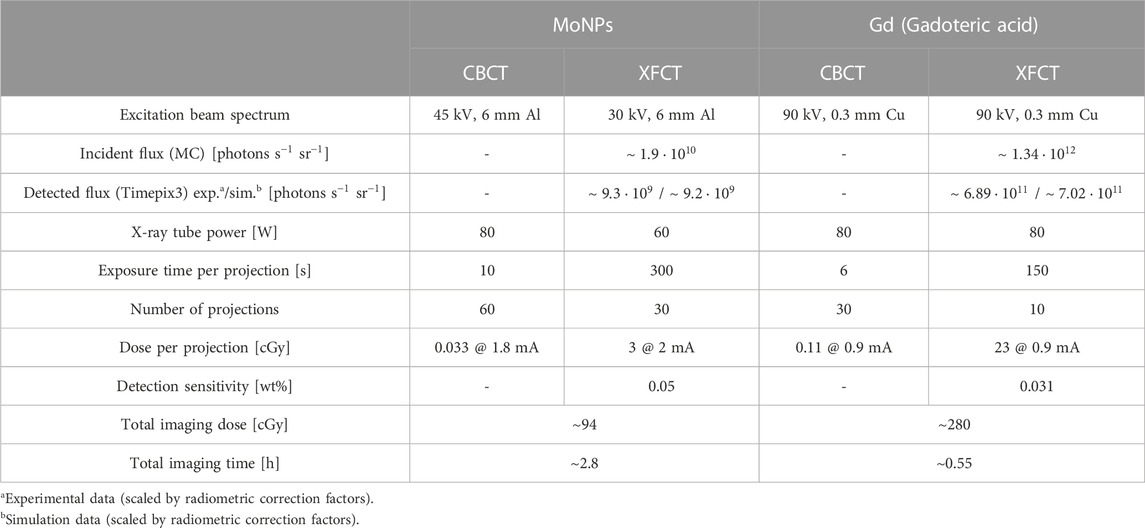
TABLE 1. System characteristics and imaging metrics for CBCT and XFCT scans performed with MoNPs and conventional Gd-containing contrast agents.
In the following section, imaging results of the 3D breast cancer model are reported for the two contrast agents. Figures 12, 13 show the axial, sagittal, and coronal XFCT/CBCT reconstructed slices in the tissue regions for the maximum administered dosages of Gd and MoNPs, respectively, i.e., 3.15 mg/mL Gd and 0.2 mg/mL MoNPs, each incubated over 48 h period. The MoNP detection sensitivity was initially overestimated as 0.01 wt% (subsequently corrected to 0.05 wt%), leading to a maximum administered MoNP dose of 0.2 mg/mL for in vitro imaging experiments. Therefore, the MoNP reconstructed images display significant noise from scattered background noise along with XRF signals (proportional to the MoNP concentration) in and around the tissue containing cell-crown regions. The CBCT reconstructed images for the two contrast agents varied primarily due to differences in the reconstruction techniques outlined in section 2.9, angular sampling frequency (i.e., 30 and 60 views for Gd and MoNPs, respectively), and CT energies. The CBCT images for the MoNP case are characterized by the presence of noise and streaky artifacts from the FDK reconstruction algorithm, as seen in Figure 13B. On the other hand, for the Gd case, the positive smoothing parameter (ɛ = 0.0001) and TV regularization (β = 0.05) were set to reduce streaky artifacts and noise in CBCT images [50].
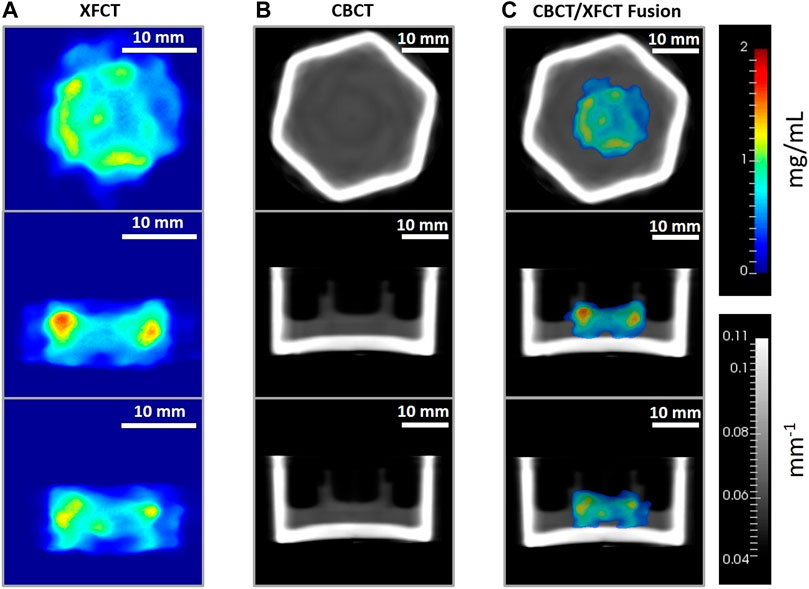
FIGURE 12. Axial (top row), sagittal (middle row), and coronal (bottom row) image planes from the tomographic reconstruction (TV-EM) of the 3D breast cancer tissue model administered with 3.15 mg/mL Gd and incubated over 48 h period. Gd concentration (mg/mL) maps from (A) XFCT reconstruction (magnification factor approx. ×1.5), (B) linear attenuation coefficient (mm−1) maps of the cell crown/holder held inside borosilicate glass container with cell-culture growth medium, obtained from the CBCT scans, and (C) XFCT image data fused with CBCT images. For (C), thresholding
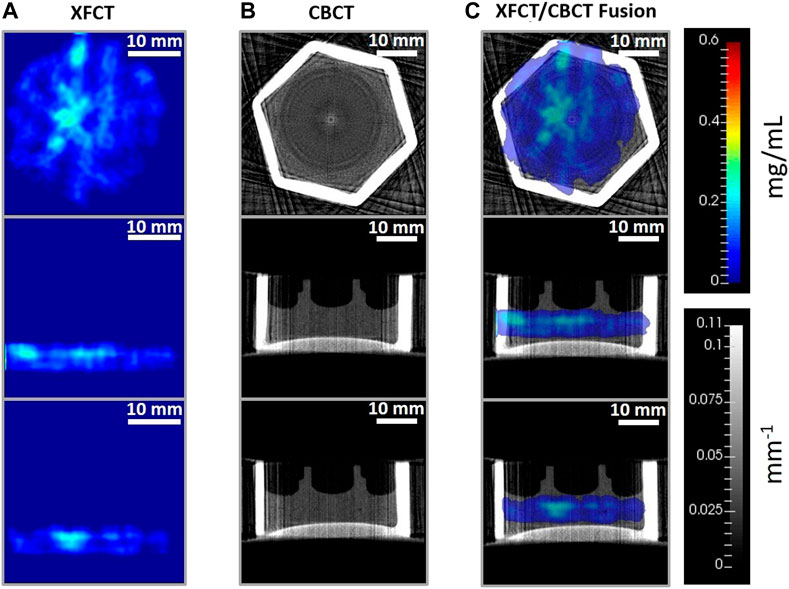
FIGURE 13. Reconstructed axial (top row), sagittal (middle row), and coronal (bottom row) tissue slices from (A) XFCT using anisotropic TV-EM algorithm, (B) CBCT reconstruction from FDK algorithm, and (C) XFCT-CBCT registered images of the multilayer cell-culture sandwich administered with 0.2 mg/mL MoNP solution, imaged at 48h incubation period. The rainbow color bar shows the MoNP concentration (mg/mL). The grayscale color bar shows the attenuation coefficients (mm−1). Scale bar: 10 mm.
Figure 14B displays the sampled accumulations of Gd in the central and peripheral uptake regions of tissue-containing reconstructed slices, which were obtained through local-contrast segmentation using Gd concentration thresholds. The average sampled Gd concentration is seen to increase with the increasing administered dose while having lower accumulations in the central tissue regions. The maximum administered dose of 3.15 mg/mL Gd led to an average sampled Gd concentration of 0.85 ± 0.01 mg/mL in the central and 1 ± 0.05 mg/mL in the peripheral regions, respectively. Below the sensitivity limit, i.e., for 0.16 mg/mL dosage, the average accumulations of Gd concentration are overestimated due to sampling errors (identification of tissue regions in local low contrast areas, resulting from background noise).
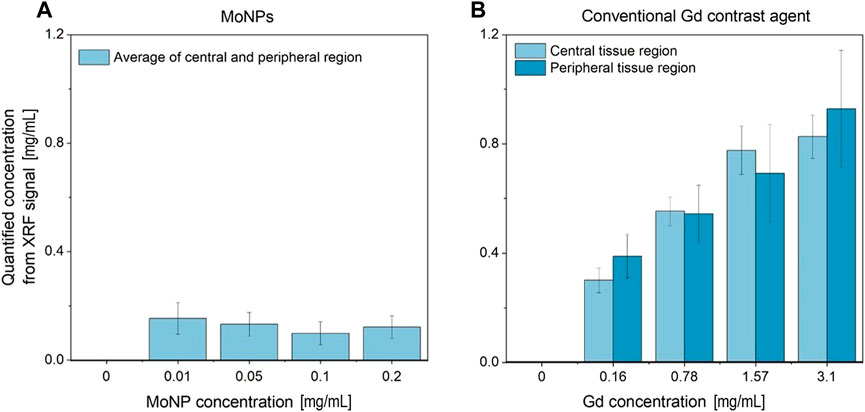
FIGURE 14. (A) Average MoNP and (B) Gd uptake concentration sampled (local-contrast-based threshold segmentation) from the reconstructed slices in the central and peripheral (adjacent to cell crown) ROI in the tissue region.
For MoNPs (see Figure 14A) with 0.2 mg/mL and 0.1 mg/mL dosages, as to be expected, the average sampled concentrations were lower than the respective maximum administered doses. However, 0.05 mg/mL and 0.01 mg/mL resulted in significant overestimation from segmentation sampling errors and misclassification of signal and background regions, both during segmentation and signal extraction from curve fittings under relaxed SNR limits (SNR
The results demonstrate the 3D localization capability of the benchtop cone-beam XFCT system for Gd-containing contrast agents and MoNPs for the tissue-engineered microphysiological 3D breast cancer model with in vivo mimicking properties. The proposed XFCT imaging technique allows for multislice spatiotemporal reconstruction of elemental composition maps through a dynamic event-based (ToA and ToT) acquisition of X-ray projections while providing X-ray attenuation maps needed for correcting the excitation and fluorescence X-ray intensities. For varying administered Gd doses, the local deposited concentrations in different regions of the target tissue slices were successfully quantified, exhibiting in vitro low-contrast imaging performance of the XFCT system. For MoNPs, the maximum administered dose was lower than the detection limit due to an overestimation of the sensitivity limits made prior to the in vitro tissue experiments, however, the imaging capability is still demonstrable (see Figure 11) at higher administered NP dosages.
Since a large object volume in the context of small-animal imaging (about 50 mm diameter) is scanned at shorter scan-times, leading to multislice imaging (for example, with 1.6 mm spatial resolution and 20 mm longitudinal FOV, at least 12 axial slices can be reliably reconstructed) with the contrast positions not known a priori in the cone-beam volume, there is a larger intrinsic background effect due to an increased proportion of scattered photon generation, particularly in the case of polychromatic excitation sources [21, 57]. Therefore, slightly higher radiation doses per projection are necessitated specifically in comparison to the scanning techniques with high energy resolution single-pixel multichannel detectors in benchtop cone-beam and pencil-beam settings [23–26]. For instance, the multislice 3D imaging scheme for the Gd contrast agents (0.031 wt% detection limit) with low power microfocus X-ray source, presented here, currently requires a radiation dose of ∼23 cGy per projection with ∼33 min total scan-time in comparison to ∼1.87 cGy per projection for a Gold nanoparticle (0.03 wt% detection limit in 30 mm diameter water phantom) single-slice scheme with single-pixel detectors having ∼1 h total scan-time, or ∼1 cGy per projection for Gd nanoparticles (NaGdF4, 0.18 wt% detection limit in 50 mm diameter water phantom) single-slice fan-beam scheme (linear-array PCDs, 0.5 × 2 mm rectangular pinhole) with ∼7.5 min total scan-time [24, 27]. It is also seen for the imaging geometry, via MC simulations, that requirement of spectral bandwidth of the incident cone-beam is more critical to background yield reduction (see Supplementary Appendix B).
Besides ineffective dose utilization in the image formation process, limited by the detection solid-angle from the single-pinhole collimation and small area (∼14 mm × 14 mm active detection area) pixelated detector, intrinsic detector effects also contribute significant noise to the signal background. Here, the primary detector effects contributing to the sensitivity deterioration, consequently increasing the radiation dose, were the charge-sharing and partial charge deposition from CdTe XRF photons (CdTe presents a fluorescence yield of about 80% and a mean free path of 58 μm and 110 μm for Te and Cd, respectively) in the small-pixel (55 μm) CdTe configuration. Both these effects cause significant distortions in measurements and degradation of the detector energy resolution adding to the XRF signal detectability loss from the scattered photon interference in the signal bins. Though simple charge-sharing reconstruction and CdTe XRF corrections are implemented, an improved approach is necessary, along with instrumentation improvements. Therefore, additionally, our future considerations may involve, e.g., developing dedicated XRF detectors, better suited for high-energy detection. Nonetheless, with ten such single-pinhole (corresponding to the Gd 10-view sparse imaging presented here) detectors arranged in a circular geometry (forming 2 π solid angle in the scan mid-plane), an order of magnitude reduction in X-ray dose can be obtained, specifically for the Gd imaging scheme with about 2.3 cGy per projection, therefore reaching small-animal in vivo acceptable dose limits, for, e. g., below 30 cGy in mice [33, 58]. Consequently, the total imaging time with parallel acquisition would then be reduced to below ∼ 6 min, far below in vivo scan-time constraints, for, e.g., determined by effective anaesthetized period as short as 30–60 min [59, 60]. Furthermore, multi-pinhole collimation in such a configuration may allow additional reduction of the XFCT imaging dose through SNR improvements per projection by a factor equal to the number of pinholes [60]. For the same dose limit, densely sampling systems which capture projections with smaller angular increments would suffer from lower signal statistics per projection, leading to overall sensitivity loss and an increase in total scanning time. A geometric/mechanical arrangement of ten such detectors is completely feasible in the current XFCT setup.
As substantial dose enhancements can be achieved through optimization of the applied X-ray beam energies, under the current imaging configurations, imaging dose (dose per projection of 23 cGy and 7.1 cGy for Gd and MoNPs, respectively) and detection sensitivity (0.031 wt% and 0.05 wt% for Gd and MoNPs, respectively) could be lowered further for a fixed scan-time limit and maximum excitation voltage through improved beam filtration possibilities and (or) quasi-monochromatic beams from high-power X-ray sources, therefore, minimizing low energy radiation dose below K-absorption edges of the contrast agents. Here, the present setup was limited by 90 kV maximum voltage and 80 W maximum tube power, limiting the optimization possibilities of the incident X-ray spectrum for the scan-time limit under 30 min. Also, further enhancement of both detection sensitivity and delivered dose can be achieved, for, e.g., from detailed simulation studies for specific imaging tasks and tissue models. With the application of variance reduction techniques, utilization of well-validated MC-based forward projectors may allow reconstruction without the need for calibration measurements, thus allowing accurate quantification results. For larger objects in cone-beam scanning, the marker accumulation can be far away from the local calibration points and, therefore, quantification may suffer from errors due to shift-variant sensitivities, requiring multiple calibration points for accurate quantification. Additionally, our future approaches may involve, e.g., using low-dose cone-beam scans for coarse localization and concave reflecting-type optics for cone-beam focusing, allowing higher and variable spatial resolution imaging with higher signal statistics from radiation concentration effects.
In this pilot study, we have characterized a benchtop setup for fast, and fully-3D quantitative XRF imaging with a cone-beam X-ray source and a tissue-engineered breast cancer model. We have focused on identifying requirements and demonstrating feasibility with a polychromatic microfocus source using a region-of-interest sparse sampling geometry (10-view for Gd) and reconstruction approach, along with the optimization of components including pixelated CdTe detectors (Timepix3 HPCD, Advacam) and micro-pinhole collimators, excitation beam optimization using beam-shaping filters, and background noise reduction. Considering critical physical constraints inherent to in vivo imaging, particularly scanning time, contrast dose, and radiation dose, our optimizations allow for high-spatial-resolution longitudinal imaging that is feasible for both in vitro and in vivo experiments.
A tissue-engineered microphysiological breast cancer model was used to evaluate the system performance after treatment with conventional Gd-based and nanoparticle (Mo)- based contrast agents. The proposed XRF imaging setup showed the applicability and feasibility of cone-beam methodology for quantitative in vitro and in vivo NP imaging at an acceptable dosage with a spatial resolution below
Besides assessing the feasibility of high-resolution imaging, challenges and limitations of current cone-beam techniques are outlined, particularly for achieving higher resolution. Current high-flux benchtop X-ray sources, e.g., based on liquid metal targets, which allow high spatial resolution, have limitations in accommodating multiplexed pharmacokinetics across a wide range of nanoparticle-coupled drug candidates due to their restrictions to low-Z nanoparticles. As pointed out, monochromatization is essential to reduce background contribution from Compton scattering. To achieve this, our future investigations will employ bent mosaic crystals that rely on Bragg reflection. These crystals potentially offer high reflection efficiencies suitable for medium-Z nanoparticles and enable beam focusing for higher resolution scans with higher expected SNR. Preceding high-resolution scans, coarse scans can be performed via cone-beam XFCT to identify the region of interest. This becomes particularly important when the size scale of the imaging object increases.
Overall, our proposed approach of combining a high-resolution molecular imaging modality and complex tissue-engineered organ models offer new possibilities in translational biomedical engineering for nanodrug screenings and innovative cancer radiology.
The raw data supporting the conclusion of this article will be made available by the authors, without undue reservation.
MF, KK, HW, and CH conceived the project and designed experiments. MF, HW, KK, and CH developed methodology. MF, KK, MA-M, RK, SO, and AC acquired data. MF and KK analyzed and interpreted data. MF, KK, MA-M, HW, and CH wrote, reviewed, or revised the manuscript. TS, FG, and TM provided technical and material support. HW, FG, TM, and CH supervised the study. All authors read and approved the final manuscript.
This work was funded by the research grant “Biokinetic and Physical Simulation Studies for the Design of in Vivo Imaging Pharmacokinetics” of the Ministry of Science, Energy, Climate Protection and Environment of the Federal State of Saxony-Anhalt (Germany).
The authors declare that the research was conducted in the absence of any commercial or financial relationships that could be construed as a potential conflict of interest.
All claims expressed in this article are solely those of the authors and do not necessarily represent those of their affiliated organizations, or those of the publisher, the editors and the reviewers. Any product that may be evaluated in this article, or claim that may be made by its manufacturer, is not guaranteed or endorsed by the publisher.
The Supplementary Material for this article can be found online at: https://www.frontiersin.org/articles/10.3389/fphy.2023.1125143/full#supplementary-material
BSA, Bovine Serum Albumin; CBCT, Cone-beam computed tomography; CdTe, Cadmium Telluride; DMSO, Dimethyl sulfoxide; EM, Expectation maximization; FOV, Field of view; FWHM, Full Width at Half Maximum; HE, Hematoxylin-Eosin; HPCD, Hybrid photon counting detector; MAP, Maximum A Posteriori; MC, Monte Carlo; MLEM, Maximum likelihood expectation maximization; Mo, Molybdenum; MoNP, Molybdenum nanoparticle; MTT, 3-(4,5-dimethylthiazol-2-yl)-2,5-diphenyltetrazolium bromide; PBS, Phosphate-Buffered Saline; PCD, Photon counting detector; SISmuc, Small intestine submucosa + mucosa; TEM, Transmission electron microscopy; ToA, Time-of-arrival; ToT, Time-over-Threshold; TV, Total variation; XFI, X-ray fluorescence imaging; XRF, X-ray fluorescence; XFCT, X-ray fluorescence computed tomography.
1. Caddeo S, Boffito M, Sartori S. Tissue engineering approaches in the design of healthy and pathological in vitro tissue models. Front Bioeng Biotechnol (2017) 5:40. doi:10.3389/fbioe.2017.00040
2. Driehuis E, Kretzschmar K, Clevers H. Establishment of patient-derived cancer organoids for drug-screening applications. Nat Protoc (2020) 15:3380–409. doi:10.1038/s41596-020-0379-4
3. Jackson S, Thomas G. Human tissue models in cancer research: Looking beyond the mouse. Dis Models Mech (2017) 10:939–42. doi:10.1242/dmm.031260
4. Rodrigues J, Heinrich M, Teixeira L, Prakash J. 3d in vitro model (r)evolution: Unveiling tumor-stroma interactions. Trends Cancer (2020) 7:249–64. doi:10.1016/j.trecan.2020.10.009
5. Martinez Pacheco S, Driscoll L. Pre-clinical in vitro models used in cancer research: Results of a worldwide survey. Cancers (2021) 13:6033. doi:10.3390/cancers13236033
6. Singh V, Seed T. How necessary are animal models for modern drug discovery?: Animal models for drug discovery. Expert Opin Drug Discov (2021) 16:1391–7. doi:10.1080/17460441.2021.1972255
7. Amin MB, Greene FL, Edge SB, Compton CC, Gershenwald JE, Brookland RK, et al. The eighth edition ajcc cancer staging manual: Continuing to build a bridge from a population-based to a more “personalized” approach to cancer staging. CA: a Cancer J clinicians (2017) 67:93–9. doi:10.3322/caac.21388
8. Poornima K, Francis AP, Hoda M, Eladl MA, Subramanian S, Veeraraghavan VP, et al. Implications of three-dimensional cell culture in cancer therapeutic research. Front Oncol (2022) 12:891673. doi:10.3389/fonc.2022.891673
9. Sacchi M, Bansal R, Rouwkema J. Bioengineered 3d models to recapitulate tissue fibrosis. Trends Biotechnol (2020) 38:623–36. doi:10.1016/j.tibtech.2019.12.010
10. Hormuth DA, Jarrett AM, Lorenzo G, Lima EA, Wu C, Chung C, et al. Math, magnets, and medicine: Enabling personalized oncology. Expert Rev Precision Med Drug Dev (2021) 6:79–81. doi:10.1080/23808993.2021.1878023
11. Kim J, Koo B-K, Knoblich J. Human organoids: Model systems for human biology and medicine. Nat Rev Mol Cel Biol (2020) 21:571–84. doi:10.1038/s41580-020-0259-3
12. Pelaz B, Alexiou C, Alvarez-Puebla RA, Alves F, Andrews AM, Ashraf S, et al. Diverse applications of nanomedicine. ACS nano (2017) 11:2313–81. doi:10.1021/acsnano.6b06040
13. Vu TQ, Lam WY, Hatch EW, Lidke DS. Quantum dots for quantitative imaging: From single molecules to tissue. Cel Tissue Res (2015) 360:71–86. doi:10.1007/s00441-014-2087-2
14. Abou-Elkacem L, Bachawal SV, Willmann JK. Ultrasound molecular imaging: Moving toward clinical translation. Eur J Radiol (2015) 84:1685–93. doi:10.1016/j.ejrad.2015.03.016
15. Appel A, Anastasio MA, Brey EM. Potential for imaging engineered tissues with x-ray phase contrast. Tissue Eng B: Rev (2011) 17:321–30. doi:10.1089/ten.teb.2011.0230
16. Beard P. Biomedical photoacoustic imaging. Interf focus (2011) 1:602–31. doi:10.1098/rsfs.2011.0028
17. Chen H, Rogalski M, Anker J. Advances in functional x-ray imaging techniques and contrast agents. Phys Chem Chem Phys : PCCP (2012) 14:13469–86. doi:10.1039/c2cp41858d
18. Körnig C, Staufer T, Schmutzler O, Bedke T, Machicote A, Liu B, et al. In-situ x-ray fluorescence imaging of the endogenous iodine distribution in murine thyroids. Scientific Rep (2022) 12:2903–9. doi:10.1038/s41598-022-06786-4
19. Kahl H, Staufer T, Körnig C, Schmutzler O, Rothkamm K, Grüner F. Feasibility of monitoring tumor response by tracking nanoparticle-labelled t cells using x-ray fluorescence imaging—A numerical study. Int J Mol Sci (2021) 22:8736. doi:10.3390/ijms22168736
20. Schmutzler O, Graf S, Behm N, Mansour WY, Blumendorf F, Staufer T, et al. X-ray fluorescence uptake measurement of functionalized gold nanoparticles in tumor cell microsamples. Int J Mol Sci (2021) 22:3691. doi:10.3390/ijms22073691
21. Grüner F, Blumendorf F, Schmutzler O, Staufer T, Bradbury M, Wiesner U, et al. Localising functionalised gold-nanoparticles in murine spinal cords by x-ray fluorescence imaging and background-reduction through spatial filtering for human-sized objects. Scientific Rep (2018) 8:16561. doi:10.1038/s41598-018-34925-3
22. Pereira G, Lopes R. X-ray fluorescence microtomography in biological applications (2011). IntechOpen. doi:10.5772/24535
23. Manohar N, Reynoso F, Diagaradjane P, Krishnan S, Cho S. Quantitative imaging of gold nanoparticle distribution in a tumor-bearing mouse using benchtop x-ray fluorescence computed tomography. Scientific Rep (2016) 6:22079. doi:10.1038/srep22079
24. Manohar N, Reynoso FJ, Cho SH. Technical note: A benchtop cone-beam x-ray fluorescence computed tomography (XFCT) system with a high-power x-ray source and transmission CT imaging capability. Med Phys (2018) 45:4652–9. doi:10.1002/mp.13138
25. Larsson J, Vogt C, Twengström W, Toprak M, Dzieran J, Henriksson M, et al. High-spatial-resolution x-ray fluorescence tomography with spectrally matched nanoparticles. Phys Med Biol (2018) 63:164001. doi:10.1088/1361-6560/aad51e
26. Shaker K, Vogt C, Katsu-Jiménez Y, Kuiper RV, Andersson K, Li Y, et al. Longitudinal in-vivo x-ray fluorescence computed tomography with molybdenum nanoparticles. IEEE Trans Med Imaging (2020) 39:3910–9. doi:10.1109/tmi.2020.3007165
27. Zhang S, Li L, Chen J, Chen Z, Zhang W, Lu H. Quantitative imaging of gd nanoparticles in mice using benchtop cone-beam x-ray fluorescence computed tomography system. Int J Mol Sci (2019) 20:2315. doi:10.3390/ijms20092315
28. Moseley HG. Lxxx. the high-frequency spectra of the elements. part ii. Lond Edinb Dublin Phil Mag J Sci (1914) 27:703–13. doi:10.1080/14786440408635141
29. Vernekohl D, Ahmad M, Chinn G, Xing L. Feasibility study of compton cameras for x-ray fluorescence computed tomography with humans. Phys Med Biol (2016) 61:8521–40. doi:10.1088/0031-9155/61/24/8521
30. Islamian J, Azazrm A, Mahmoudian B, Gharapapagh E. Advances in pinhole and multi-pinhole collimators for single photon emission computed tomography imaging. World J Nucl Med (2015) 14:3–9. doi:10.4103/1450-1147.150505
31. Kumakhov MA. Status of polycapillary optics and perspectives. Int Conf X-ray neutron Capillary Opt (2002) 4765:20–5. doi:10.1117/12.489770
32. Kumakhov MA. Capillary optics and their use in x-ray analysis. X-Ray Spectrom Int J (2000) 29:343–8. doi:10.1002/1097-4539(200009/10)29:5<343::aid-xrs414>3.0.co;2-s
33. Badea CT, Drangova M, Holdsworth DW, Johnson G. In vivo small-animal imaging using micro-ct and digital subtraction angiography. Phys Med Biol (2008) 53:R319–50. doi:10.1088/0031-9155/53/19/r01
34. Pittet MJ, Grimm J, Berger CR, Tamura T, Wojtkiewicz G, Nahrendorf M, et al. In vivo imaging of t cell delivery to tumors after adoptive transfer therapy. Proc Natl Acad Sci (2007) 104:12457–61. doi:10.1073/pnas.0704460104
35. Xia Q, Huang J, Feng Q, Chen X, Liu X, Li X, et al. <p>Size- and cell type-dependent cellular uptake, cytotoxicity and in vivo distribution of gold nanoparticles</p>. Int J nanomedicine (2019) 14:6957–70. doi:10.2147/ijn.s214008
36. Hainfeld JF, Slatkin DN, Smilowitz HM. The use of gold nanoparticles to enhance radiotherapy in mice. Phys Med Biol (2004) 49:N309–15. doi:10.1088/0031-9155/49/18/n03
37. Meyer D, Schaefer M, Doucet D. Advances in macrocyclic gadolinium complexes as magnetic resonance imaging contrast agents. Invest Radiol (1990) 25:S53–5. doi:10.1097/00004424-199009001-00025
38. Corot C, Port M, Raynal I, Dencausse A, Schaefer M, Rousseaux O, et al. Physical, chemical, and biological evaluations of p760: A new gadolinium complex characterized by a low rate of interstitial diffusion. J Magn Reson Imaging (2000) 11:182–91. doi:10.1002/(sici)1522-2586(200002)11:2<182::aid-jmri16>3.0.co;2-5
39. Mohamed H, Elatawy R, Ghoneim A, El-Ghor A. Induction of fetal abnormalities and genotoxicity by molybdenum nanoparticles in pregnant female mice and fetuses. Environ Sci Pollut Res (2020) 27:23950–62. doi:10.1007/s11356-020-08137-0
40. Tice RR, Hayashi M, MacGregor JT, Anderson D, Blakey DH, Holden HE, et al. Report from the working group on the in vivo mammalian bone marrow chromosomal aberration test. Mutat Research/Environmental Mutagenesis Relat Subjects (1994) 312:305–12. doi:10.1016/0165-1161(94)00016-6
41. Mortezazadeh T, A E M, M K. Glucosamine conjugated gadolinium (iii) oxide nanoparticles as a novel targeted contrast agent for cancer diagnosis in mri. J Biomed Phys Eng (2020) 10:25–38. doi:10.31661/jbpe.v0i0.1018
42. Chenthamara D, Subrmaniam S, Ramakrishnan S, Krishnaswamy S, Musthafa ME, Lin F-H, et al. Therapeutic efficacy of nanoparticles and routes of administration. Biomater Res (2019) 23:20. doi:10.1186/s40824-019-0166-x
43. Nietzer S, Baur F, Sieber S, Hansmann J, Schwarz T, Stoffer C, et al. Mimicking metastases including tumor stroma: A new technique to generate a three-dimensional colorectal cancer model based on a biological decellularized intestinal scaffold. Tissue Eng C: Methods (2016) 22:621–35. doi:10.1089/ten.TEC.2015.0557
44. Wallstabe L, Göttlich C, Nelke L, Kühnemundt J, Schwarz T, Nerreter T, et al. Ror1-car t-cells are effective against lung and breast cancer in advanced microphysiologic 3d tumor models. JCI Insight (2019) 4:e126345. doi:10.1172/jci.insight.126345
45. Allison J, Amako K, Apostolakis J, Arce P, Asai M, Aso T, et al. Recent developments in geant4. Nucl Instr Methods Phys Res Section A: Acc Spectrometers, Detectors Associated Equipment (2016) 835:186–225. doi:10.1016/j.nima.2016.06.125
46. Shimazaki H, Shinomoto S. A method for selecting the bin size of a time histogram. Neural Comput (2007) 19:1503–27. doi:10.1162/neco.2007.19.6.1503
47. Donoho DL. Compressed sensing. IEEE Trans Inf Theor (2006) 52:1289–306. doi:10.1109/tit.2006.871582
48. Barrett HH, Myers KJ. Foundations of image science. New Jersey, United States: John Wiley and Sons (2013).
49. Blumendorf F. Background reduction for XFI with human-sized phantoms. Germany: Staats-und Universitätsbibliothek Hamburg Carl von Ossietzky (2019). Ph.D. thesis.
50. Panin V, Zeng G, Gullberg G. Total variation regulated em algorithm [spect reconstruction]. IEEE Trans Nucl Sci (1999) 46:2202–10. doi:10.1109/23.819305
51. Zeng GL, Li Y, Zamyatin A. Iterative total-variation reconstruction versus weighted filtered-backprojection reconstruction with edge-preserving filtering. Phys Med Biol (2013) 58:3413–31. doi:10.1088/0031-9155/58/10/3413
52. Burger C, Goerres G, Schoenes S, Buck A, Lonn A, Von Schulthess G. Pet attenuation coefficients from ct images: Experimental evaluation of the transformation of ct into pet 511-kev attenuation coefficients. Eur J Nucl Med Mol Imaging (2002) 29:922–7. doi:10.1007/s00259-002-0796-3
53. LaCroix K, Tsui B, Hasegawa B, Brown J. Investigation of the use of x-ray ct images for attenuation compensation in spect. IEEE Trans Nucl Sci (1994) 41:2793–9. doi:10.1109/23.340649
54. Siddon RL. Fast calculation of the exact radiological path for a three-dimensional ct array. Med Phys (1985) 12:252–5. doi:10.1118/1.595715
55. Feldkamp LA, Davis LC, Kress JW. Practical cone-beam algorithm. Josa a (1984) 1:612–9. doi:10.1364/josaa.1.000612
56. Barrett HH, Myers KJ, Hoeschen C, Kupinski MA, Little MP. Task-based measures of image quality and their relation to radiation dose and patient risk. Phys Med Biol (2015) 60:R1–R75. doi:10.1088/0031-9155/60/2/R1
57. Ahmad M, Bazalova M, Xiang L, Xing L. Order of magnitude sensitivity increase in x-ray fluorescence computed tomography (xfct) imaging with an optimized spectro-spatial detector configuration: Theory and simulation. IEEE Trans Med Imaging (2014) 33:1119–28. doi:10.1109/tmi.2014.2305101
58. Parkins C, Fowler J, Maughan R, Roper M. Repair in mouse lung for up to 20 fractions of x rays or neutrons. Br J Radiol (1985) 58:225–41. doi:10.1259/0007-1285-58-687-225
59. Takeda T, Wu J, Huo Q, Yuasa T, Hyodo K, Dilmanian FA, et al. X-ray fluorescent ct imaging of cerebral uptake of stable-iodine perfusion agent iodoamphetamine analog imp in mice. J synchrotron Radiat (2009) 16:57–62. doi:10.1107/s0909049508031853
Keywords: tissue engineering, X-ray fluorescence computed tomography, in vivo pharmacokinetics, in vitro cancer models, nanoparticle contrast agents, molecular imaging
Citation: Kumar K, Fachet M, Al-Maatoq M, Chakraborty A, Khismatrao RS, Oka SV, Staufer T, Grüner F, Michel T, Walles H and Hoeschen C (2023) Characterization of a polychromatic microfocus X-ray fluorescence imaging setup with metallic contrast agents in a microphysiological tumor model. Front. Phys. 11:1125143. doi: 10.3389/fphy.2023.1125143
Received: 15 December 2022; Accepted: 20 March 2023;
Published: 20 April 2023.
Edited by:
Guillem Pratx, Stanford University, United StatesReviewed by:
Stefan Bartzsch, Technical University of Munich, GermanyCopyright © 2023 Kumar, Fachet, Al-Maatoq, Chakraborty, Khismatrao, Oka, Staufer, Grüner, Michel, Walles and Hoeschen. This is an open-access article distributed under the terms of the Creative Commons Attribution License (CC BY). The use, distribution or reproduction in other forums is permitted, provided the original author(s) and the copyright owner(s) are credited and that the original publication in this journal is cited, in accordance with accepted academic practice. No use, distribution or reproduction is permitted which does not comply with these terms.
*Correspondence: Melanie Fachet, bWVsYW5pZS5mYWNoZXRAb3ZndS5kZQ==
†These authors have contributed equally to this work
Disclaimer: All claims expressed in this article are solely those of the authors and do not necessarily represent those of their affiliated organizations, or those of the publisher, the editors and the reviewers. Any product that may be evaluated in this article or claim that may be made by its manufacturer is not guaranteed or endorsed by the publisher.
Research integrity at Frontiers
Learn more about the work of our research integrity team to safeguard the quality of each article we publish.