 Yuhang Tian
 Zhong Chen1,2*
 Shuhong Wang
94% of researchers rate our articles as excellent or good
Learn more about the work of our research integrity team to safeguard the quality of each article we publish.
Find out more
ORIGINAL RESEARCH article
Front. Phys., 26 January 2023
Sec. Physical Acoustics and Ultrasonics
Volume 11 - 2023 | https://doi.org/10.3389/fphy.2023.1122617
This article is part of the Research TopicUltrasound Micromanipulations and Ocean Acoustics: From Human Cells to Marine StructuresView all 11 articles
The compression wave speed and physical properties of seafloor sediments are significant in marine engineering and marine acoustics. Although most regression equations can be satisfactorily fitted to the data and provide a useful predictive method, there is little insight into the influence of physical properties on the compression wave speed of seafloor sediment in the South China Sea (SCS). To characterize the compression wave speed and physical properties of seafloor sediments, the compression wave speed, porosity, density, and mean grain size were measured and calculated for forty-two samples collected from the South China Sea. The results show that the RMS roughness of seafloor sediment in the South China Sea ranges from 0.2 to 15 μm, and the porosity and density are determined by the RMS roughness and mean grain size. The relationships between the compression wave speed and physical properties of seafloor sediments are consistent with the intergranular friction model. When we have the physical parameters but no compression wave speed, therefore, the intergranular friction model can be used to predict the compression wave speed of seafloor sediment. Compared with the Wood model curve, we also reveal that the intergranular friction of seafloor sediment is an important parameter in determining the compression wave speed.
The compression wave and physical properties of seafloor sediments can provide basic information for use in submarine geomorphology and ocean acoustic field simulations [1–8]. Moreover, these parameters are vital for the theory of wave propagation in unconsolidated seafloor sediment [9–16]. In addition, these parameters can be used to evaluate the geological events of marine sedimentary environments and control seismoacoustic propagation in the ocean [17–23].
In recent decades, extensive studies have been conducted to reveal the relationships between compression waves and physical properties and textural parameters relative to various regions, such as the North Pacific [17], Yellow Sea of China [2,8,24–26], South China Sea (SCS) [7,14,15,23,27,28], South Sea of Korea [12,19,20,22,30], West coast of India [31], and West coast of Scotland [32]. These relationships show that the density, porosity, and mean grain size play a central role in determining the compression wave speed of seafloor sediment [33,34]. Furthermore, a number of empirical site-specific equations have been established for calculating the compression wave speed in seafloor sediment for different physical properties and textural parameters [14,30,35–38,40], that are consistent with the data measured at different sites. Regression equations can be fitted to the data well and offer a valuable forecasting tool, however, they offer little understanding of how physical properties influence the compression wave speed of unconsolidated seafloor sediment.
Although regression equations can be satisfactorily fitted to the data and provide a useful predictive method, they provide little insight into the influence of physical properties on the compression wave speed of unconsolidated seafloor sediment.
The random packing of rough spheres model and the intergranular friction model were developed by Buckingham to represent the compression wave propagation in an unconsolidated granular medium [41,42]. The random packing of rough spheres model demonstrates that the porosity and density are each correlated with the mean grain size, and the intergranular friction model relates the compression wave speed to the porosity, density, and mean grain size of seafloor sediment. These theoretical models show compelling agreement with published data [17,18]. However, less research has been conducted on whether these theoretical models match the data measured from the SCS and explains the effects of the physical properties on the compression wave speed.
In this paper, we measured and studied the compression wave speed and physical properties of seafloor sediment in the SCS. The purpose of this article is to investigate the influences of physical properties on the compression wave speed using the random packing of rough spheres model and the intergranular friction model.
The data analyzed in this study area (11–22°N and 109–119°E) were collected from 42 stations in the SCS. We obtained 27 samples from the continental shelf, 3 samples from the continental slope, and 12 samples from the abysmal sea. Sediment samples were obtained using a box corer. After gathering the seafloor sediments, we used a box corer to extract small, cylindrical samples that varied in length from 0.2 to 0.5 m. Using a portable WSD-3 digital sonic instrument, the compression wave speed of the seafloor sediment was measured in a typical laboratory (23°C, atmospheric pressure). With the aid of Vaseline, the acoustic transducers were joined to the top and bottom of the sediment. The frequency of transducer is 100 kHz. The compression wave speed (
where L is the length of the sediment sample, t is the propagation time, and
The error analysis was performed using the accuracy calculation method.
The uncertainty of the compression wave speed is approximately ±5 m/s.
The density and porosity of the seafloor sediment were measured. The density and porosity were measured and calculated by the core cutter method. The sediment textures were analyzed using Malvern Mastersizer 2000 at the South China Sea Institute of Oceanology of the Chinese Academy of Sciences. The associated standard deviations were <3%.
The compression wave speed of seafloor sediment in the SCS is between 1,446 and 1773 m/s (Table 1). [14] obtained the compression wave speed of seafloor sediment in the SCS ranging from 1,420 to 1,880 m/s. The compression wave speed of seafloor sediment in the middle southern Yellow Sea measured by Sun were 1,456–1,653 m/s [8]. The measurement results of compression wave speed in this study are consistent with those measured by Lu and are higher than those in the middle southern Yellow Sea.
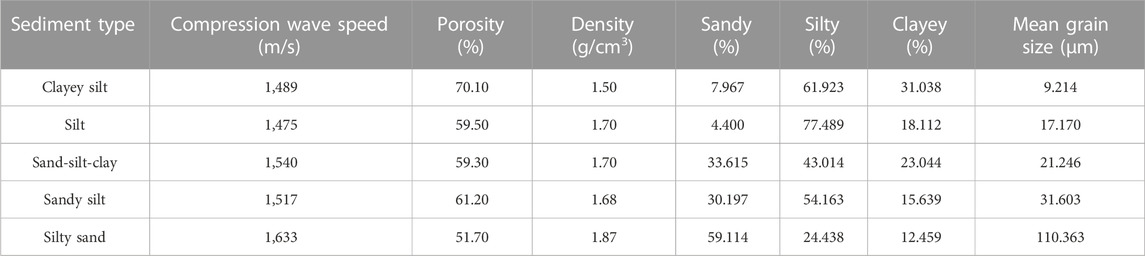
TABLE 1. Average values of the physical properties of the seafloor sediments.
The average values of the density, porosity, and sediment textures are also given in Table 1. The porosity of seafloor sediment in the northern SCS ranges from 0.43 to 0.82 and that of the southern Yellow Sea ranges from 0.39 to 0.76 [8]. Our porosity (0.43-0.81) results are consistent with the northern SCS and higher than the middle southern Yellow Sea. The density of seafloor sediment in this study ranges from 1.21 to 2.08 g/cm3, which is lower than that of the southern Yellow Sea sediment measured by Sun who obtained the density rang of 1.40–2.10 g/cm3 [8]. There are five types of seafloor sediment: clayey silt, silt, sand-silt-clay, sandy silt, and silty sand (Figure 1). The clayey silt has smaller compression wave speed, lower density, lower mean grain size, higher porosity, and higher clay content, compared with other types of sediment, including silt, sand-silt-clay, sandy silt, and silty sand.
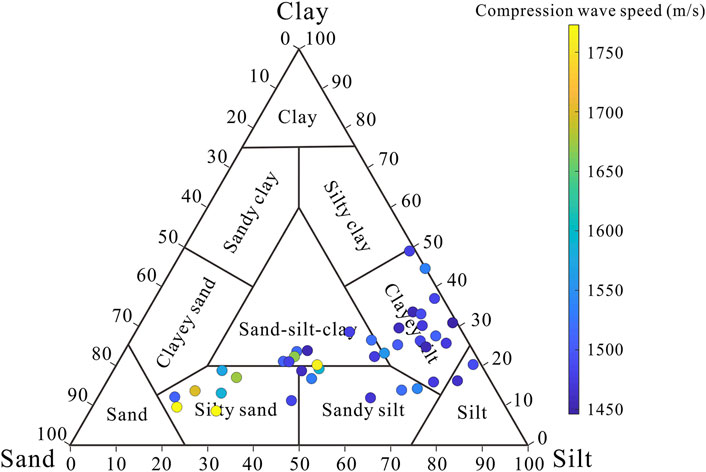
FIGURE 1. Sediment granularity triangle classification.
Seafloor sediment is known as a two-phase medium consisting of loose mineral grains and seawater. In the absence of intergranular friction, the compression wave speed in such a medium would be given by the Wood model [43]. That is, the Wood model can be used to express the sound speed as a function of the known mechanical properties of mineral grains and seawater [44]. The Wood model for compression wave speed in seafloor sediment is defined as follows:
Combining Eqs 3–5, the expression for
where
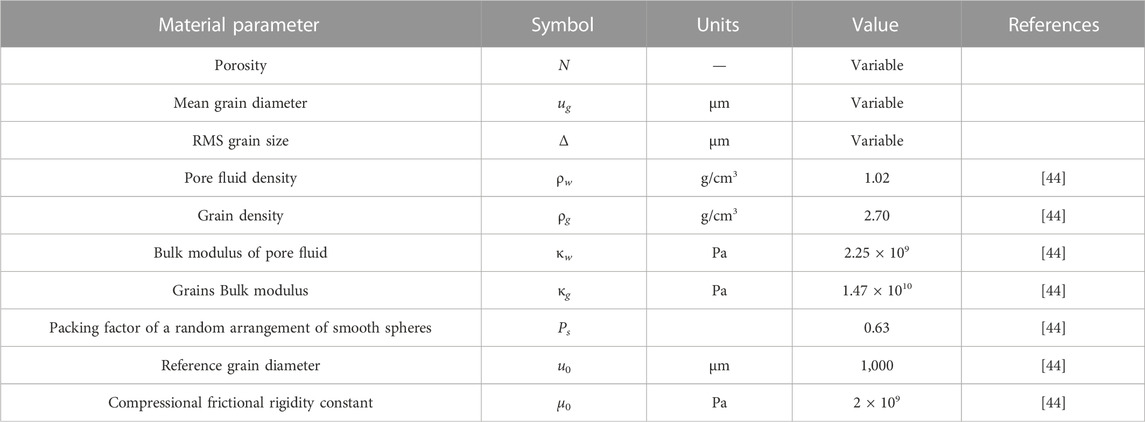
TABLE 2. Parameters in the Wood model, random packing of rough spheres model, and the intergranular friction model.
Particle roughness is an important factor in determining the porosity and density of seafloor sediments [44]. To simulate porosity, the mineral particles constituting the sediment are assumed to be rough spheres of uniform size. For a sediment in which each grain is in close contact with the surrounding grains, the porosity is the volume fraction of sea water in the medium that can be expressed as
where
For coarser-grained sediments, particle roughness effects represent a negligible departure, and thus, the packing is similar to the random packing of smooth spheres. However, in finer-grained sediments, the surface roughness may be comparable to or much greater than the mean grain size, in which case close contact between adjacent grains is prevented, thus allowing pore water to percolate between grains, and resulting in an increase in the porosity [45]. Based on the aforementioned analysis, Eq. 7 has been modified by Buckingham as follows [42]:
where
The intergranular friction model is derived from the Kroning-Kramers relationship without considering a specific loss mechanism [44] and the Hertz theory of deformation of spherical, elastic bodies in contact [46]. The advantage of using the intergranular friction model is that the compression wave speed can be computed using simple algebraic expressions that are functions of the physical properties of the sediments, including the porosity, density, and mean grain size. The intergranular friction model is proposed as follows:
Combining Eqs 9, 10, the expression for
where
Equation 11 gives the compression wave speed in terms of grain size, which itself is related to the porosity and density through Eqs 4, 8. Thus, the compression wave speed of the seafloor sediment can be expressed in terms of the mean grain size, porosity, and density.
The relationship between porosity and mean grain size from Eq. 8 is represented in Figure 2. The mean grain size varies from 4.12 to 224.07 μm, and the porosity varies from 0.43 to 0.81. As shown in Figure 2, the RMS roughness values of the random packing of rough spheres model are 0.2, 1, 3, 4.5, 9, and 15 from the top to down, respectively. These random packing of rough spheres model curves show that, the porosity value of seafloor sediment decreases slowly with increasing the mean grain size when the mean grain size is less than 100 μm. Because the seafloor sediment has a greater porosity and smaller mean grain size within this range. The porosity declines steeply with increasing the mean grain size when it is between 100 and 102 μm. When the mean grain size exceeds 102 μm, the porosity declines gently and gets closer to a constant as the mean grain size rises. Because the seafloor sediment has a smaller porosity and greater mean grain size within this range.
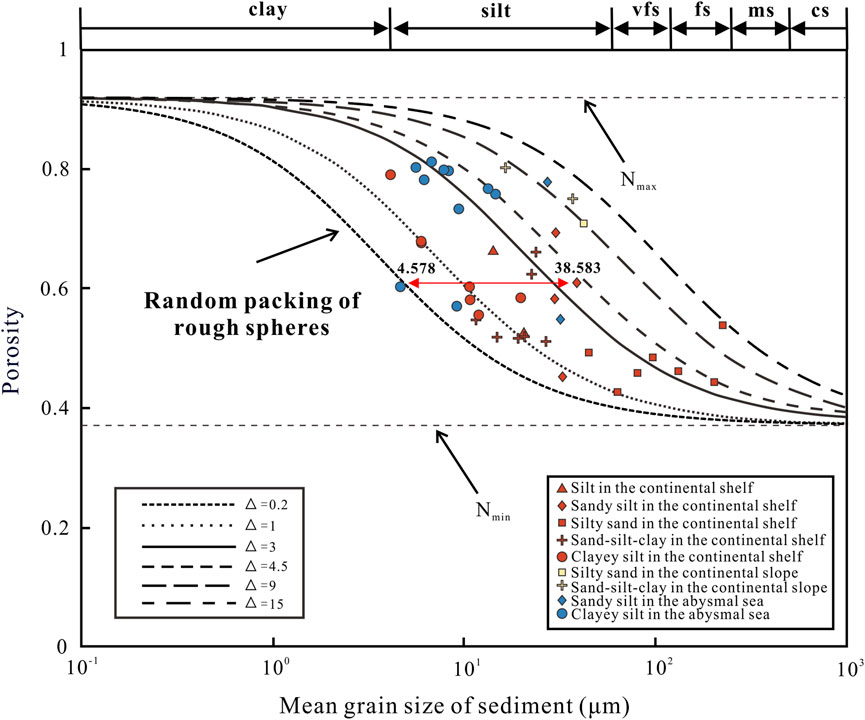
FIGURE 2. Relationship between the mean grain size and porosity of seafloor sediments. The line represents the mean grain size versus porosity and density curve of RMS (root mean square) roughness = 0.2, 1, 3, 4.5, 9, and 15 μm vfs is very fine sand; fs is fine sand; ms is medium sand; and cs is coarse sand.
In Eq. 8, the porosity of seafloor sediment is controlled by the RMS roughness and the mean grain size. When the mean grain size is much larger than the RMS roughness, the porosity gets closer to its minimum value. At the limit of a large mean grain size (
Inversely, when the mean grain size is much smaller than the RMS roughness, the porosity approaches its maximum value. At the limit of a large mean grain size (
The lowest measured porosity in clayey silt is 0.43, which is larger than
The lower boundary of the measured mean grain size and porosity data is the random packing of rough spheres model with the RMS roughness of 0.2, and the upper boundary of the measured data is the random packing of rough spheres model with the RMS roughness of 15. In addition, most measured data of the continental shelf and the continental slope lie on both sides of the random packing of rough spheres model with the RMS roughness of 3.
The results demonstrate that there is a complicated relationship between the porosity and mean grain size of seafloor sediment. The porosity of seafloor sediment is determined by the mean grain size and the RMS roughness, which means that the same value of porosity can have various compositions of the RMS roughness and the mean grain size. For example, the clayey silt with the porosity of 0.60 can have the mean grain size with 4.578 μm and the RMS roughness with 0.2, and the sandy silt with the porosity of 0.61 can have the mean grain size with 38.583 μm and the RMS roughness with 4.5. Without taking into account the RMS roughness, errors will be introduced when the porosity is only expressed using the mean grain size. Therefore, the RMS roughness of the seafloor sediment needs to be considered when analyzing the relationship between the compressional wave speed and porosity.
The measured density and porosity data of seafloor sediment in the SCS are shown in Figure 3. The porosity of seafloor sediment is between 0.43 and 0.81, and the density of seafloor sediment is between 1.21 and 1.78 g/cm3. The measured porosity and density data are in accordance with the Eq. 4. Thus, the density of seafloor sediment can be directly evaluated from the porosity when the grain density and the fluid density are given. The results show that there is a good linear relationship between the measured porosity and density data in Figure 3. Therefore, the density can be expressed as porosity when studying the correlation between the porosity and the compression wave speed of seafloor sediment.
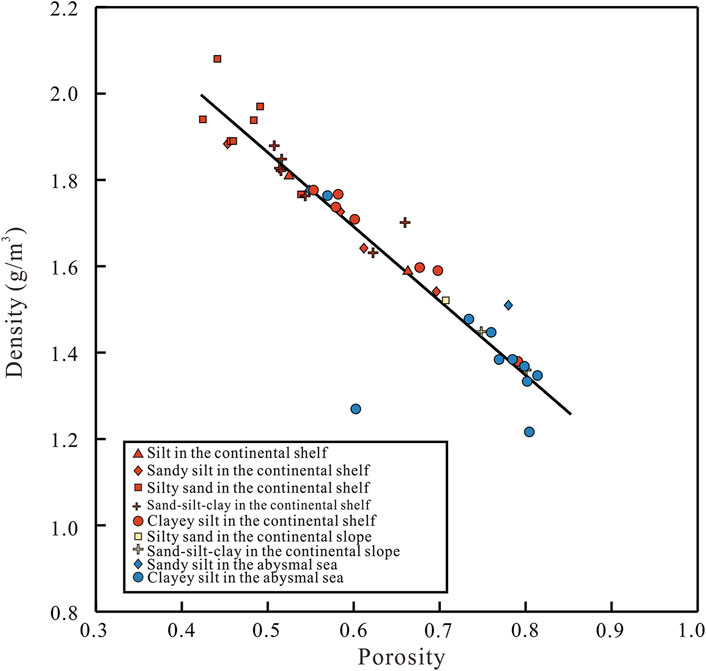
FIGURE 3. Relationship between the density and porosity of seafloor sediment.
The correlation between the density and mean grain size from Eqs 4, 8 is represented in Figure 4. The mean grain size varies from 4.12 to 224.07 μm, and the density varies from 1.21 to 1.78 g/cm3. And, the RMS roughness values of the random packing of rough spheres model are 0.2, 1, 3, 4.5, 9, and 15 from the top to down, respectively. When the mean grain size is less than 100 μm, the random packing of rough spheres model curve shows that the density increases slowly with increasing the mean grain size. Because the seafloor sediment has a lower density and smaller mean grain size within this range. The density increases steeply with increasing the mean grain size when it ranges from 100 to 102 μm. When the mean grain size exceeds 102 μm, the density increases gently again and gets closer to a constant as the mean grain size rises. Because the seafloor sediment has a higher density and greater mean grain size within this range.
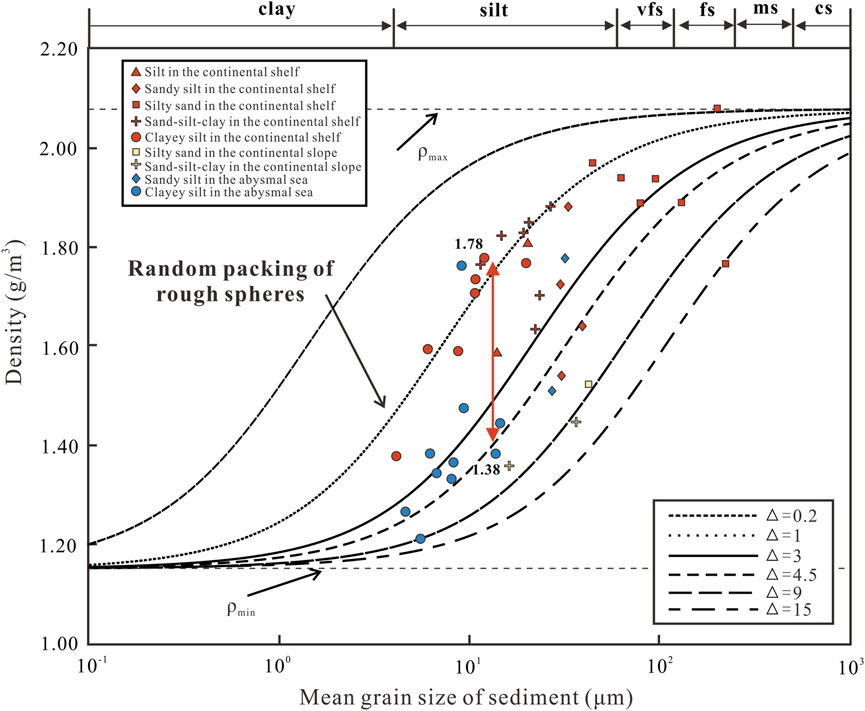
FIGURE 4. Relationship between the mean grain size and density of seafloor sediment from the SCS, respectively. The line represents the mean grain size versus porosity and density curve of RMS (root mean square) roughness = 0.2, 1, 3, 4.5, 9, and 15 μm vfs is very fine sand; fs is fine sand; ms is medium sand; and cs is coarse sand.
Equations 4, 8 show the porosity versus density and the porosity versus mean grain size, respectively. Because the density can be expressed as porosity, Eq. 4 can be modified as follows:
In Eq. 14, when the mean grain size is much larger than the RMS roughness, the density approaches its maximum value. In the limit of a large mean grain size (
when the mean grain size is much smaller than the RMS roughness, the porosity approaches its minimum value. In the limit of a large mean grain size (
The lowest measured density is 1.21 g/cm3, which is larger than
The lower boundary of the measured mean grain size and density data is the random packing of rough spheres model with the RMS roughness of 0.2, and the upper boundary of the measured data is the random packing of rough spheres model with the RMS roughness of 15. On both sides of the random packing of rough spheres model with the RMS roughness of 3, the most measured mean grain size and density data of the continental shelf and the continental slope are located.
The results demonstrate that there is a complicated correlation between the density and the mean grain size of seafloor sediment. The density of seafloor sediment is determined by the RMS roughness and the mean grain size, suggesting that the same value of the density can have various constitutions of the mean grain size and the RMS roughness. As shown in Figure 4, the clayey silt with the density of 1.78 g/cm3 can have the mean grain size with 11.975 μm and the RMS roughness with 1, and the sandy silt with the porosity of 1.77 g/cm3 can have the mean grain size with 224.067 μm and the RMS roughness with 15. Without taking into account the RMS roughness, errors will be introduced when the density is only expressed using the mean grain size. Thus, the RMS roughness of the seafloor sediment is also considered when studying the correlation between the density and the compressional wave speed.
The relationship between the mean grain size and compression wave speed can be developed in Eq. 9 by combining Eqs 7, 8. As a result, in the intergranular friction model, the mean grain size can be considered the only parameter of the compression wave speed, and the relationship between the compression wave speed and the mean grain size is a cubic equation.
The link between the measured compression wave speed and the mean grain size of seafloor sediment in the SCS is listed in Table 3. The compression wave speed ranges from 1,446 to 1773 m/s, and the mean grain size ranges from 4.12 to 224.07 μm. The measured data (Figure 5) are the compression wave speed and the mean grain size for different sediment types, and the distribution of these data are in agreement with the data obtained by [47], [48], and [17,49]. A trend common to these data is that the clayey silt, silt and sandy silt tend to exhibit lower compression wave speeds, while the sand-silt-clay and silty sand tend to exhibit higher compression wave speeds. In addition, most of these data from the abysmal sea are distributed around the intergranular friction model and this study curve. However, the measured data of the continental shelf are slightly higher than the prediction of the intergranular friction model.
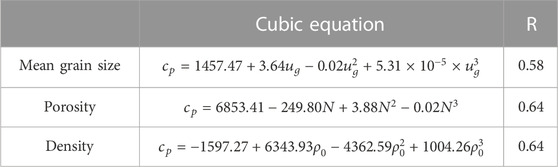
TABLE 3. Relationships of the compression wave speed with physical porosities.
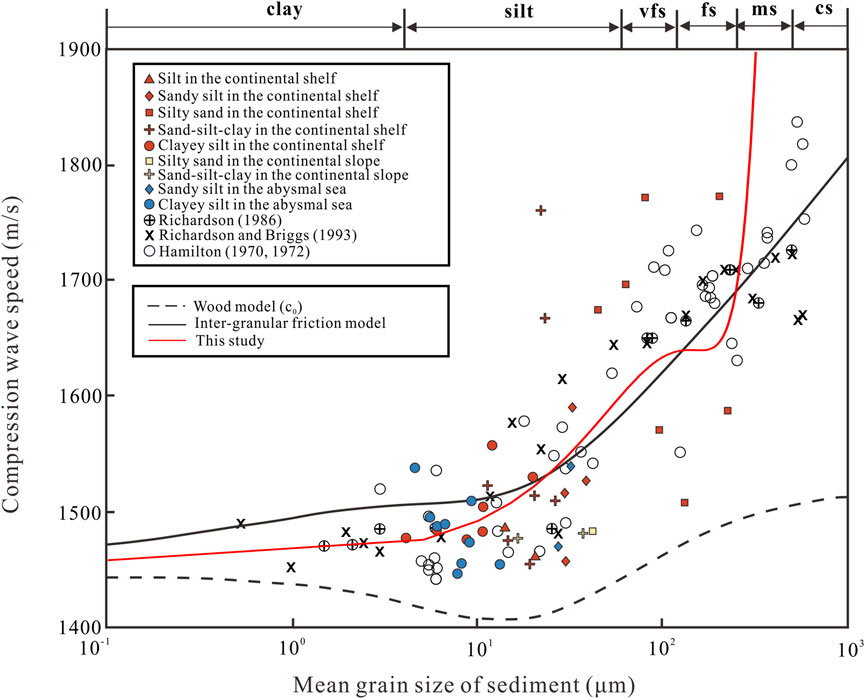
FIGURE 5. Relationship between the mean grain size and compression wave speed of seafloor sediments.
The cubic curve of the mean grain size versus compression wave speed in this study and the curve of the intergranular friction model are plotted in Figure 5, where the change trend of the compression wave speed with the mean grain size is consistent in both curves. In the intergranular friction model, as the mean grain size grows, so does the compression wave speed of the seafloor sediments. The intergranular friction model curve has a very moderate slope when the mean grain size is between 10−1–101 μm. The slope of the intergranular friction model curve steepens and the gradient of the compression wave speed increases when the mean grain size exceeds 101 μm. This indicates that when the mean grain size is more than 101 m, the compression wave speed is more sensitive to the mean grain size. But for the large mean grain size of seafloor sediment (102–103 μm), it is also found that the deviation between measurement results and theoretical results is quite significant. In order to analyze the evident difference, the compression wave speed (c0) is computed by the Wood model while taking no account of intergranular friction into account (Figure 5). As with the cubic curve and intergranular friction model curve, the slope of Wood model (c0) curve reduces slowly when the mean grain size is low than 101 and increases abruptly as the mean grain size increases (particularly between 102 and 103 μm). Thus, the intergranular friction of seafloor sediment is an important parameter contributing to the difference between the measured and theoretical values.
Equation 8 expresses the link between the mean grain size and the porosity, and Eq. 11 is the link between the compression wave speed and mean grain size. Combining Eqs 8, 11, the link between the compression wave speed and the porosity is established. As a result, in the intergranular friction model, the porosity can be treated as the sole parameter of the compression wave speed.
The link between the measured compression wave speed and the porosity of seafloor sediment in the SCS is listed in Table 3. The compression wave speed ranges from 1,446 to 1773 m/s, and the porosity ranges from 0.43 to 0.81. The measured data (Figure 6) are the compression wave speed and the porosity for different sediment types, and the distribution of these data are in agreement with the data obtained by [47], [48], and [17,49]. As shown in Figure 6, the sand-silt-clay and silty sand have lower porosity and higher compression wave speed, and the clayey silt, silt and sandy silt have lower compression wave speed and higher porosity. It is evident that most of these data from the abysmal sea are located under the intergranular friction model curve. However, the measured data of the continental shelf are slightly higher than the prediction of the intergranular friction model curve.
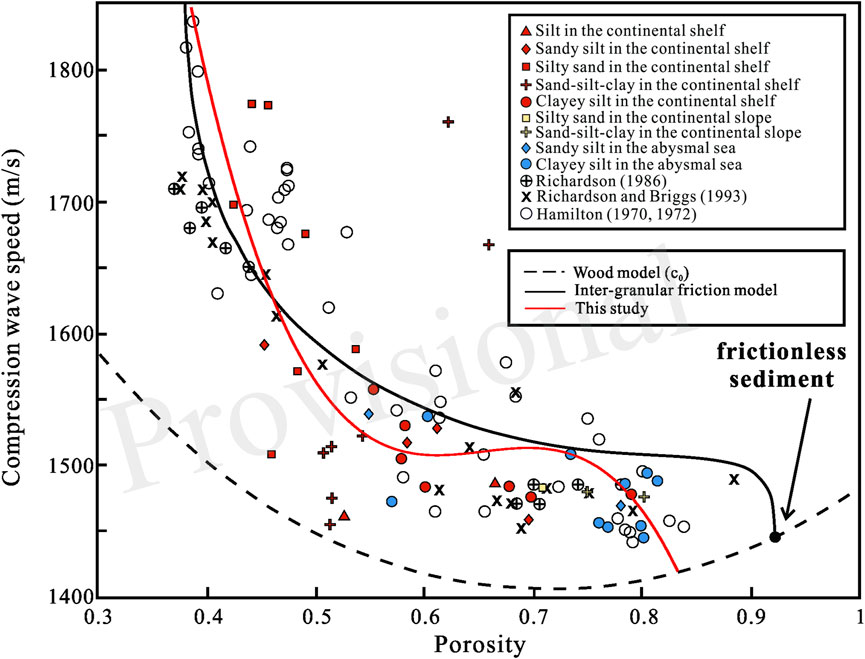
FIGURE 6. Relationship between the porosity and compression wave speed of seafloor sediments.
The cubic curve of the porosity versus compression wave speed and the intergranular friction model curve are plotted in Figure 6, where the change trend of the compression wave speed with the porosity is consistent in both curves. The intergranular friction model curve has a relatively high slope when the sediment porosity is less than 0.6. And the intergranular friction model curve has a softer slope when the sediment porosity is greater than 0.6. The findings indicate that as porosity rises, the compression wave speed seafloor of sediment decreases. Additionally, the findings on compression wave speed and porosity match with the intergranular friction model curve. The intergranular friction model curve has a steep slope when the porosity is less than 0.6. Thus, the compression wave speed of seafloor sediment is more sensitive to the porosity when the porosity is less than 0.6. Comparison with the Wood model curve, the measured data lie above the Wood model curve, suggesting the intergranular friction is also an important parameter in determining the compression wave speed.
Combining Eqs 4, 8, the density can be expressed by the mean grain size, and the link between the compression wave speed and the density can be developed by Eqs 9, 10. As a result, in the intergranular friction model, the density can be viewed as the sole parameter of the compression wave speed.
Table 3 shows the correlation between the measured compression wave speed and the density of seafloor sediment in the SCS. The density ranges from 1.21 to 1.78 g/cm3, and the compression wave speed ranges from 1,446 to 1773 m/s. Figure 6 shows that the measured data are consistent with the data obtained by [47], [48], and [17,49]. Moreover, the sand-silt-clay and silty sand have higher porosity and compression wave speed, but the clayey silt, silt and sandy silt have lower compression wave speed and porosity. Most of these data from the continental shelf are slightly higher than those predicted by the intergranular friction model curve. However, the data in abysmal sea are situated near the intergranular friction model curve.
The intergranular friction model curve and the cubic curve of the density versus compression wave speed are also plotted in Figure 6. In both curves, the compression wave speed changes consistently with density. The intergranular friction model curve has a relatively moderate slope when the sediment density is lower than 1.6 g/cm3. As the density exceeds 1.6 g/cm3, there is a slope in the intergranular friction model curve. These results demonstrate that the drastically elevated compression wave speed of seafloor sediment increases with increasing the density. It is evident that these measured data are agreement with the intergranular friction model curve. Because when the density is more than 1.6 g/cm3, the intergranular friction model curve drastically elevate. Thus, the compression wave speed of seafloor sediment is more sensitive to the density when the density is more than 1.6 g/cm3.
According to Figures 5–7, the measured compression wave speed and physical properties data in the SCS are agreement with the intergranular friction model curve. When we have the physical parameters but no compression wave speed, the intergranular friction model can be used to calculate the compression wave speed of seafloor sediment. Besides, the compression wave speed of seafloor sediment is influenced by many factors. In the intergranular friction model, the intergranular friction of seafloor sediment is considered to be an important factor in controlling the compression wave speed. This is because the particle packing and macroscopic shear strength of seafloor sediment with different intergranular friction are different. The stronger the intergranular friction, the denser the particle packing, and the greater the compression wave speed of seafloor sediment. Moreover, the compression wave speed and physical properties of seafloor sediment are also affected by the seafloor sediment types and geomorphic units, which are affected by the mineral composition and depositional environment of seafloor sediment.
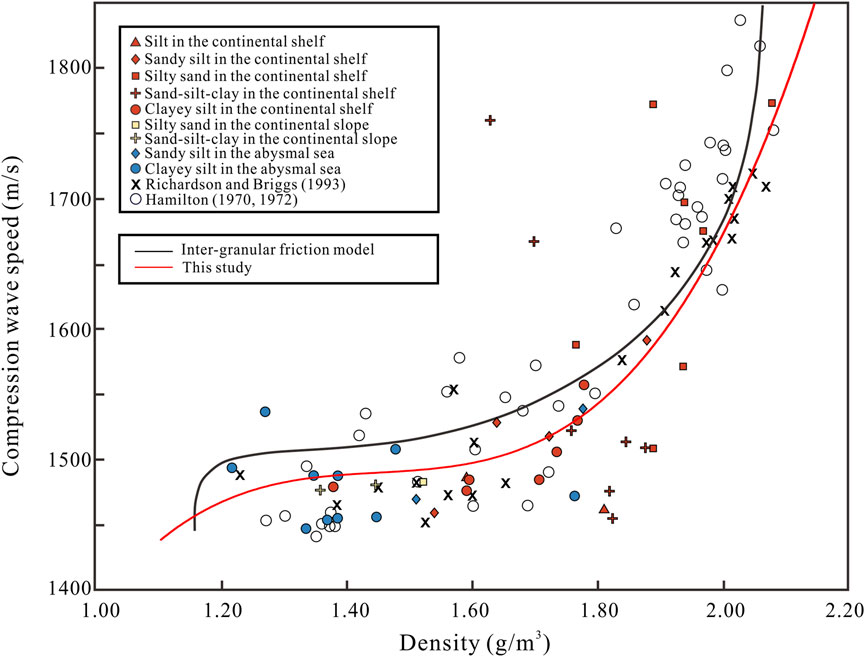
FIGURE 7. Relationship between the density and compression wave speed of seafloor sediments.
The new relationships of seafloor sediment between the compression wave speed and physical properties are studied. Detailed comparisons were made between measured data taken from the SCS and the intergranular friction model of wave propagation in unconsolidated seafloor sediments. The conclusions are outlined as follows:
(1) The RMS roughness of seafloor sediment in the SCS is between 0.2 and 15 μm, and the RMS roughness of seafloor sediment needs to be considered when studying the relationship between the compressional wave speed and physical properties.
(2) There are significant effects of the mean grain size and the RMS roughness on the porosity of seafloor sediment. When the porosity of seafloor sediment is the same, the seafloor sediment could be consisted of complicated the mean grain sizes and the RMS roughness. The measured porosity of seafloor sediment in the SCS lie between the theoretical minimum porosity (0.37) and maximum porosity (0.92).
(3) The relationship between the measured porosity and density of seafloor sediment is linear. Thus, the density can be calculated directly by the porosity when the fluid density and the grain density of seafloor sediment are given. Additionally, the mean grain size and the RMS roughness affect the density. Even though the density is constant, the mean grain sizes and RMS roughness of seafloor sediment may vary. The measured density of seafloor sediment is between 1.21 and 1.78 g/cm3, which is between the theoretical minimum density (1.13 g/cm3) and theoretical maximum density (2.01 g/cm3).
(4) The intergranular friction model and the measured data (compressional wave speed, porosity, density and mean grain size) are agreement. When the mean grain size is greater than 101 μm, the compression wave speed of seafloor sediment is more sensitive to the mean grain size; The compression wave speed is more sensitive to the porosity when the porosity is less than 0.6; And, the compression wave speed is more sensitive to the density when the density is more than 1.6 g/cm3. Moreover, the intergranular friction is an important parameter in determining the compression wave speed.
The datasets presented in this study can be found in online repositories. The names of the repository/repositories and accession number(s) can be found here: https://pan.baidu.com/s/1yeXNCQV6XUUkKZeRAb5mag accession number 0615.
YT contributed to the conception of the study; YT and AX performed the experiment; ZC and WH contributed significantly to analysis and manuscript preparation; YT performed the data analyses and wrote the manuscript; WY, SW, and YM helped perform the analysis with constructive discussions.
This work was financially supported by the following projects: 2020 Research Program of Sanya Yazhou Bay Science and Technology City (SKJC-2020-01-012), National Key R&D Program of China (2021YFC3100600), Chinese National Science Foundation (41976065).
The authors declare that the research was conducted in the absence of any commercial or financial relationships that could be construed as a potential conflict of interest.
All claims expressed in this article are solely those of the authors and do not necessarily represent those of their affiliated organizations, or those of the publisher, the editors and the reviewers. Any product that may be evaluated in this article, or claim that may be made by its manufacturer, is not guaranteed or endorsed by the publisher.
1. Brandes HG, Silva AJ, Sadd MH. Physical and acoustic measurements on cohesionless sediments from the northwest Florida Sand Sheet. Geophys Res Lett (2001) 28(5):823–6. doi:10.1029/2000GL011937
2. Liu B, Han T, Kan G, Li G. Correlations between the in situ acoustic properties and geotechnical parameters of sediments in the Yellow Sea, China. J Asian Earth Sci (2013) 77:83–90. doi:10.1016/j.jseaes.2013.07.040
3. Zou DP, Yan P, Zhou JP. Research on acoustic properties of seafloor sediment with temperature and pressure controlled. Mar Georesources Geotechnology (2014) 32(2):93–105. doi:10.1080/1064119X.2012.661032
4. Wang J, Liu B, Kan G, Li G, Zheng J, Meng X. Frequency dependence of sound speed and attenuation in fine-grained sediments from 25 to 250 kHz based on a probe method. Ocean Eng (2018) 160:45–53. doi:10.1016/j.oceaneng.2018.04.078
5. Zou D, Kan G, Long J, Xiao T. Influence of hydrostatic pressure on the sound speed of surficial seafloor sediments. Mar Georesources Geotechnology (2019) 37(3):277–81. doi:10.1080/1064119X.2017.1409300
6. Li G, Wang J, Liu B, Meng X, Kan G, Pei Y. Measurement and modeling of high-frequency acoustic properties in fine sandy sediments. Earth Space Sci (2019) 6(11):2057–70. doi:10.1029/2019EA000656
7. Li G, Hou Z, Wang J, Kan G, Liu B. Empirical equations of P-wave velocity in the shallow and semi-deep sea sediments from the South China sea. J Ocean Univ China (2021) 20(3):532–8. doi:10.1007/s11802-021-4476-y
8. Sun Z, Kan G, Wang J, Jia Y, Meng X, Li G, et al. Characteristics of shear waves in shallow seafloor sediment in the Middle Southern Yellow Sea. Mar Georesources Geotechnology (2021) 40:383–91. doi:10.1080/1064119X.2021.1900473
9. Biot MA. Theory of propagation of elastic waves in a fluid-saturated porous solid. II. Higher frequency range. The J Acoust Soc America (1956) 28(2):179–91. doi:10.1121/1.1908241
10. Gassmann F. Elastic waves through a packing of spheres. Geophysics (1951) 16(4):673–85. doi:10.1190/1.1437718
11. Dvorkin J, Nur A. Dynamic poroelasticity: A unified model with the squirt and the biot mechanisms. Geophysics (1993) 58(4):524–33. doi:10.1190/1.1443435
12. Kim DC, Sung JY, Park SC, Lee GH, Choi JH, Kim GY, et al. Physical and acoustic properties of shelf sediments, the South Sea of Korea. Mar Geology (2001) 179(1-2):39–50. doi:10.1016/S0025-3227(01)00200-6
13. Chotiros NP, Isakson MJ. A broadband model of sandy ocean sediments: Biot–Stoll with contact squirt flow and shear drag. The J Acoust Soc America (2004) 116(4):2011–22. doi:10.1121/1.1791715
14. Lu B, Li G, Huang S, Li C. Physical properties of sediments on the northern continental shelf of the South China sea. Mar Georesources Geotechnology (2006) 24(1):47–60. doi:10.1080/10641190600559523
15. Zou DP, Wu BH, Lu B. Seafloor deposition state based geoacoustic model of the South China Sea. Mar Georesources Geotechnology (2011) 29(1):61–75. doi:10.1080/1064119X.2010.514256
16. Martin K, Wood W. A new model of marine sediment compression. Earth Planet Sci Lett (2017) 477:21–6. doi:10.1016/j.epsl.2017.08.008
17. Hamilton EL. Sound velocity and related properties of marine sediments, North Pacific. J Geophys Res (1970) 75(23):4423–46. doi:10.1029/JB075i023p04423
18. Richardson MD, Briggs KB, Bentley SJ, Walter DJ, Orsi TH. The effects of biological and hydrodynamic processes on physical and acoustic properties of sediments off the Eel River, California. Mar Geology (2002) 182(1-2):121–39. doi:10.1016/S0025-3227(01)00231-6
19. Kim GY, Kim DC, Yoo DG, Shin BK. Physical and geoacoustic properties of surface sediments off eastern geoje island, South Sea of Korea. Quat Int (2011) 230(1-2):21–33. doi:10.1016/j.quaint.2009.07.028
20. Bae SH, Kim DC, Lee GS, Kim GY, Kim SP, Seo YK, et al. Physical and acoustic properties of inner shelf sediments in the South Sea, Korea. Quat Int (2014) 344:125–42. doi:10.1016/j.quaint.2014.03.058
21. Kim SR, Lee GS, Kim DC, Bae SH, Kim SP. Physical properties and geoacoustic provinces of surficial sediments in the southwestern part of the Ulleung Basin in the East Sea. Quat Int (2017) 459:35–44. doi:10.1016/j.quaint.2017.08.027
22. Kim S, Lee GS, Kim D, Hahn J, Ryang WH. Variation of temperature-dependent sound velocity in unconsolidated marine sediments: Laboratory measurements. Mar Georesources Geotechnology (2018) 36(3):280–7. doi:10.1080/1064119X.2016.1277442
23. Tian Y, Chen Z, Hou Z, Luo Y, Xu A, Yan W. Geoacoustic provinces of the northern South China Sea based on sound speed as predicted from sediment grain sizes. Mar Geophys Res (2019) 40(4):571–9. doi:10.1007/s11001-019-09387-5
24. Meng X, Kan G, Li G, Sun L. Spatial characteristics and geotechnical properties of seafloor sediment in west-central area of Southern Yellow Sea. J Eng Geology (2015) 23(6):1202–10. doi:10.13544/j.cnki.jeg.2015.06.023
25. Zheng J, Liu B, Kan G, Li G, Pei Y, Liu X. The sound velocity and bulk properties of sediments in the Bohai Sea and the Yellow Sea of China. Acta Oceanologica Sinica (2016) 35(7):76–86. doi:10.1007/s13131-016-0906-x
26. Kan G, Liu B, Wang J, Meng X, Li G, Hua Q, et al. Sound speed dispersion characteristics of three types of shallow sediments in the southern yellow sea. Mar Georesources Geotechnology (2018) 36(7):853–60. doi:10.1080/1064119X.2017.1392659
27. Wang J, Guo C, Liu B, Hou Z, Han G. Distribution of geoacoustic properties and related influencing factors of surface sediments in the southern South China Sea. Mar Geophys Res (2016) 37(4):337–48. doi:10.1007/s11001-016-9294-z
28. Meng Q, Liu S, Jia Y, Xiao Z, Wang X. Analysis on acoustic velocity characteristics of sediments in the northern slope of the South China Sea. Bull Eng Geology Environ (2018) 77(3):923–30. doi:10.1007/s10064-017-1070-z
29. Li G, Wang J, Meng X, Liu B, Kan G, Han G, et al. Relationships between the sound speed ratio and physical properties of surface sediments in the South Yellow Sea. Acta Oceanologica Sinica (2021) 40(4):65–73. doi:10.1007/s13131-021-1764-8
30. Kim GY, Park KJ, Lee GS, Yoo DG, Kong GS. Physical property characterization of quaternary sediments in the vicinity of the paleo-Seomjin River of the continental shelf of the South Sea, Korea. Quat Int (2019) 503:153–62. doi:10.1016/j.quaint.2018.09.002
31. Anu AP, Nair PV, Uthaman CP, Kumar TP. Estimation of compressional wave speed in marine sediments using biot-stoll model and buckingham’s grain-shearing model. Defence Sci J (2020) 70(3):336–41. doi:10.14429/dsj.70.14365
32. Hunt C, Demšar U, Dove D, Smeaton C, Cooper R, Austin WE. Quantifying marine sedimentary carbon: A new spatial analysis approach using seafloor acoustics, imagery, and ground-truthing data in Scotland. Front Mar Sci (2020) 7:588. doi:10.3389/fmars.2020.00588
33. Best AI, Tuffin MD, Dix JK, Bull JM. Tidal height and frequency dependence of acoustic velocity and attenuation in shallow gassy marine sediments. J Geophys Res Solid Earth (2004) 109(B8). doi:10.1029/2003JB002748
34. Jackson D, Richardson M. High-frequency seafloor acoustics. Berlin, Germany: Springer Science and Business Media (2007).
35. Williams KL, Jackson DR, Thorsos EI, Tang D, Schock SG. Comparison of sound speed and attenuation measured in a sandy sediment to predictions based on the Biot theory of porous media. IEEE J oceanic Eng (2002) 27(3):413–28. doi:10.1109/JOE.2002.1040928
36. Goto S, Matsubayashi O. Relations between the thermal properties and porosity of sediments in the eastern flank of the Juan de Fuca Ridge. Earth, Planets and Space (2009) 61(7):863–70. doi:10.1186/BF03353197
37. Zimmer MA, Bibee LD, Richardson MD. Measurement of the frequency dependence of the sound speed and attenuation of seafloor sands from 1 to 400 kHz. IEEE J Oceanic Eng (2010) 35(3):538–57. doi:10.1109/JOE.2010.2056230
38. Chen X, Schmitt DR, Kessler JA, Evans J, Kofman R. Empirical relations between ultrasonic P-wave velocity porosity and uniaxial compressive strength. CSEG Rec (2015) 40(5):24–9.
39. Kim BN, Kim E, Ji HY, Sim MS, Choi BK, Kim SH. Quick method to measure acoustic properties of the piston core sediment under laboratory conditions. Jpn J Appl Phys (2019) 58(SG):SGGF04. doi:10.7567/1347-4065/ab19b4
40. De Sousa MC, de Figueiredo JJ, da Silva CB, Nascimento MJDS. Prediction of S-wave velocity by a hybrid model based on the Greenberg-Castagna equation. J Pet Sci Eng (2019) 172:303–13. doi:10.1016/j.petrol.2018.09.014
41. Buckingham MJ. Wave propagation, stress relaxation, and grain-to-grain shearing in saturated, unconsolidated marine sediments. J Acoust Soc America (2000) 108(6):2796–815. doi:10.1121/1.1322018
42. Buckingham MJ. Compressional and shear wave properties of marine sediments: Comparisons between theory and data. J Acoust Soc America (2005) 117(1):137–52. doi:10.1121/1.1810231
44. Buckingham MJ. Theory of acoustic attenuation, dispersion, and pulse propagation in unconsolidated granular materials including marine sediments. J Acoust Soc America (1997) 102(5):2579–96. doi:10.1121/1.420313
45. Wyllie MRJ, Gregory AR, Gardner LW. Elastic wave velocities in heterogeneous and porous media. Geophysics (1956) 21(1):41–70. doi:10.1190/1.1438217
46. Kaye GWC, Laby TH. Tables of physical and chemical constants and some mathematical functions (1966).
47. Richardson MD. Ocean seismo-acoustics. Boston, MA: Springer (1986). p. 527–36. doi:10.1007/978-1-4613-2201-6-51Spatial variability of surficial shallow water sediment geoacoustic properties
48. Richardson MD, Briggs KB. On the use of acoustic impedance values to determine sediment properties. John C. Stennis Space Center, MS, USA: Naval Research Lab Stennis Space Center MS (1993).
49. Hamilton EL. Compressional-wave attenuation in marine sediments. Geophysics (1972) 37(4):620–46. doi:10.1190/1.1440287
50. Del Grosso VA. New equation for the speed of sound in natural waters (with comparisons to other equations). J Acoust Soc America (1974) 56(4):1084–91. doi:10.1121/1.1903388
Keywords: compression wave speed, physical properties, theoretical model, seafloor sediment, South China Sea
Citation: Tian Y, Chen Z, Mo Y, Xie A, Huang W, Wang S and Yan W (2023) Effects of physical properties on the compression wave speed of seafloor sediment in the South China Sea: Comparisons between theoretical models and measured data. Front. Phys. 11:1122617. doi: 10.3389/fphy.2023.1122617
Received: 13 December 2022; Accepted: 16 January 2023;
Published: 26 January 2023.
Edited by:
Wei Li, Huazhong University of Science and Technology, ChinaReviewed by:
Yongyao Chen, Harbin Engineering University, ChinaCopyright © 2023 Tian, Chen, Mo, Xie, Huang, Wang and Yan. This is an open-access article distributed under the terms of the Creative Commons Attribution License (CC BY). The use, distribution or reproduction in other forums is permitted, provided the original author(s) and the copyright owner(s) are credited and that the original publication in this journal is cited, in accordance with accepted academic practice. No use, distribution or reproduction is permitted which does not comply with these terms.
*Correspondence: Zhong Chen, Y2h6aHNvdXRoQHNjc2lvLmFjLmNu; Weixia Huang, aHd4QHNjc2lvLmFjLmNu
Disclaimer: All claims expressed in this article are solely those of the authors and do not necessarily represent those of their affiliated organizations, or those of the publisher, the editors and the reviewers. Any product that may be evaluated in this article or claim that may be made by its manufacturer is not guaranteed or endorsed by the publisher.
Research integrity at Frontiers
Learn more about the work of our research integrity team to safeguard the quality of each article we publish.