
95% of researchers rate our articles as excellent or good
Learn more about the work of our research integrity team to safeguard the quality of each article we publish.
Find out more
ORIGINAL RESEARCH article
Front. Phys. , 19 January 2023
Sec. Interdisciplinary Physics
Volume 11 - 2023 | https://doi.org/10.3389/fphy.2023.1107446
This article is part of the Research Topic Complex Networks in Interdisciplinary Research: From Theory to Applications View all 12 articles
Evaluating the influence of interdisciplinary research is important to the development of science. This work considers the large and small disciplines, calculates the interdisciplinary distance, and analyzes the influence of interdisciplinary behavior and interdisciplinary distance in the academic network. The results show that the risk of interdisciplinary behavior in the large discipline is more significant than the benefits. The peer in the small disciplines will tend to agree with the results of the small discipline across the large discipline. We further confirmed this conclusion by utilizing PSM-DID. The analysis between interdisciplinary distance and scientists’ influence shows that certain risks will accompany any distance between disciplines. However, there still exists a “Sweet Spot” which could bring significant rewards. Overall, this work provides a feasible approach to studying and understanding interdisciplinary behaviors in science.
Modern science aims to solve complex and large-scale social and natural problems [1, 2]. These systematic researches raises higher requirements on participating research team [3–5], which raises higher requirements on participating research teams. For example, collaborators may need expertise in different disciplines [6]. Furthermore, with the in-depth penetration of interdisciplinary expertise, the inherent boundaries of science have been broken, and interdisciplinary behavior has become more popular in modern science [7]. In addition, some pioneering researches involve expertise that often exceeds the scope of knowledge of a single discipline [8, 9]. Nowadays, interdisciplinary research achieves knowledge breakthroughs and innovations through colliding ideas between different disciplines, which is considered a significant feature and future trend of science society [10]. However, the study and the underlying operation mechanisms of interdisciplinarity are still in their infancy. With the successive emergence of academic databases, e.g., Web of Science, Scopus, PubMed, and Microsoft Academic Graph, these databases provide data support for interdisciplinary research. Currently, interdisciplinary research mainly focuses on three aspects: 1) interdisciplinary metrics; 2) interdisciplinary-related policies and funding; and 3) interdisciplinary influence.
The most commonly used measurements to evaluate interdisciplinarity are publications and citations. And the derived index of interdisciplinarity quantifies the diversity of disciplines involved in a paper [11, 12]. Based on the publications, interdisciplinary diversity can define with three dimensions [13], i.e., variety, balance, and disparity. Subsequent research has expanded the measurement dimensions by adding the concept of similarity and adopting cohesiveness [14]. Meanwhile, interdisciplinary research related to citation has also been explored and discovered. For example, the analysis based on citation showed that the knowledge structure of literature has changed and became increasingly interdisciplinary [15]. Furthermore, a recent study further explored the interdisciplinary citation index and the weighted forms, and conducted verification in different disciplines [16].
Interdisciplinary research has attracted more and more attention and one of these foci is to investigate the policy and funding of interdisciplinary research [17–20]. Several prominent institutions have begun to emphasize and encourage the development of interdisciplinary research, such as the interdisciplinary development program of the National Academy of Sciences [21]. However, the evaluation of interdisciplinary funding in the academic field is mixed. One voice says interdisciplinary research is merely a policy incentive without financial support [22], i.e., interdisciplinary research is often unrewarding. For example, researchers have shown that interdisciplinary research has a lower citation and funding success rate [23]. On the contrary, another voice against this conclusion [24] showed that interdisciplinary scientists play an essential role in knowledge dissemination and are superior to scientists in traditional research for both the amount and scale of funding.
Furthermore, the underlying relationship between interdisciplinarity and scientists’ influence [25–27] remains to be investigated. Previous researches provide conflicting evidence. On the one hand, it may be caused by the different definitions of interdisciplinarity. For example, scientists find that interdisciplinarity in physics has a negative influence when they measure the interdisciplinary by calculating the proportion of papers published in other disciplines [28]. Meanwhile, studies on biomedical disciplines show a negative correlation between interdisciplinarity and citation growth [29]. However, a recent study indicates that interdisciplinary papers receive more citations when interdisciplinarity is combined with novelty [30]. Furthermore, research about journals’ analysis shows that papers published in journals with multiple disciplinary classifications receive fewer citations than papers published in disciplinary journals with clear disciplinary boundaries [31]. On the other hand, interdisciplinary analysis based on specific disciplines may lead to deviations. For example, biology and chemistry have a high degree of overlap in expertise, and collaborations among these disciplines tend to receive high citations in target disciplines, both for biology and chemistry. Meanwhile, low citation rates in computer science and humanities interdisciplinary may be caused by the low coverage of literature published in the interdisciplinary disciplines [32].
Although academic fields spend an enormous amount of time and energy on analyzing interdisciplinary behavior, the relationship between interdisciplinary and scientists’ influence is still in its infancy. In this work, we propose the concepts of large and small disciplines and compare the changes in the influence of papers and scientists under interdisciplinary behavior. The main contributions of this work are summarized as follows.
• Our work examines a total of 4.9 million papers over the last 20 years and utilizes statistics and causal inference to quantify scientists’ influence on interdisciplinary behavior.
• We find that the risk is greater than the benefit for the large across small discipline, and the opposite trend in the small discipline. Furthermore, we explore the relationship between scientists’ influence and interdisciplinary distance. The results suggest that there exists a “Sweet Spot” which could bring significant rewards.
• We reveal and analyze the causal relationship between scientists’ influence and interdisciplinary behavior.
The rest of the paper is organized as follows. Section 2 introduces the data preparation and the methods. Section 3 demonstrates the results of scientists’ influence on interdisciplinary behavior. Finally, Section 4 concludes the investigation with some discussions.
This work uses the dataset from Aminer 1. As the release dataset version continues to update, it has become more popular and used for analyzing the information spread [33], studying the scientific influence [34–36], building recommendations in academic networks [37, 38], researching citation and cooperation networks [39–42], and developing the prediction in academic networks [43, 44]. This work adopts the 12th version of the dataset, which includes 4.9 million papers from 113,887 disciplines. The majority of papers contain the paper number, title, scientists, publication, citation, and field information [45]. Specifically, the field information is extracted from Mircosoft Academic Graph (MAG) [46], which contains field names and the weight w for fields of study. We selected 3,054,175 papers from 2000 to 2019, including 3,052,873 papers containing field information and 3,051,022 papers containing more than two fields information. For papers without two fields’ information, we consider the field information according to the fields’ proportion of the reference list, e.g., for paper P, the field A, B and C is 50%, 40% and 10% in the reference list, we attribute field A and B to the paper P.
The influence meaning of citations in different fields is different. In order to avoid the bias, field-normalization is needed. In this work, we introduce the method in [47], and use a weight of the paper given by the dataset to eliminate the impact of the field. Specifically, we define the citation Cf of paper p by,
Here, k is the total number of fields covered by paper p, i is one of the fields (i = 1, 2, 3, …, k), and wi is the weight of the i-th field; the field of research with weight w are given by the dataset; Cp is the number of citations we counted in the dataset;
Our work explores the influence of interdisciplinary behavior based on large and small disciplines on scientists. Specifically, we extract the major and minor disciplines for the paper according to the field weight w and define the top 5% as the large discipline and the bottom 50% as the small discipline. Then, we map the relationship between each paper and large or small disciplines according to citations. For example, paper A has received 10, 5, and two citations in F1, F2, and F3 disciplines, respectively. We can determine that the major discipline of paper A is F1, and the minor is F2. Finally, according to the major and minor disciplines, all papers in the data set can be classified as the large discipline set Pl−l, the large cross the small discipline set Pl−s, the small discipline set Ps−s, and the small cross the large discipline set Ps−l.
To quantify the discipline distance of inter-discipline, we utilize the method proposed by recent literature to measure the research interest evolution [48]. Specifically, all papers are attributed to the first scientist, and we have counted all authors in the data set who have continuously published papers for more than 6 years, and the maximum “tolerance year” is 2 years. For example, a scientist who has continuously published papers in 2000 and 2001, and then continued to publish papers in 2003, is also considered as consecutive publisher. Then we consider paper series for each consecutive publishing scientist as sorted by the publication period. We select three papers at the beginning and the end of the paper series for each scientist, regarded as the scientific outputs of the early and later careers, respectively. It should be noted that the early and late career we defined is not the scientists’ career period, but the period before and after in a long time series. The dataset provides the discipline information representation of each paper, and we calculate the early and later discipline vector according to the discipline weight w. Finally, we can quantify the distance between the early and later career disciplines by calculating the cosine similarity of early and later career discipline vectors J. Figure 1 demonstrates an example of the specific calculation.
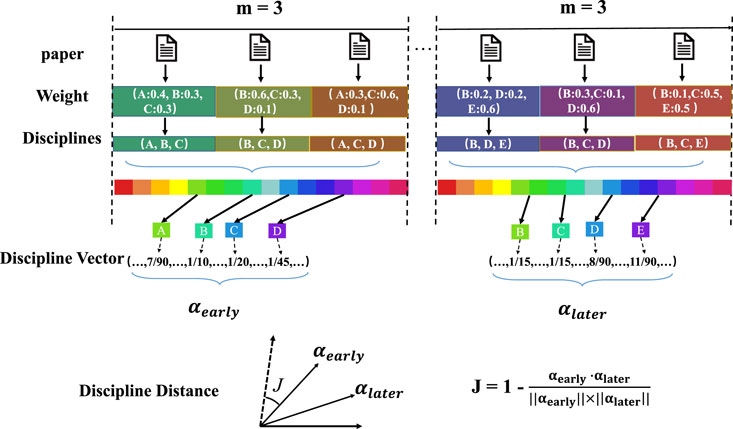
FIGURE 1. An example to calculate the interdisciplinary distance J(m = 3). The early careers’ discipline vector αearly and the later careers’ discipline vector αlater are generated based on the early and later m papers. Finally, the interdisciplinary distance J is measured according to the complementary cosine similarity between discipline vectors.
Different from correlation analysis, causal inference is not only based on correlation but also requires the temporal order of causality. Thus, correlation is only a necessary and insufficient condition for causal inference. In recent decades, causal inference has been dramatically applied in various fields, especially in finance [49] and education [50]. With the development of artificial intelligence [51–53], causal inference has new developments and applications [54, 55]. Currently, the most basic causal inference is to estimate the treatment effect by comparing the differences between the observation results of the control and treatment groups. the expected value of the treatment effect of all individuals receiving treatment, i.e., Average Treatment Effect on the Treated (ATT), can be defined as,
where Di = 1 means individual i is disposed,
where Yit is a measurement of the influence (citations) of scientist i. treati is a dummy variable for group membership and ɛit is the error term. If scientist i has interdisciplinary behavior, then scientist i belongs to the treated group, treati = 1; otherwise, treati = 0. periodt is a dummy variable for the period. Assume that the time for the interdisciplinary is t, and the observe time ti < t (|t − ti| < = 2), periodt = 0, otherwise periodt = 1. The composite variable treati × periodt is a dummy variable, indicating whether the individual of the treated group is in the treated period, and the coefficient β3 represents the treated effects for interdisciplinary behavior. It is worth noting that DID requires the treated and control group to be entirely in accord with the parallel trend assumption before the treatment, i.e., the influence of scientists should increase at the same rate, whatever in treated and control groups. In addition, even if the parallel trend assumption is satisfied, it is still necessary to control features that may affect scientists’ influence, e.g., the career years of the scientist, the number of cooperation scientists, and the total number of publications. Thus, this work investigates the relationship between interdisciplinary behavior and scientists’ influence by utilizing PSM-DID. PSM transforms multi-dimensional features into one-dimensional propensity scores through a functional relationship, and matches individuals in the treatment group with the control group according to the propensity score. Specifically, we select four observable features (covariates) for 2 years before and after scientists’ interdisciplinary behavior: 1) the total number of publications; 2) the total number of disciplines of the scientist; 3) the career ages of the scientist; 4) the number of collaborators in each paper. Then, we calculate the propensity score of each scientist and conduct the match. The result of PSM provides supporting evidence for the parallel trend assumption. Finally, we consider citations and whether the scientist has interdisciplinary behavior as dependent and independent variables, respectively, and evaluate the treated effects of the treated group by utilizing DID.
Another goal of this work is to quantify the causal relationship between interdisciplinary distance and scientists’ influence, i.e., the treated effect of continuous variables. However, the usual causal inference models allow only binary variables, i.e., the treated variable = 0 (1) in the control (treated). Thus, we consider utilizing the GPSM to evaluate the treated effect of interdisciplinary distance. GPSM is an extension of PSM and is widely used in many different fields, such as economics [64], education [65], and medicine [66]. Furthermore, compared with the PSM, GPSM inherits the core concept and has similar covariate balancing properties. The most significant advantage is that it breaks the PSM constraint that the treated variable only allows binary variables. We consider the relative citation growth rate in early and late careers as the quantification of scientists’ influence (dependent variable). The independent variable is the interdisciplinary distance, and covariates are consistent in PSM.
Papers play an essential role in academic society, it is interesting to investigate the influence caused by interdisciplinary behavior. To investigate this, our work considers 2 years as the observed time (ti) and 3 years as the citation period to explore the citations of different types of interdisciplinary papers. Figure 2 compares the evolution of citations for papers with different interdisciplinary types. Compared with papers published in the large discipline (Pl−l), papers published in the large across small discipline (Pl−s) receive lower average citations (pink dot) in each interval. However, the papers in the small across large discipline (Ps−l) receive more average citations (pink dot) than that in the small discipline (Ps−s). On the one hand, it may be caused by the different citation dynamics in the inter-discipline and a single discipline, i.e., interdisciplinary papers need more than 3 years to reach peak citations. On the other hand, the large discipline cross to the small discipline receives less recognition and attention, and peers agree more with papers of the small cross to the large discipline.
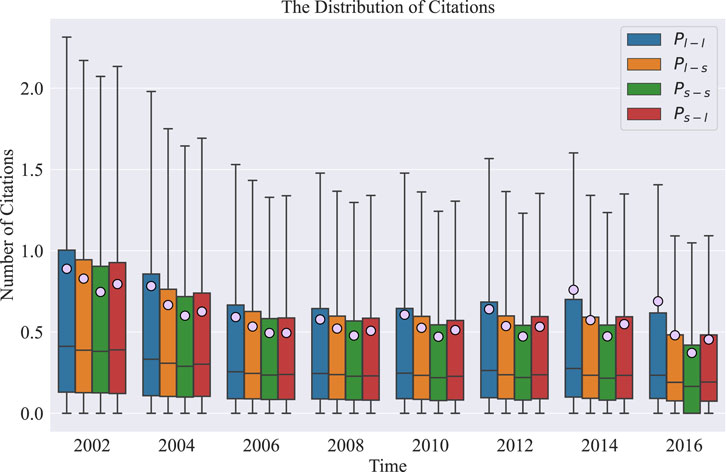
FIGURE 2. The evolution of citations of papers within different interdisciplinary types. We classify papers as the large discipline (blue box), the large across the small discipline (orange box), the small discipline (green box), and the small across large discipline (red box). The solid line and the pink dot in box represent the median and average number of citations, respectively.
In order to explore the underlying reasons for the different trends in the dynamic of papers with different types of interdisciplinary behaviors. We first investigate whether the interdisciplinary papers presented different citation dynamics from others by changing the citation period for papers. Figure 3 compares the citation period in three and 8 years in different disciplinary types. Papers published before 2008 are selected to avoid partial papers without 8 years citation period. When the citation period extends from 3 years (Figure 3A) to 8 years (Figure 3B), the citation of papers in the large cross the small discipline is less than that in the large disciplines, whatever three and eight citation period. Furthermore, citations of papers in the small cross the large discipline exhibit similar trends. This result indicates that the short- and long-term influence of interdisciplinary papers is similar to that of other papers, i.e., the increasing or decreasing of citations for interdisciplinary papers is irrelevant to the citation period. In particular, we further investigate the citation dynamics of papers in different disciplinary types published before 2008 in each year after publication. The average number of citation distribution is almost the same in different disciplines in Figure 4. We adopt the Z-test and Kolmogorov-Smirnov (K-S) test to examine distributions’ differences. Our null hypothesis is that the distribution of average citations of interdisciplinary papers is different from that of single-discipline papers. The result in Table 1 shows that P - value
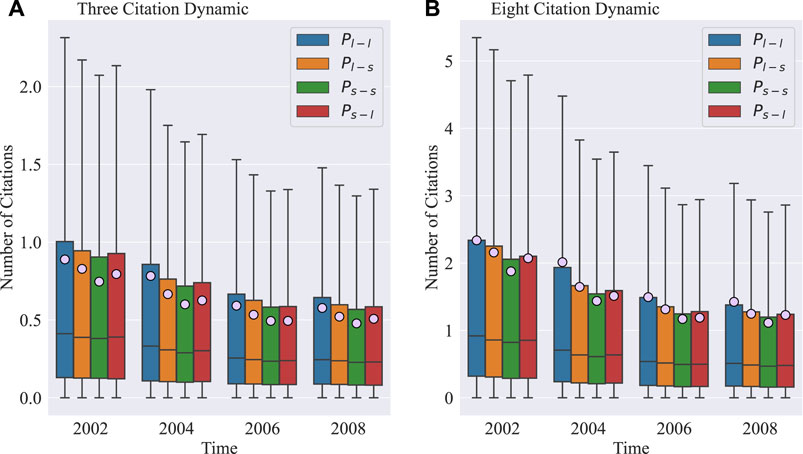
FIGURE 3. The evolution of citations of papers within different interdisciplinary types. We compare the number of citations with three (A) and eight (B) years citation period, and other elements are consistent with Figure 2.
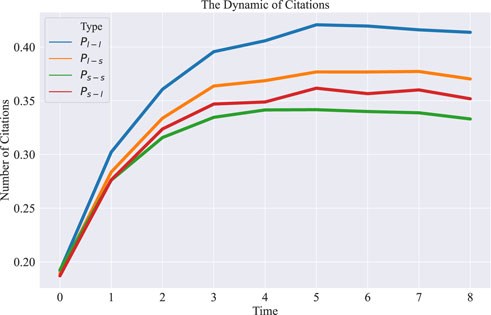
FIGURE 4. The dynamic of citations of papers for different interdisciplinary types. We select paper published before 2008, and calculate the average number of citations for different interdisciplinary types, i.e., the large discipline (blue line), the large across the small discipline (orange line), the small discipline (green line), and the small across large discipline (red line).
One possible reason for the different trends in the citation of different types of interdisciplinary papers is the different recognition of scientific outputs. We analyze the citation sources for the different types of interdisciplinary papers within 8 years after publication in Figure 5. The disciplines with the most cited papers published by the large discipline (Figure 5A) and the small discipline (Figure 5C) are the large discipline (44%–46%) and small disciplines (41%–51%), respectively. It indicates that papers without interdisciplinary behavior have been widely recognized in self-discipline. Papers published in Pl−s (Figure 5B) receive more citations in the same interdisciplinary type (32%–36%), while papers in Ps−l (Figure 5D) are cited most in the small discipline (28%–33%). Compered Figure 5C with Figure 5D, despite the proportion of citations in the small across large discipline having decreased in the small disciplines, the proportion is the highest in different disciplines, i.e., the initial disciplines (the small disciplines) tend to accept the scientific outputs in the small across large discipline.
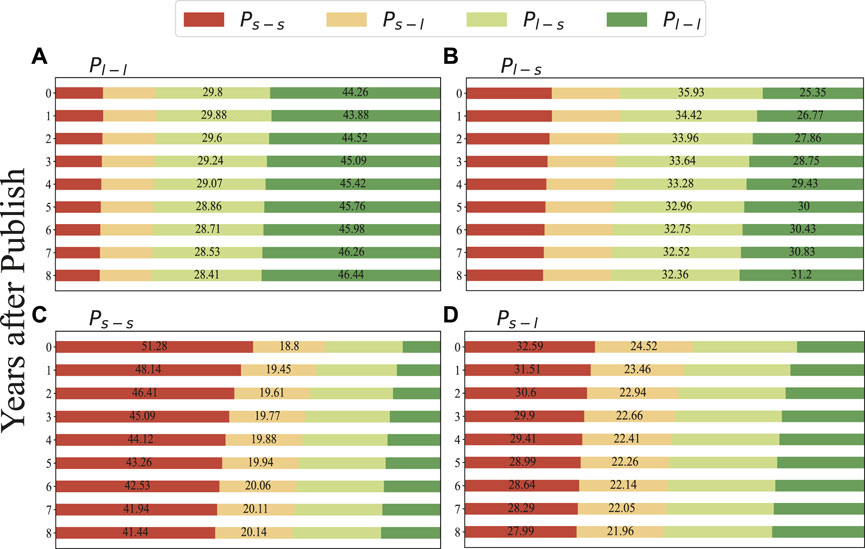
FIGURE 5. The citations attribution for different interdisciplinary types. We select the papers published after 2008, and the vertical axis represent the years after publish. The target disciplines are considered as the large discipline Pl−l (dark green column) across small discipline Pl−s (light green column), and the small Ps−s (red column) across large discipline Ps−l (pink column). (A) The large discipline (Pl−l). (B) The large across small discipline Pl−s. (C) The small discipline Ps−s. (D) The small across large discipline Ps−l.
We further explore the influence of interdisciplinary behavior on scientists. Specifically, according to the interdisciplinary types and attributing each paper to the first scientist, we can define an interdisciplinary type for the scientist, including the large discipline scientist (Sl−l), the large cross small discipline scientist (Sl−s), the small discipline scientists (Ss−s), and the small cross large discipline scientists (Ss−l).
Since the dynamic distribution of citations in interdisciplinary papers is similar to that in others (Figure 4), we consider citations received within 3 years after publication to measure the scientists’ influence. Figure 6 compares the citations of scientists in different interdisciplinary types. In total periods, the influence of scientists in the large across small discipline (Sl−s) is lower than that of scientists in the large discipline (Sl−l) except in 2000. A different phenomenon is that scientists in the small across large discipline (Ss−l) receive more positive impacts from interdisciplinary behaviors. This finding indicates that the risk of interdisciplinary behavior of large disciplinary scientists is more significant than the rewards. In contrast, scientists in small disciplines can enhance their influence through interdisciplinary behavior, which benefits the sustainable development of their careers.
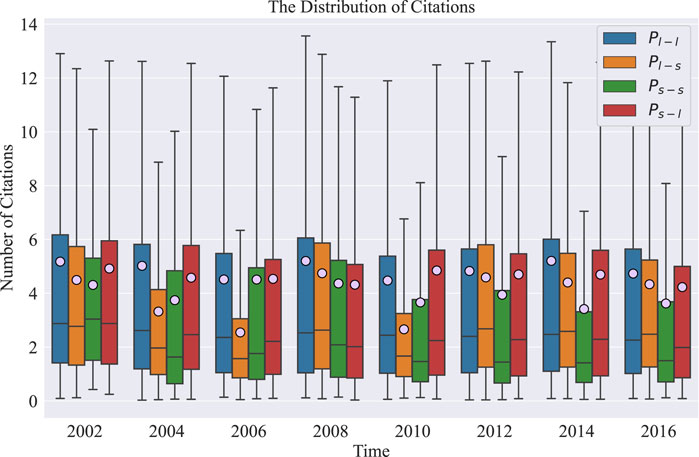
FIGURE 6. The evolution of citations for scientists within different interdisciplinary types. We classify scientists as the large discipline (blue box), the large across the small discipline (orange box), the small discipline (green box), and the small across large discipline (red box). The solid line and the pink dot in the box represent the median and the average number of citations for scientists, respectively.
Table 2 demonstrates the result of DID in the different interdisciplinary types. As shown in Table 2, the interdisciplinary behavior of scientists in Sl−s significantly reduces their influence, especially in 2004, nearly reduced 2.6 citations. However, scientists in Ss−l increase their influence on interdisciplinary behavior, and the most significant increase occurred in 2016, with an increase of about 7.2 citations. In general, our results exhibit a causal perspective for developing scientists’ careers, especially for scientists in the small discipline.
Interdisciplinary research is a tough career challenge for scientists, i.e., the trade-off between the new research field and influence [67]. Thus, the scientist may balance the risks and benefits of interdisciplinary behavior. To find out the “Sweet Spot” in the transition, this work further explores the relationship between interdisciplinary distance and scientists’ influence. Specifically, We consider J as the interdisciplinary distance and use the growth of citations to evaluate the scientists’ influence. The growth of citations is defined as Gc = (Cafter − Cbefore)/Cbefore, where Cafter and Cafter is the citations for scientists in early and later careers, respectively.
Figure 7 compares the relationship between inter-discipline distance J and the growth of citations. We find that both long and short inter-disciplinary distances limit scientists’ benefits and that only appropriate interdisciplinary distances could enhance the influence of scientists. Furthermore, the interdisciplinary also may introduce negative influence, which displays a uniform distribution (inserted figure in Figure 7), which indicates that inter-disciplinary behavior may reduce the influence of scientists, whatever the interdisciplinary distance. This phenomenon suggests that scientists need to bear the risks through interdisciplinary behavior and turn an appropriate interdisciplinary distance if they want to increase their influence.
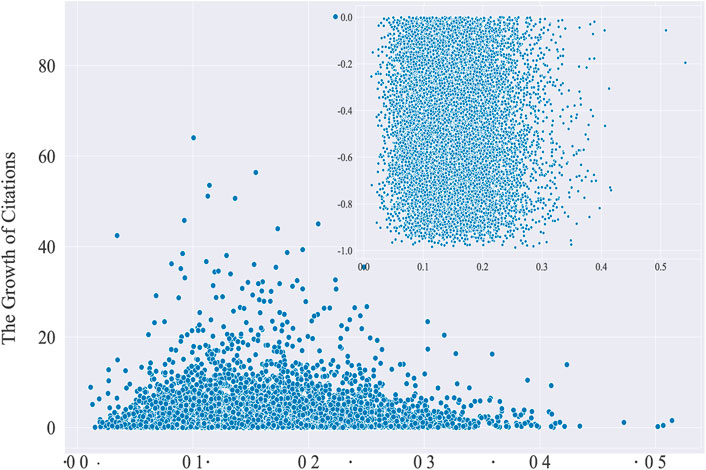
FIGURE 7. The distribution of citations’ growth for the interdisciplinary scientists. The blue dot is Gc for each scientist. The insert picture shows the negative growth for citations.
We further investigate the underlying relationship between interdisciplinary distance and scientists’ influence by utilizing GPSM. As shown in Figure 8, scientists’ influence increases have a non-monotonic behavior: it increases for small inter-disciplinary distances and decreases (i.e., J > 0.16) for large inter-disciplinary distances (i.e., J < 0.152). The result implies that interdisciplinary behavior is an effective way to enhance scientists’ influence. Furthermore, there exists a “Sweet spot” for the influence introduced by interdisciplinary behavior, that is, the interdisciplinary distance is 0.16.
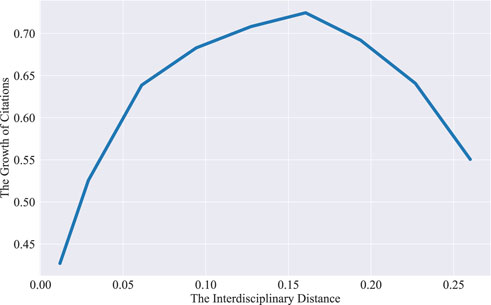
FIGURE 8. The evolution of treatment effect for GPSM. The blue line is the growth of citations Gc, which is the same as Figure 7. The horizontal and vertical axis represents the interdisciplinary distance and the growth of citations, respectively.
This work studies the underlying relationship between interdisciplinary and influence. By introducing the concept of the large and small disciplines, we first investigate the relationship between interdisciplinary behavior and citations. The results show that different types of interdisciplinary behaviors will have different effects on the citations, i.e., the citations of papers from the large discipline across the small discipline will decrease, and the opposite trend in the small discipline. Then, we find that papers of the large discipline across the small discipline have been high-cited in the same interdisciplinary type papers, while peers in the small discipline will widely accept the paper of the small across the large discipline. The analysis of the relationship between interdisciplinary behavior and scientists’ influence and the result of DID-PSM confirm this phenomenon. The previous study also confirmed that interdisciplinary research might have a high impact, but they may encounter challenges in collaboration and more obstacles in peer review [68]. Furthermore, the analysis of interdisciplinary distance and scientists’ influence finds that interdisciplinary behavior will bring risks, and there exists a “Sweet spot” for the influence introduced by interdisciplinary behavior. It is important for scientists to choose the appropriate interdisciplinary distance while undertaking the risks. The short interdisciplinary distance may lead to a low impact caused by the lack of novelty, and excessive interdisciplinary distance may lead scientists to work in entirely unfamiliar disciplines and descend the scientific influence. Furthermore, this work only considers the first author, i.e., the credit of the paper attributes to the first author. With the increase of the number of co-authors of each publication, the scientific credit system is also facing the pressure of development [69–71]. Our future work will find a more reasonable credit allocation method to further reveal the potential influence of interdisciplinary behavior. In general, causality is the focus of research in the future academic network. Our research introduced causal inference into practice in the academic field. This work analyzes the correlation between interdisciplinary behavior and scientists’ influence and reveals its potential impact mechanism by quantifying the causal relationship among them, which provides a new perspective for future related research in the academic field.
Publicly available datasets were analyzed in this study. This data can be found here: https://www.aminer.cn/citation.
CF and HL wrote the main manuscript text. CF and SY conceived the experiments. CF, XL, and HL conducted the experiments. All authors analyzed the results and reviewed the manuscript.
This work was supported by the National Natural Science Foundation of China under Grant (62103374) and the Basic Public Welfare Research Project of Zhejiang Province under Grant (LGF20F020016).
The authors declare that the research was conducted in the absence of any commercial or financial relationships that could be construed as a potential conflict of interest.
All claims expressed in this article are solely those of the authors and do not necessarily represent those of their affiliated organizations, or those of the publisher, the editors and the reviewers. Any product that may be evaluated in this article, or claim that may be made by its manufacturer, is not guaranteed or endorsed by the publisher.
1. Read EK, O’Rourke M, Hong GS, Hanson PC, Winslow LA, Crowley S, et al. Building the team for team science. Ecosphere (2016) 7:e01291. doi:10.1002/ecs2.1291
2. Stokols D, Misra S, Moser RP, Hall KL, Taylor BK. The ecology of team science: Understanding contextual influences on transdisciplinary collaboration. Am J Prev Med (2008) 35:S96–S115. S96–S115. doi:10.1016/j.amepre.2008.05.003
3. Barge JK, Shockley-Zalabak P. Engaged scholarship and the creation of useful organizational knowledge. J Appl Commun Res (2008) 36:251–65. doi:10.1080/00909880802172277
4. De Montjoye YA, Stopczynski A, Shmueli E, Pentland A, Lehmann S. The strength of the strongest ties in collaborative problem solving. Scientific Rep (2014) 4:5277–6. doi:10.1038/srep05277
5. Fiore SM. Interdisciplinarity as teamwork: How the science of teams can inform team science. Small Group Res (2008) 39:251–77. doi:10.1177/1046496408317797
6. Matthews NE, Cizauskas CA, Layton DS, Stamford L, Shapira P. Collaborating constructively for sustainable biotechnology. Scientific Rep (2019) 9:19033–15. doi:10.1038/s41598-019-54331-7
7. Gaff JG, Ratcliff JL. Handbook of the undergraduate curriculum: A comprehensive guide to the purposes, structures, practices, and change. Jossey-Bass Higher and Adult Education Series. ERIC (1997).
8. Chang YW, Huang MH. A study of the evolution of interdisciplinarity in library and information science: Using three bibliometric methods. J Am Soc Inf Sci Technol (2012) 63:22–33. doi:10.1002/asi.21649
9. Zhang L, Sun B, Chinchilla-Rodríguez Z, Chen L, Huang Y. Interdisciplinarity and collaboration: On the relationship between disciplinary diversity in departmental affiliations and reference lists. Scientometrics (2018) 117:271–91. doi:10.1007/s11192-018-2853-0
12. Wagner CS, Roessner JD, Bobb K, Klein JT, Boyack KW, Keyton J, et al. Approaches to understanding and measuring interdisciplinary scientific research (idr): A review of the literature. J Informetrics (2011) 5:14–26. doi:10.1016/j.joi.2010.06.004
13. Stirling A. A general framework for analysing diversity in science, technology and society. J R Soc Interf (2007) 4:707–19. doi:10.1098/rsif.2007.0213
14. Rafols I, Meyer M. Diversity and network coherence as indicators of interdisciplinarity: Case studies in bionanoscience. Scientometrics (2010) 82:263–87. doi:10.1007/s11192-009-0041-y
15. Hammarfelt B. Interdisciplinarity and the intellectual base of literature studies: Citation analysis of highly cited monographs. Scientometrics (2011) 86:705–25. doi:10.1007/s11192-010-0314-5
16. Porter A, Chubin D. An indicator of cross-disciplinary research. Scientometrics (1985) 8:161–76. doi:10.1007/bf02016934
17. Lyall C, Bruce A, Marsden W, Meagher L. The role of funding agencies in creating interdisciplinary knowledge. Sci Public Pol (2013) 40:62–71. doi:10.1093/scipol/scs121
18. Limoges C, Scott P, Schwartzman S, Nowotny H, Gibbons M. The new production of knowledge: The dynamics of science and research in contemporary societies. The New Prod Knowledge (1994) 1–192.
19. Stehr N, Weingart P. Practising interdisciplinarity. Toronto, ON: University of Toronto Press Inc (2000).
20. Frodeman R, Klein JT, Pacheco RCDS. The Oxford handbook of interdisciplinarity. Oxford: Oxford University Press (2017).
21. Porter AL, Roessner JD, Cohen AS, Perreault M. Interdisciplinary research: Meaning, metrics and nurture. Res Eval (2006) 15:187–96. doi:10.3152/147154406781775841
22. Woelert P, Millar V. The ‘paradox of interdisciplinarity’in Australian research governance. Higher Educ (2013) 66:755–67. doi:10.1007/s10734-013-9634-8
23. Bromham L, Dinnage R, Hua X. Interdisciplinary research has consistently lower funding success. Nature (2016) 534:684–7. doi:10.1038/nature18315
24. Sun Y, Livan G, Ma A, Latora V. Interdisciplinary researchers attain better performance in funding (2021). arXiv preprint arXiv:2104.13091.
25. Wang J, Thijs B, Glänzel W. Interdisciplinarity and impact: Distinct effects of variety, balance, and disparity. PloS one (2015) 10:e0127298. doi:10.1371/journal.pone.0127298
26. Sunahara AS, Perc M, Ribeiro HV. Association between productivity and journal impact across disciplines and career age. Phys Rev Res (2021) 3:033158. doi:10.1103/physrevresearch.3.033158
27. Yegros-Yegros A, Rafols I, D’este P. Does interdisciplinary research lead to higher citation impact? The different effect of proximal and distal interdisciplinarity. PloS one (2015) 10:e0135095. doi:10.1371/journal.pone.0135095
28. Rinia E, van Leeuwen T, van Raan A. Impact measures of interdisciplinary research in physics. Scientometrics (2002) 53:241–8. doi:10.1023/a:1014856625623
29. Larivière V, Gingras Y. On the relationship between interdisciplinarity and scientific impact. J Am Soc Inf Sci Technol (2010) 61:126–31. doi:10.1002/asi.21226
30. Uzzi B, Mukherjee S, Stringer M, Jones B. Atypical combinations and scientific impact. Science (2013) 342:468–72. doi:10.1126/science.1240474
31. Levitt JM, Thelwall M. Is multidisciplinary research more highly cited? A macrolevel study. J Am Soc Inf Sci Technol (2008) 59:1973–84. doi:10.1002/asi.20914
32. Larivière V, Haustein S, Börner K. Long-distance interdisciplinarity leads to higher scientific impact. Plos one (2015) 10:e0122565. doi:10.1371/journal.pone.0122565
33. Molaei S, Babaei S, Salehi M, Jalili M. Information spread and topic diffusion in heterogeneous information networks. Scientific Rep (2018) 8:9549–14. doi:10.1038/s41598-018-27385-2
34. Fronczak A, Mrowinski MJ, Fronczak P. Scientific success from the perspective of the strength of weak ties. Scientific Rep (2022) 12:5074–10. doi:10.1038/s41598-022-09118-8
35. Amjad T, Rehmat Y, Daud A, Abbasi RA. Scientific impact of an author and role of self-citations. Scientometrics (2020) 122:915–32. doi:10.1007/s11192-019-03334-2
36. Wan L, Zhang M, Li X, Sun L, Wang X, Liu K. Identification of important nodes in multilayer heterogeneous networks incorporating multirelational information. IEEE Trans Comput Soc Syst (2022) 9:1715–24. doi:10.1109/tcss.2022.3161305
37. Liu X, Wu K, Liu B, Qian R. Hnerec: Scientific collaborator recommendation model based on heterogeneous network embedding. Inf Process Manage (2023) 60:103253. doi:10.1016/j.ipm.2022.103253
38. Li Y, Wang R, Nan G, Li D, Li M. A personalized paper recommendation method considering diverse user preferences. Decis Support Syst (2021) 146:113546. doi:10.1016/j.dss.2021.113546
39. Wang RW, Ye FY. Simplifying weighted heterogeneous networks by extracting h-structure via s-degree. Scientific Rep (2019) 9:18819–8. doi:10.1038/s41598-019-55399-x
40. Siudem G, Żogała-Siudem B, Cena A, Gagolewski M. Three dimensions of scientific impact. Proc Natl Acad Sci (2020) 117:13896–900. doi:10.1073/pnas.2001064117
41. Mercorio F, Mezzanzanica M, Moscato V, Picariello A, Sperlí G. Dico: A graph-db framework for community detection on big scholarly data. IEEE Trans Emerging Top Comput (2019) 9:1987–2003. doi:10.1109/tetc.2019.2952765
42. Shakibian H, Moghadam Charkari N. Mutual information model for link prediction in heterogeneous complex networks. Scientific Rep (2017) 7:44981–16. doi:10.1038/srep44981
43. Bütün E, Kaya M, Alhajj R. A supervised learning method for prediction citation count of scientists in citation networks” in 2017 IEEE/ACM International Conference on Advances in Social Networks Analysis and Mining (ASONAM). IEEE (2017). p. 952.
44. Mo X, Tang R, Liu H. A relation-aware heterogeneous graph convolutional network for relationship prediction. Inf. Sci. (2022) 623:311–23. doi:10.1016/j.ins.2022.12.059
45. Tang J, Zhang J, Yao L, Li J, Zhang L, Su Z. Arnetminer: Extraction and mining of academic social networks. In: Proceedings of the 14th ACM SIGKDD international conference on Knowledge discovery and data mining (2008). p. 990.
46. Wang K, Shen Z, Huang C, Wu CH, Dong Y, Kanakia A. Microsoft academic graph: When experts are not enough. Quantitative Sci Stud (2020) 1:396–413. doi:10.1162/qss_a_00021
47. Radicchi F, Fortunato S, Castellano C. Universality of citation distributions: Toward an objective measure of scientific impact. Proc Natl Acad Sci (2008) 105:17268–72. doi:10.1073/pnas.0806977105
48. Jia T, Wang D, Szymanski BK. Quantifying patterns of research-interest evolution. Nat Hum Behav (2017) 1:0078–7. doi:10.1038/s41562-017-0078
49. Darrat AF. Are financial deepening and economic growth causally related? Another look at the evidence. Int Econ J (1999) 13:19–35. doi:10.1080/10168739900000002
50. Weiner B. 5: An attributional approach for educational psychology. Rev Res Educ (1976) 4:179–209. doi:10.2307/1167116
51. Fu C, Xia Y, Yue X, Yu S, Min Y, Zhang Q, et al. A novel spatiotemporal behavior-enabled random walk strategy on online social platforms. IEEE Trans Comput Soc Syst (2021) 9:807–17. doi:10.1109/tcss.2021.3105381
52. Fu C, Zhao M, Fan L, Chen X, Chen J, Wu Z, et al. Link weight prediction using supervised learning methods and its application to yelp layered network. IEEE Trans Knowledge Data Eng (2018) 30:1507–18. doi:10.1109/tkde.2018.2801854
53. Fu C, Zheng Y, Liu Y, Xuan Q, Chen G. Nes-tl: Network embedding similarity-based transfer learning. IEEE Trans Netw Sci Eng (2019) 7:1607–18. doi:10.1109/tnse.2019.2942341
54. Schwab P, Miladinovic D, Karlen W. Granger-causal attentive mixtures of experts: Learning important features with neural networks. Proc AAAI Conf Artif Intelligence (2019) 33:4846–53. doi:10.1609/aaai.v33i01.33014846
55. Madumal P, Miller T, Sonenberg L, Vetere F. Explainable reinforcement learning through a causal lens. Proc AAAI Conf Artif intelligence (2020) 34:2493–500. doi:10.1609/aaai.v34i03.5631
56. Yao L, Chu Z, Li S, Li Y, Gao J, Zhang A. A survey on causal inference. ACM Trans Knowledge Discov Data (Tkdd) (2021) 15:1–46.
57. Abadie A. Semiparametric difference-in-differences estimators. Rev Econ Stud (2005) 72:1–19. doi:10.1111/0034-6527.00321
58. Granger CW. Investigating causal relations by econometric models and cross-spectral methods. Econometrica: J Econometric Soc (1969) 37:424–38. doi:10.2307/1912791
59. Rosenbaum PR, Rubin DB. The central role of the propensity score in observational studies for causal effects. Biometrika (1983) 70:41–55. doi:10.1093/biomet/70.1.41
60. Hirano K, Imbens GW. The propensity score with continuous treatments. Appl Bayesian Model causal inference incomplete-data Perspect (2004) 226164:73–84. doi:10.1002/0470090456.ch7
62. Thistlethwaite DL, Campbell DT. Regression-discontinuity analysis: An alternative to the ex post facto experiment. J Educ Psychol (1960) 51:309–17. doi:10.1037/h0044319
64. Dai X, Cheng L. The effect of public subsidies on corporate r&d investment: An application of the generalized propensity score. Technol Forecast Soc Change (2015) 90:410–9. doi:10.1016/j.techfore.2014.04.014
65. Doyle WR. Effect of increased academic momentum on transfer rates: An application of the generalized propensity score. Econ Educ Rev (2011) 30:191–200. doi:10.1016/j.econedurev.2010.08.004
66. McCaffrey DF, Griffin BA, Almirall D, Slaughter ME, Ramchand R, Burgette LF. A tutorial on propensity score estimation for multiple treatments using generalized boosted models. Stat Med (2013) 32:3388–414. doi:10.1002/sim.5753
67. Funk RJ, Owen-Smith J. A dynamic network measure of technological change. Manage Sci (2017) 63:791–817. doi:10.1287/mnsc.2015.2366
68. Leahey E, Beckman CM, Stanko TL. Prominent but less productive: The impact of interdisciplinarity on scientists’ research. Administrative Sci Q (2017) 62:105–39. doi:10.1177/0001839216665364
69. Hodge SE, Greenberg DA. Publication credit. Science (1981) 213:950–2. doi:10.1126/science.213.4511.950.c
70. Kennedy D. Multiple authors, multiple problems. Science (2003) 301(2003):733. doi:10.1126/science.301.5634.733
Keywords: interdisciplinary behavior, scientific influence, large and small disciplines, interdisciplinary distance, causal inference
Citation: Fu C, Luo H, Liang X and Yu S (2023) The profit and risk in the interdisciplinary behavior. Front. Phys. 11:1107446. doi: 10.3389/fphy.2023.1107446
Received: 24 November 2022; Accepted: 09 January 2023;
Published: 19 January 2023.
Edited by:
Ye Wu, Beijing Normal University, ChinaReviewed by:
Peng Ji, Fudan University, ChinaCopyright © 2023 Fu, Luo, Liang and Yu. This is an open-access article distributed under the terms of the Creative Commons Attribution License (CC BY). The use, distribution or reproduction in other forums is permitted, provided the original author(s) and the copyright owner(s) are credited and that the original publication in this journal is cited, in accordance with accepted academic practice. No use, distribution or reproduction is permitted which does not comply with these terms.
*Correspondence: Chenbo Fu , Y2JmdUB6anV0LmVkdS5jbg==; Shanqing Yu, eXVzaGFucWluZ0B6anV0LmVkdS5jbg==
Disclaimer: All claims expressed in this article are solely those of the authors and do not necessarily represent those of their affiliated organizations, or those of the publisher, the editors and the reviewers. Any product that may be evaluated in this article or claim that may be made by its manufacturer is not guaranteed or endorsed by the publisher.
Research integrity at Frontiers

Learn more about the work of our research integrity team to safeguard the quality of each article we publish.