 Jiansheng Li
 Jin Zhang
- Equipment management and maintenance center, Shanxi Bethune Hospital, Taiyuan, Shanxi, China
Introduction: Medical equipment is an indispensable part of hospitals. It is the basic condition and guarantee for the hospital to carry out medical services, scientific research, teaching, and other activities, and it plays an irreplaceable role in the entire medical process of the hospital. Therefore, the maintenance management of equipment is also the focus of our attention. In the past, traditional management methods such as paper were mainly used for equipment maintenance management, and it was difficult to share data.
Methods: In today’s era of rapid development of information technology, we will use information technology to maintain and manage medical equipment. Through big data analysis and other technologies, the drawbacks of the existing traditional management methods are improved, so that medical equipment can be managed scientifically. By maximizing its functions, it can ensure the normal operation of medical facilities, improve the utilization rate and integrity rate of equipment, and reduce maintenance costs and unnecessary losses.
Results: According to the research findings, based on the background of big data, a de-Bayesian network is used for data mining to build a medical equipment maintenance platform. Through the data in the platform, we can better discover the distribution and reasons of equipment maintenance, and at the same time conduct an analysis to provide reference for the formulation of preventive maintenance plans, reduce equipment failure rate and maintenance costs and improve equipment utilization. Through the survey of medical staff, we can also find that at least 40% of the people feel that the work distribution is more reasonable, and 45% of the people feel that the equipment failure rate and the time required for maintenance have been greatly reduced.
Discussion: We can see that the network platform for medical equipment maintenance management built through big data is very feasible, which can help us work more effectively and improve work efficiency.
1 Introduction
Whether from the perspective of the hospital or the patient, the maintenance and management of medical equipment is an important part of the hospital. Only by doing a good job in the maintenance and management of medical equipment can we avoid medical accidents caused by faulty equipment, improve the utilization and availability of equipment, and reduce certain operating costs, which has important practical significance and value for the smooth progress of medical diagnosis and treatment. With the development of science and technology, medical equipment has become increasingly advanced. It is no longer purely automated and mechanized, but more and more refined and integrated, which increases the difficulty of maintenance management in some aspects. Therefore, the current equipment maintenance work is not only to simply replace parts, but also to manage the basic situation and maintenance information of the equipment. Our traditional management method is through paper or electronic documents. It mainly depends on the execution of the system, process and relevant personnel. This way, there are a large number of uncontrollable factors, which make it difficult to share information, and it is difficult to achieve scientific and refined management. With the continuous development of science and technology, the use of big data for in-depth mining and analysis, intelligent auxiliary decision-making can better implement the maintenance and management of medical devices. This improves the hospital’s medical quality and safety, thereby improving the hospital’s asset management capabilities and solving the problem of medical device asset management. It provides convenience for medical workers and maintenance personnel.
For the maintenance of medical equipment, foreign experts also have a lot of research. Lu H has established a quality evaluation index system for ultrasonic diagnostic equipment through research, to improve the quality of after-sales service of medical equipment and improve the quality of medical equipment maintenance [1]. Moura M DC proposed a model to analyze the interaction between hospitals and OEMs. They believed that OEMs can provide maintenance services for two different types of hospitals. These hospitals have the option to hire an Extended Warranty (EW) or pay for each maintenance intervention as needed, regardless of p Ref. [2]. Yu H mainly used goodness-of-fit tests as well as linear regression methods. He constructed a three-level failure time distribution model to discuss the content, methods, and characteristics of medical electrical equipment operation and maintenance data collection, as well as the establishment and evaluation method of medical electrical equipment failure time distribution model. These include the failure rate distribution model of key parts, the equipment-level MTBF distribution model, and the calculation model of the influence factors of key part failure modes [3]. Rivas R A showed that medical devices have a key role in the prevention, diagnosis, treatment, and recovery of disease. Therefore, the use of computer systems and software to maintain and manage medical equipment and control related costs has been the next direction of development [4].
Today, we are in an era where the Internet is very developed. The research of big data in various aspects is increasingly common and penetrates into every corner of life, so it is possible for us to build a platform through big data for the maintenance of medical equipment. From the data, we can see that Li V proposed that individualized air pollution exposure can be estimated with the help of big data and artificial intelligence technology. He synchronized it with activity, health, quality of life, and behavioral data and provided real-time, personalized and interactive alerts and recommendations to improve the health and wellbeing of individual citizens [5]. Zhang Y proposed that financial management based on the big data platform can improve the management level and efficiency of enterprises, strengthen the risk control of financial management, and at the same time bring a valuable decision-making basis for enterprises [6]. Narayanan M studied the relationship between big data and the growth of the smart aviation industry. It is found that aviation big data plays a key role in the development of the intelligent aviation industry. The creation of aviation big data information platforms and information systems, as well as the use of multilayer network-related analysis methods, will significantly improve the safety and efficiency of aircraft [7]. The main focus of Ullah S’s research was how to classify the major big data resource management systems in the cloud computing environment. It can analyze large amounts of data from multiple sources to help companies plan for the future, predict market dynamics and customer needs [8].
When the platform is built, compared with the previous traditional management methods, we can find that we can view and compare various maintenance data more intuitively. Statistical analysis can also be made better for various maintenance reasons, and the work arrangement of most personnel is more reasonable. Therefore, it is very feasible to build a network management platform for medical equipment maintenance through big data.
2 Big data and data mining
2.1 Overview of big data
Big data originated from the in-depth research and development of data mining. At first, people did not have a clear and specific definition of big data. With the deepening of research, researchers in different fields have put forward their own knowledge and understanding of big data in the exploration [9]. In essence, big data is a massive amount of data and information, an information resource, which has the functions of decision-making, insight and process optimization. At the same time, distributed technology is generally used for the analysis of big data, and users can realize multinode parallel operation of analysis programs without in-depth understanding of the underlying layer [10]. Therefore, big data adopts a new architectural model to cope with the current processing needs of massive, high-growth and diverse data streams. According to the interpretation of scholars, big data is actually a survival activity for people. It includes major innovations in work, life, and thinking. He summarized the impact of big data from various perspectives such as business and education, and fully explained the impact and role of big data in modern society. Therefore, with the development of the Internet, the emergence of big data has brought us into a new era.
2.2 Data mining
Data mining, also known as “knowledge discovery”, refers to a discipline that extracts valuable data from massive data in a data warehouse and performs knowledge extraction [11]. The discipline involves fields such as statistics, pattern recognition, and expert systems. Its function is to provide qualitative analysis and data support for intelligent decision-making through the extraction of implicit information from massive random data. The general mining process is shown in Figure 1 below [12].
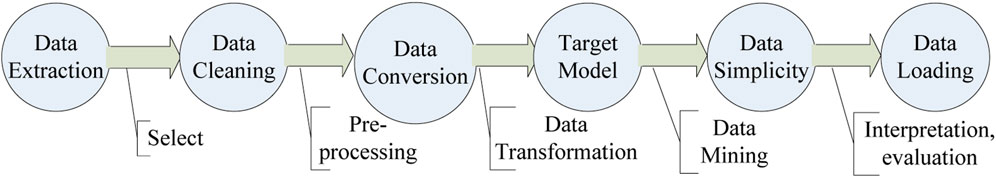
FIGURE 1. The general process of data mining.
Common data mining algorithms mainly include the following: decision trees, association rules, neural networks, clustering, and Bayesian networks. We mainly used the Bayesian network algorithm, so we will introduce it in detail next.
2.3 Bayesian networks
Bayesian Network (BN) is a diagram used to describe the uncertainty relationship between variables [13]. Using graphical methods to describe the relationship between data makes the semantics clear. Moreover, it is easy to maintain the consistency and integrity of the probabilistic knowledge base, and it is convenient to reconfigure the network module according to the change of conditions. It has two parts: structural model and conditional probability distribution. A directed acyclic graph is a structural model. In the graph, an edge represents a direct conditional dependency between two variables connected to it. The node represents a random variable, which is a feature about entities such as processes, events, and states [14]. Dependencies are represented by probability distributions connected to each node, where the root node X is attached to its marginal distribution P(X), and the non-root nodes are attached to the conditional probability distribution. A complete BN is shown in Figure 2 below:
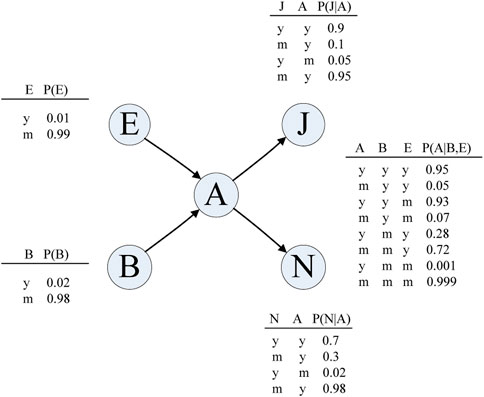
FIGURE 2. Complete BN diagram.
Bayesian networks are a combination of graph theory and probability theory. On the one hand, it describes the structure of the problem in the form of graph theory, and on the other hand, according to the principle of probability, it uses the structural relationship of the problem to reduce the complexity of the operation.
Through the learning of Bayesian network, the best network architecture can be obtained in accordance with the data set, and the network structure reflects the potential relationship between the attributes of the data set. In this study, the Bayesian network model can well describe the dependencies between potential data attributes in the medical equipment maintenance dataset, thereby discovering the key factors affecting the management of medical equipment maintenance. It enables the equipment to be serviced at the optimum time.
The Bayesian network structure is developed using an optimal mode of joint probability. Its model can be well used for prediction. If the target attributes in the attribute set are analyzed, too many redundant items in the construction process are retained. Moreover, the Bayesian network is prone to overfitting to the data during the learning process. In a Bayesian network, the Markov blanket will mask the relationship between other variables and the predicted variable, making its structure more concise. It also contains all associated properties of the target variable.
In Bayesian network,
Among them, when
2.4 Bayesian network learning
The learning of Bayesian networks is divided into two aspects: parameter learning and structure learning [15]. Parameter learning refers to the learning of the state probability table for the nodes in the network structure, which can better represent the probability distribution of each node in the network structure [16]. Maximum likelihood estimation and Bayesian estimation are the two most commonly used methods. Structure learning is to effectively use the sample database to select a Bayesian network structure that is most suitable for the research object, that is, to find a network that can match a given instance data set according to a certain metric. Dependency analysis-based and score-based search are two main types of structure learning methods at present. Parameter learning and structure learning are generally carried out sequentially, and then in the process of construction, they will generally have an impact on two aspects: on the one hand, in order to achieve sufficient accuracy, it is necessary to build a large and rich network model; on the other hand, the cost of building and maintaining the model and the complexity of probabilistic reasoning should be considered. Generally speaking, the complexity of probabilistic reasoning for complex model structures is also high, which often affects the quality of Bayesian learning.
2.4.1 Maximum likelihood estimation method
The maximum likelihood estimation method uses the similarity between the parameters and the data set to select, and the selected estimated value is generally the parameter value at the maximum value [17]. The general form of the likelihood function is given by the following formula:
In order to facilitate the calculation, the logarithm is usually taken, that is, the formula is as follows:
Selecting the parameter
Among them:
A conditional probability table of the Bayesian network can be obtained through the formula. However, when there is not enough data, there will be a large deviation, so the maximum likelihood estimation is not suitable for all Bayesian networks, but the Bayesian algorithm can solve this problem well.
2.4.2 Bayesian estimation method
Bayesian algorithms are based on Bayesian learning theory. Its core idea is the cognition of uncertainty, and its uncertainty depends on people’s subjective consciousness and objective observation [18]. Therefore, the Bayesian method treats the measured parameter as a random variable and considers the influence of background and prior probability, so that the accuracy of Bayesian estimation is higher than that of maximum likelihood estimation. The prior probability in the original Bayesian theorem is not based on any observation on the surface, but is actually based on all observations in history. The background and prior probability reflect the background knowledge about the correct assumption opportunities. The posterior of each time will become the prior of the next time.
In Bayesian estimation, the random variable is the parameter
To facilitate the solution, p(θ) is based on the following three assumptions:
1. Global parameter independence: the parameters corresponding to any variable Xi in the network are independent of each other;
2. Local parameter independence: given the variable Xi, the parameters corresponding to the parent node
3.
In summary, it can be deduced that
Among them,
2.4.3 Methods based on dependency
Because the method based on dependency testing is intuitive and close to the semantics of Bayesian networks, the use of independent conditional testing to build networks can ensure the efficiency and accuracy of modeling. Therefore, the conditional independence test is used to establish the network structure. Currently, the commonly used test methods are X2 test and mutual information test. This method has the advantages of fast operation speed and fast learning speed, but the accuracy of the learned network model is not high. Moreover, the number of independent tests increases exponentially with the number of variables, so it is only suitable for network learning with a simple structure [19]. The formula of mutual information test method is as follows:
It can be seen from the above formula that
2.4.4 Scoring-based search method
The BN structure is constructed by scoring criteria and heuristic search algorithm in the structure space composed of nodes, and its accuracy is higher than that of dependency analysis method. The formula M* of the network model with the largest posterior probability is as follows, where
The prior probability
A typical representative is the K2 algorithm, which is a structure learning method based on CH score and greedy search. In application, it is necessary to consider the defining variables and their composition, and determine all possible states or weights of variables. At the same time, factors such as the fusion of prior knowledge, the selection of evaluation function, and the influence of incomplete data should be considered. Expand the edge likelihood function in the above formula to get
Determine M, and the prior distribution of each node parameter adopts Dirichlet distribution, then there is
The parameters of the network θijz = P(Xi = z|
Taking the logarithm of both sides of the equal sign above, we get
The right side of the equal sign in the above formula is the CH score, and the following formula is the family score function of CH:
The right side of the equal sign in the above formula is the CH score, and the following formula is the family score function of CH:
To sum up, maximizing the posterior probability P(M|D) is finally transformed into solving the likelihood function P(D|M). Since the prior probability P(M) is assumed to obey a uniform distribution, it is regarded as a constant and is not considered in the calculation process. The characteristics of scoring function mainly include three aspects: strong reliability, stability, and adaptability. The reliability lies in that more accurate factors can be used to search, its stability lies in that it is not easily affected and interfered by the scene environment, and its adaptability lies in that there are many factors to choose.
2.5 Markov blanket
A Markov blanket is a minimal subset of features that satisfy the following characteristics. Under its state, the feature is independent of other feature states [20]. The representation of Markov cover feature in Bayesian network is the parent node, child node, and parent node of child node. Assuming that the Markov blanket of feature T is
X is all non-Markov blanket nodes in the feature domain.
The key to the Bayesian network of the Markov blanket is to construct the Bayesian network structure, which can be determined by the structure of the Bayesian network. By discovering the change trend of the Markov blanket in different Bayesian network models, we can determine the trend of old and bad medical equipment.
3 Construction of medical equipment maintenance management platform
3.1 Equipment maintenance management
Equipment maintenance management refers to the equipment involved in the production or business activities of the enterprise or unit according to the production and business target plan. Its fundamental purpose is to ensure the normal use and necessary work quality of medical equipment, and ultimately to improve the service life of the equipment. The comprehensive management work was carried out by taking relevant measures to keep all material movement forms and value movement forms in a good state during its life cycle. The equipment maintenance system can be divided into four stages: post-event maintenance, preventive maintenance, condition maintenance, and intelligent maintenance.
The high frequency of medical equipment maintenance will affect the work of clinical departments, surgery scheduling, and medical quality. The specific data of maintenance in the operating room are shown in Table 1.
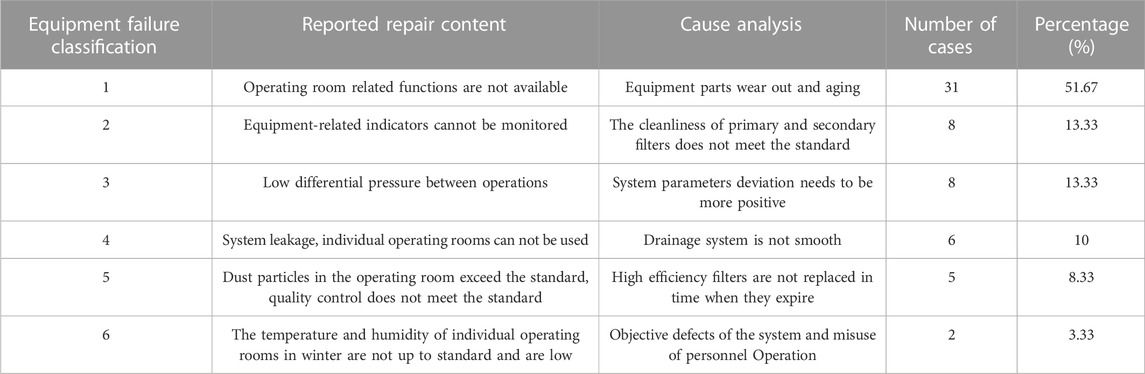
TABLE 1. Recent maintenance statistics of the operating room.
In terms of medical equipment maintenance management, the hospital has not formed a systematic management plan, and the equipment maintenance management has not been standardized due to the traditional management methods adopted by the hospital and the shortage of management personnel. As a result, medical equipment cannot be used efficiently and its production efficiency can be maximized, and there are still many problems. According to the information reviewed, the following problems can be found and concluded: incomplete asset ledger, incomplete life cycle management of equipment, incomplete maintenance data, unscientific management of engineers, unstandardized maintenance management of measuring equipment, untimely preventive maintenance, maintenance and procurement are disconnected, etc.
The current equipment maintenance method adopted by the hospital is complicated. Due to the use of paper application forms, the maintenance response time is greatly prolonged. More time is spent on filling in, handing over, and searching for application forms, resulting in reduced maintenance efficiency. On the flip side, a lot of repair information is recorded on the same paper application form. Once lost, it is difficult to retrieve, causing a lot of trouble for maintenance. Paper data records are also not easy to find. With the increase of application forms, the storage and management of these application forms is a major problem faced by the equipment department. The establishment of a maintenance management information system and the realization of information management can solve this problem to a great extent. The connectivity between systems and the sharing of data can enable clinical departments and equipment departments to send and receive information directly through the network system, reducing response time. At the same time, the large storage function of the network also brings convenience to the management of the equipment department. At the same time, combined with big data analysis, the status of the equipment can be more effectively understood, and preventive maintenance can be made in time.
3.2 B/S architecture
In today’s era, the development of system software mainly has two structures, C/S structure and B/S structure. We use B/S structure to build a medical equipment maintenance management platform.
B/S is the abbreviation of Browser/Server. The server requires large databases such as Oracle and Mysql to store data. The client only needs to install a browser, the user accesses the website by entering the address in the browser, and the browser interacts with the server through the webserver, to achieve the purpose of data request. B/S is an improvement to C/S, which transfers the transaction logic processing of the C/S model client to the web server, but it also increases the data load of the application server. With the increase of server load, you can smoothly increase the number of servers and establish a cluster server system, and then balance the load among the servers to better control the platform.
Compared with the C/S architecture, the B/S architecture has the characteristics of high security, good real-time performance, fast response, low cost, and good scalability.
The B/S architecture model is shown in Figure 3 below. First, the user (ie, client) can establish a connection with the web server through a browser request. If the correct information is entered in the URL, the browser can establish a connection with the web server over the Internet. Then the web server obtains the corresponding data from the database server according to the request input by the user, and then feeds it back to the user in the form of a web page.
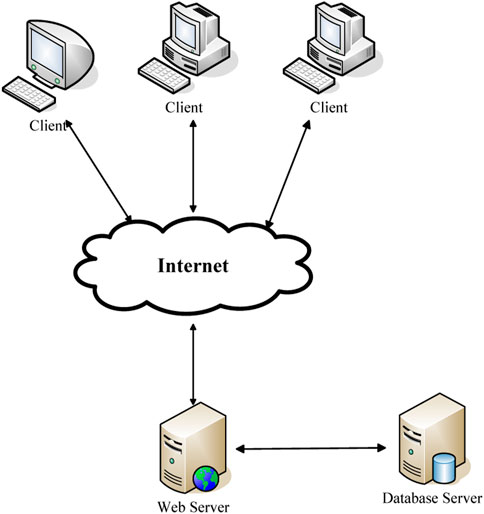
FIGURE 3. B/S architecture model.
3.3 Information maintenance management process
On the basis of the original equipment maintenance management process, according to the needs of information management, the equipment maintenance management process is improved to make it more standardized and perfect, which can well coordinate the equipment maintenance management after informationization. Most of the operations of the information-based maintenance management process can be implemented in the information-based management system, improving management efficiency and reducing maintenance management costs. In addition, the information-based maintenance management platform can display the equipment maintenance status more intuitively and accurately. The management personnel inside the platform can view and understand the status of medical equipment at any time. From the perspective of daily maintenance and fault handling, it has a more reasonable real-time. The information maintenance management process is shown in Figure 4:
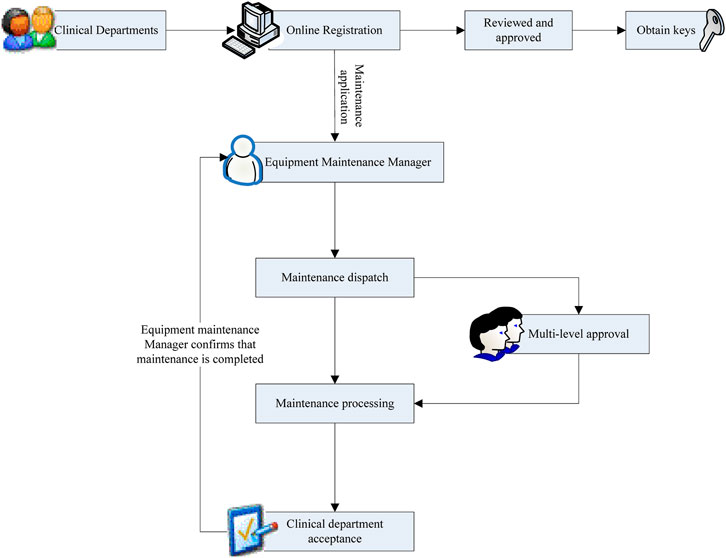
FIGURE 4. Equipment maintenance management process.
3.4 Preventive maintenance
According to the research, we can assume that there is a defect in (0, T) time in the simple preventive maintenance formula, and the time delay of the defect is in (h, h + ds) time, and the occurrence rate is f(h)ds. From this we get the following formula:
If the defect occurs within (0, T-h) time, the defect will gradually change into a failure, the failure will cause the machine to stop production, and the equipment will be repaired, and vice versa. The probability of defects appearing during (0,T-h) can be obtained by the following formula
It is known from the assumptions that
The average downtime is Nf, and the defect rate is assumed to be k. The data of the expected value of the number of failures in the (0, T) period can be obtained by the following formula:
3.5 Significance of construction of medical equipment maintenance platform
3.5.1 Improve the efficiency of medical equipment maintenance management
In the event of a malfunction during equipment use, the measures previously taken are as follows. The equipment operator shall call the equipment department, fill in the “Hospital Equipment Maintenance List” in detail, and send it to the equipment maintenance department for random processing by the instrument engineer. After the equipment maintenance department receives the order, the equipment maintenance manager and engineer go to the maintenance department to check the equipment, repair it by themselves, or find someone to repair it. After the maintenance, the maintenance personnel fill in the maintenance information. The feedback information is filled in by the department and finally approved by the competent department and handed over to the equipment section for safekeeping. During the whole maintenance period, all equipment maintenance information is filled in by a document on the same paper, and it is required to be kept from the time of application for repair until the end of the repair, and it will be archived after being approved by the administrator. If the application form is lost, it must be refilled. The maintenance application form is filled out by the staff of various departments, and these are submitted by special people, which not only increases the labor cost, but also prolongs the maintenance time.
After using the information management system, the maintenance staff of the clinical department and the equipment department can complete most of the work only in their respective computer systems. When the medical equipment in the clinical department fails, the supervisor can log in to the system, enter the information related to the faulty equipment according to the prompts on the equipment repair page, and submit it to complete the repair work. The maintenance staff of the hospital equipment department will receive the prompt information for two types of medical equipment repairs for the first time. One is the prompt of the “To be repaired” task bar in the system interface of the maintenance staff. On the other hand, the mobile phone of the maintenance staff will receive a short message of the relevant repair task. The timely repair information reminder is convenient for the maintenance engineer to go to the clinical department for maintenance and processing according to the maintenance process. After the maintenance is completed, the engineer responsible for the maintenance will record the work in detail in the management system. After the submission, the clinical department can immediately see the maintenance information and give feedback. After confirmation, the maintenance task is completed. The filling and feedback of maintenance information can be filled in through the system, eliminating unnecessary intermediate links.
3.5.2 Implement preventive maintenance management
Preventive maintenance refers to all kinds of maintenance activities carried out before the occurrence of a fault to find fault symptoms or prevent the occurrence of a fault and keep it in a specified functional state through the inspection and detection of equipment for preventing faults. Preventive maintenance of medical equipment is a form of proactive maintenance. It is to repair the fragile and vulnerable parts of the equipment when the equipment can still be used normally, and it includes periodic maintenance of the equipment. Hospitals rarely perform preventive maintenance before informatization. Only when the equipment is inspected irregularly, the equipment maintenance engineer decides whether to carry out the maintenance or not according to his own experience. Due to the lack of mastery of equipment life cycle data, it is difficult for engineers to make preventive maintenance plans, and every maintenance of equipment failures is recorded. There is no specialized personnel to organize, classify, and summarize the records of paper documents.
Before the informatization, the hospital hardly carried out preventive maintenance, but when the equipment was inspected irregularly, the equipment maintenance engineer decided whether to carry out the maintenance or not based on his own experience. With the information management method, when the medical equipment is purchased and put into storage, the relevant management engineers need to enter the relevant information of the equipment in the system. The information system will automatically generate the preventive maintenance cycle and project content of the equipment and give them to the corresponding clinical users and maintenance managers. This task is not completed until it is confirmed by both sides of the user management, which also ensures that the preventive maintenance can be actually completed. The information management platform can also facilitate scientific and rigorous management by managers and use scientific management mode in the whole management process to reduce equipment maintenance costs and conduct comprehensive maintenance in a scientific way.
4 Data of medical equipment maintenance platform
This section will mainly analyze the data generated by the monitor maintenance under the big data-based medical equipment maintenance platform. Through the analysis of these data, it can provide reference for the formulation of preventive maintenance plans, reduce equipment failure rate and maintenance costs, and improve the utilization rate of instruments.
The first is the statistics of monitor maintenance in the fourth quarter, as shown in Figure 5 below:
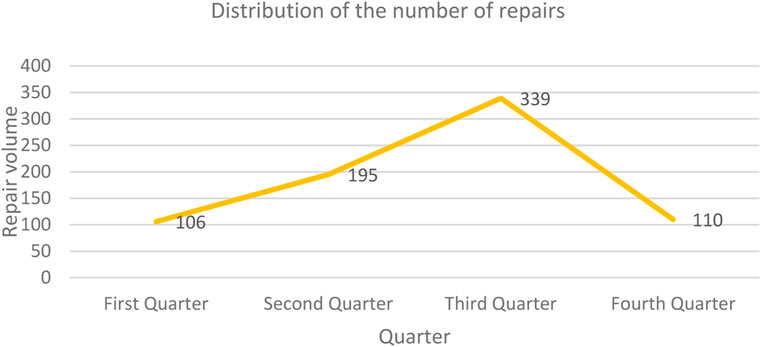
FIGURE 5. Distribution of monitor repair volume in four-quarters.
It can be seen that the maintenance volume in the second and third quarters is relatively large. After analysis, the reasons are as follows: First, the weather in the second quarter gradually increased and was relatively humid, which caused the monitor to heat up seriously. This in turn causes the power supply and other modules to overheat and fail. At the same time, patients sweat a lot in summer, and the sweat of patients who are in the monitoring environment for a long time will cause damage to the accessories of the monitor. Based on the above analysis, we should carry out key preventive maintenance work on the monitor in the second and third quarters, especially strengthening the cleaning of the monitor’s cooling components (fans) and internal dust before the weather is about to become hot in the second quarter. At the same time, it is necessary to inform the nursing staff of the department to strengthen the cleaning work when using the monitor on the patient.
Monitors are the most widely used medical equipment in clinical practice, and the number and frequency of use vary from department to department. In the case of a limited number of engineers in the medical engineering department, how to use the department scientifically and efficiently is particularly important. The statistical chart of monitored maintenance between some departments in the hospital is shown in Figure 6 below. From the figure, we can see that the surgical department has more maintenance, while the internal medicine department has less maintenance.
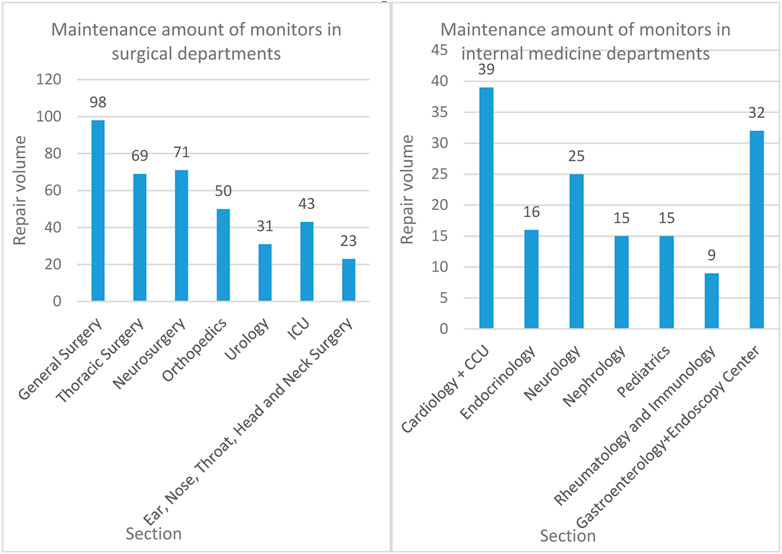
FIGURE 6. Statistical chart of monitor maintenance volume between some departments.
Therefore, preventive maintenance plans for these departments should be prioritized. This way, not only can target preventive maintenance be carried out, but also the frequency of failure of the monitor can be reduced, thereby improving the utilization rate of the monitor.
Monitor maintenance failure reasons are divided into two categories: one accessory failure, divided into blood oxygen probe failure, ECG lead line failure, blood pressure cuff failure, second equipment failure, divided into blood oxygen module, blood pressure module, ECG module, power board, fan, display screen, key board, encoder, main control board and other types of failure reasons. There are a total of 699 monitors in the hospital, and a total of 750 monitors have been repaired during the year. The data statistics of the fault causes are shown in Figure 7 below:
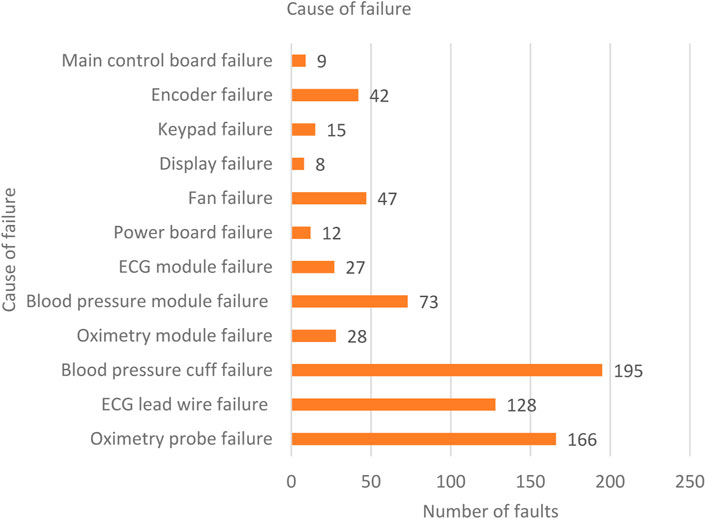
FIGURE 7. Statistics of failure cause.
From this, we can see that the main reason for the failure of the monitor is the accessories. Through these data, we can play a good reference role in purchasing, monitor accessories, and help us reduce unnecessary expenses. According to the statistics, a total of 261 monitor equipment failures occurred. The department sent it to the engineer for repair and the engineer judged the failure and waited for 3–4 days to purchase the parts, resulting in a serious waste of equipment resources. Preparing a sufficient number of vulnerable module accessories through data statistics. After judging the fault, the repair can be completed and sent back to the department for the first time, which will not cause the equipment to be unavailable for a long time, thus improving the utilization rate of the equipment.
There are five brands of monitors currently in use in the hospital: Mindray, Coman, Keruikang, Japanese colin, and GE. Among them, mainly domestic brands are mainly imported, and the number of imported colin and GE is small, resulting in a small number of samples, which has no practical reference significance. From the statistics in Table 2, it can be concluded that the proportion of failures in home monitors is: Mindray, Coman, and Kericon.
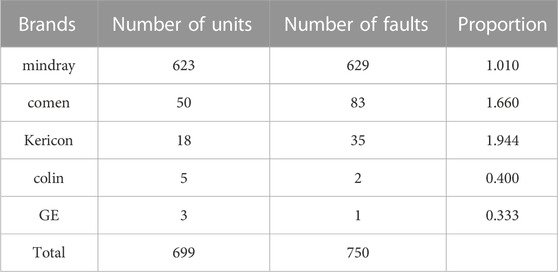
TABLE 2. The number of failures of each brand monitor.
Secondly, we conducted a survey on the changes brought about by the establishment of the medical equipment maintenance management platform for some medical staff. The data obtained are shown in Table 3:
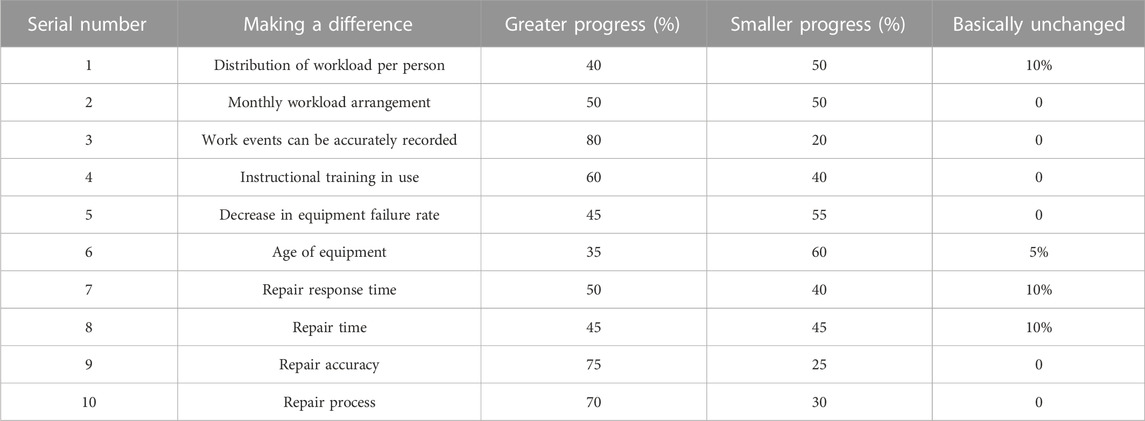
TABLE 3. Research data on medical equipment maintenance management platform for medical and nursing staff.
Through the analysis of the above data, it is concluded that the construction of the maintenance management platform has brought us many benefits compared with the previous traditional maintenance management methods:
① The response time of maintenance has been greatly improved. There is no need to fill in, submit, review and review paper applications between departments, and maintenance applications can be responded to in a timely manner, reducing the impact time;
② Clinical Medical equipment repair information is not easy to be missed and forgotten. In contrast to paper storage, data in a computer system can be viewed at any time as soon as it is entered. The set reminder function can intelligently solve the work omission and forgetting caused by the engineer’s busy work;
③ Because of the completeness and detail of the clinical repair report information, it is helpful for the maintenance engineer to judge the equipment failure and make related maintenance preparations, to improve the maintenance efficiency. From the repair report to the final acceptance of each maintenance, the relevant data and information will be stored in the system, and engineers can call up these data for viewing at any time. By analyzing the historical failures of the equipment, it can be more helpful for the accuracy of the engineer’s maintenance work;
④ The process management of maintenance tasks is more conducive to supervising engineers to complete maintenance tasks. The full life cycle management method of equipment allows equipment maintenance managers to check the status of the equipment at any time, whether it is in use or under maintenance, how long the equipment under maintenance has been down, and who is the engineer in charge. This helps to manage the management of equipment maintenance in the entire hospital by grasping it.
⑤ It is beneficial for clinical departments to have a comprehensive grasp of the current state of medical equipment in undergraduate rooms. By viewing the information of certain equipment in the department in the system, the historical data and real-time status of the equipment can be clearly understood, which helps the department to use the equipment better.
⑥ management platform has detailed records for each medical device. It achieves comprehensive management, automatically generating preventive maintenance tasks. It can remind users and maintainers of the equipment, improve the normal efficiency of the equipment, and avoid omissions.
⑦ The setting of the platform allows equipment users and managers to assist and supervise each other, making the preventive maintenance of each equipment more operational and practical.
⑧ The Use of the platform promotes the hospital to carry out preventive maintenance of medical equipment. This way, the total maintenance cost and total failure time of the hospital’s medical equipment in the whole life cycle are reduced, and greater benefits can be produced. It creates more economic benefits for hospitals and improves the use time and quality of medical equipment. It creates more social value for the hospital.
Therefore, the use of big data to build a maintenance platform is conducive to the complete documentation of medical equipment maintenance information, which brings data support to future management. The information management method can store a large amount of data and information, and at the same time, it can be queried when people want. The incomplete information is found through systematic statistics and then supplemented in time to ensure the integrity of the data.
5 Conclusion
Now technology is developing increasingly rapidly. Through the combination of big data, informatization and digitalization and “Internet +”, a medical equipment maintenance platform is developed. This minimizes the cost of equipment use and improves economic benefits, thereby achieving the goal of extending the entire life cycle of the equipment and reducing the failure rate and making data management more standardized. Although the current platform meets expectations, the needs of hospitals are always changing. In the actual use the process is gradually increasing, the system will inevitably not meet all the needs, which will be further improved in the future. If the number of equipment will continue to increase, the related functions can be expanded, and all equipment in the hospital can be centralized in the system for management. It includes the use department, use status, and service life of the equipment. The big data generated by equipment maintenance can be further mined and analyzed to provide better reference for leadership decision-making. Finally, it is hoped that the system can continue to expand to meet the needs of different hospitals.
Data availability statement
The original contributions presented in the study are included in the article/Supplementary material, further inquiries can be directed to the corresponding author.
Author contributions
YM and JL-writing and static analysis of data. JZ-guiding the research directions and ideas.
Funding
The Innovation Center of Science and Technology Department of Shanxi Province “Medical Device Precision Testing Technology Innovation Center” (Fund No: 202104010911025), The Key Research and Development Plan of Shanxi Provincial Department of Science and Technology “Research on Key Technologies of Intelligent Management Application Platform for the Whole Life Cycle of Medical Devices” (Fund No:202102020101003), The Engineering Research Center of Shanxi Provincial Development and Reform Commission “Medical Device Intelligent Precision Detection Engineering Research Center”, and The Provincial Key Cultivation Laboratory of Shanxi Provincial Health Commission “Research on intelligent and accurate detection of medical devices” (Fund No: 2020SYS14).
Conflict of interest
The authors declare that the research was conducted in the absence of any commercial or financial relationships that could be construed as a potential conflict of interest.
Publisher’s note
All claims expressed in this article are solely those of the authors and do not necessarily represent those of their affiliated organizations, or those of the publisher, the editors and the reviewers. Any product that may be evaluated in this article, or claim that may be made by its manufacturer, is not guaranteed or endorsed by the publisher.
References
1. Lu H, Sun S, Zhang X. Research on quality evaluation system of ultrasound diagnostic equipment maintenance. Zhongguo Yi liao qi xie Za Zhi = Chin J Med instrumentation (2019) 43(3):223–5. doi:10.3969/j.issn.1671-7104.2019.03.018
2. Moura MDC, Santana JM, Lopez Droguett E, Lins ID, Guedes BN. Analysis of extended warranties for medical equipment: A stackelberg game model using priority queues. Reliability Eng Syst Saf (2017) 168(12):338–54. doi:10.1016/j.ress.2017.05.040
3. Yu H, Zou J, Zhang W. Research on mathematical distribution of failure time and engineering evaluation for medical electrical equipment based on operation and maintenance data. Zhongguo Yi liao qi xie Za Zhi = Chin J Med instrumentation (2020) 44(3):199–204. doi:10.3969/j.issn.1671-7104.2020.03.003
4. Rivas RA, Grossling B, Galvan P. PP03 development of A medical device maintenance management system. Int J Tech Assess Health Care (2019) 35(S1):37–8. doi:10.1017/s026646231900182x
5. Li V, Lam J, Han Y, Chow K. A big data and artificial intelligence framework for smart and personalized air pollution monitoring and health management in Hong Kong. Environ Sci Pol (2021) 124:441–50. doi:10.1016/j.envsci.2021.06.011
6. Zhang Y, Xu Y, Wei J. Research and application of financial management based on big data platform. Agro Food Industry Hi Tech (2017) 28(1):2596–600.
7. Narayanan M, Kumar RG, Jayasundaram J. Big data analytics and an intelligent aviation information management system. Turkish J Comp Math Edu (Turcomat) (2021) 12(11):4328–40.
8. Ullah S, Awan MD, Khiyal M. Big data in cloud computing: A resource management perspective. Scientific programming (2018) 2018(PT.1):5418679.1–17. doi:10.1155/2018/5418679
9. Xl A, Hao LA, Big data analysis of the internet of things in the digital twins of smart city based on deep learning. 2021, 128:167–77.
10. Lv Z, Lou R, Li J, Singh AK, Song H. Big data analytics for 6G-enabled massive internet of things. IEEE Internet Things J (2021) 8(7):5350–9. doi:10.1109/jiot.2021.3056128
11. Sung S, Lee P, Hsieh C, Zheng W. Medication use and the risk of newly diagnosed diabetes in patients with epilepsy: A data mining application on a healthcare database. J Organizational End User Comput (Joeuc) (2020) 32(2):93–108. doi:10.4018/joeuc.2020040105
12. Gupta V, Gupta N, Sarode GS. Assessment of equipment utilization and maintenance schedule at a dental institution in Bengaluru, India. World J Dentistry (2017) 8(2):104–8. doi:10.5005/jp-journals-10015-1421
13. Liu X, Lang L, Zhang S, Xiao J, Fan L, Ma J, et al. Intelligent fault diagnosis of medical equipment based on long -short-term memory network. J Biomed Eng (2021) 38(2):361–8. doi:10.7507/1001-5515.201912019
14. So A, Lkn A, Mst A, Nantume J, Ackers LH, Ssekitoleko RT. Enhancing skills to promote the utilization of medical laboratory equipment in low resource settings. Health Pol Tech (2020) 9(1):94–101. doi:10.1016/j.hlpt.2020.01.001
15. Asvija B, Eswari R, Bijoy MB. Security threat modelling with bayesian networks and sensitivity analysis for IAAS virtualization stack. J Organizational End User Comput (Joeuc) (2021) 33(4):44–69. doi:10.4018/joeuc.20210701.oa3
16. Habeeb R, Nasaruddin F, Gani A, Targio Hashem IA, Ahmed E, Imran M. Real-time big data processing for anomaly detection: A survey. Int J Inf Manag (2019) 45(APR):289–307. doi:10.1016/j.ijinfomgt.2018.08.006
17. Lee JH, Lee JM, Jang YS. Analysis of 2018 PyeongChang Olympic keywords using social network big data analysis. Korean J Sport Manag (2017) 22(6):73–89. doi:10.31308/kssm.22.6.5
18. Garcia AJ, Toril M, Oliver P, Luna-Ramirez S, Garcia R. Big data analytics for automated QoE management in mobile networks. IEEE Commun Mag (2019) 57(8):91–7. doi:10.1109/mcom.2019.1800374
19. Liu H, Yang LT, Chen J, Ye M, Ding J, Kuang L. Multivariate multi-order Markov multi-modal prediction with its applications in network traffic management. IEEE Trans Netw Serv Manag (2019) 16(3):828–41. doi:10.1109/tnsm.2019.2934133
Keywords: big data, bayesian networks, medical devices, maintenance management, PLATFORM
Citation: Li J, Mao Y and Zhang J (2023) Construction of medical equipment maintenance network management platform based on big data. Front. Phys. 11:1105906. doi: 10.3389/fphy.2023.1105906
Received: 23 November 2022; Accepted: 11 January 2023;
Published: 26 January 2023.
Edited by:
Amrit Mukherjee, University of South Bohemia in České Budějovice, CzechiaCopyright © 2023 Li, Mao and Zhang. This is an open-access article distributed under the terms of the Creative Commons Attribution License (CC BY). The use, distribution or reproduction in other forums is permitted, provided the original author(s) and the copyright owner(s) are credited and that the original publication in this journal is cited, in accordance with accepted academic practice. No use, distribution or reproduction is permitted which does not comply with these terms.
*Correspondence: Jin Zhang, MjAxNjE1MDE4OUBqb3UuZWR1LmNu