 Nan Bao
 Ye Yuan2,3
 Qiankun Li
 Li-Bo Zhang
95% of researchers rate our articles as excellent or good
Learn more about the work of our research integrity team to safeguard the quality of each article we publish.
Find out more
ORIGINAL RESEARCH article
Front. Phys. , 03 March 2023
Sec. Medical Physics and Imaging
Volume 11 - 2023 | https://doi.org/10.3389/fphy.2023.1098756
This article is part of the Research Topic Artificial Intelligence for Medical Informatics View all 8 articles
In order to reduce postoperative complications, it is required that the puncture needle should not pass through the lung lobe without tumor as far as possible in lung biopsy surgery. Therefore, it is necessary to accurately segment the lung lobe on the lung CT images. This paper proposed an automatic lung lobe segmentation method on lung CT images. Considering the boundary of the lung lobe is difficult to be identified, our lung lobe segmentation network is designed to be a multi-stage cascade network based on edge enhancement. In the first stage, the anatomical features of the lung lobe are extracted based on the generative adversarial network (GAN), and the lung lobe boundary is Gaussian smoothed to generate the boundary response map. In the second stage, the CT images and the boundary response map are used as input, and the dense connection blocks are used to realize deep feature extraction, and finally five lung lobes are segmented. The experiments indicated that the average value of Dice coefficient is 0.9741, which meets the clinical needs.
Lung cancer is the most prevalent cancer in China [1] and the most prevalent cancer in the world [2]. The clinicians must use the patient’s pathological cells as the “gold standard” for the diagnosis and grading of lung cancer [3]. Normally, the pathological cells will be obtained by a lung biopsy puncture procedure. In order to enable the surgeon to accurately insert the biopsy needle into the lobe of the lung where the tumour is located, pre-operative surgical planning requires precise segmentation of the five lobes of the lung [4]. The lungs are divided into five lobes in Figure 1, including the three lobes of the right lung, namely, the right upper lobe (RUL), the right middle lobe (RML) and the right lower lobe (RLL), are separated by a small crack and a large crack, while the two lobes of the left lung, namely, the left upper lobe (LUL) and the left lower lobe (LLL), are separated by a large crack.

FIGURE 1. Diagram of lung lobe divisions.
Traditional manual lobe segmentation from CT is time-consuming, laborious and tedious. During lung biopsy puncture procedures the puncture needle needs to be constantly adjusted, yet manual lobe segmentation based on intra-operative CT images is time-consuming and makes the patient suffer more. In addition, unclear lobe boundaries [5] and incomplete fissures [6] increase the difficulty of lobe segmentation. Therefore, a fully automated, fast and accurate method of lung lobe segmentation would greatly improve the accuracy of route planning for preoperative lung biopsy puncture navigation, reduce the risk of procedural complications and reduce patient suffering.
In the past few decades, there have been many automatic, semi-automatic, traditional or deep learning-based segmentation methods of the five lobes from CT images of the lungs.
In anatomy, there is a crack between the lobes of the lung. Therefore, most of the early methods of lung lobe segmentation distinguished the lobes of the lungs based on the detection of inter-pulmonary fissures. Pu et al. [7] proposed a fully automatic computational geometry-based method to detect fissure in three-dimensional lung images segmented by thresholds. Gao et al. [8] combined membership function and threshold segmentation method for the first time to identify and segment lung fissure contour with fuzzy boundary. Van Rikxoort et al. [9] proposed to segment the lung region and the fissure in a supervised way, combined with image processing techniques such as region growing, and then classify the pixels in the surrounding region according to the segmented lung region and the fissure as structural features, thus segmenting the lung lobes. However, these methods have shortcomings, 1) imprecise segmentation results difficult to meet clinical needs; 2) incomplete fissure makes for poor segmentation results.
In view of the incomplete fissure, Pu et al. [10] added Radial Basis Functions (RBFs) to the above method [7] to fit the surface of the fissure in a curved surface fitting way, which has low sensitivity to the incomplete fissure, thus achieving the effect of segmenting the lung lobe. Schmidt-Richberg et al. [11] proposed a level set-based method to segment the fissure as structural information for further lobe segmentation. Although it is indeed optimized for incomplete fissure detection, the effect is still not very good. After deep learning matures, it shines in many fields [12,13]. Sarah E. Gerard et al. [14] proposed a method based on deep learning to detect fissure, which demonstrates better robustness of deep learning methods. However, for the task of lung lobe segmentation, the detection of fissure alone still cannot meet the actual clinical needs.
It is difficult to accurately segment the lung lobe only by relying on the single anatomical structure of the fissure. Therefore, some methods combine the interpulmonary fissure with other trachea and tissues in the lung to provide more structural information for the segmentation of the lung lobe. S. Ukil et al. [15] first extracted the region of interest of fissure using anatomical structure information such as vascular tree, trachea and bronchus and proposed a smooth method for approximate optimization of incomplete fissure, which improved the segmentation accuracy of lung lobe. Doel et al. [16] firstly used the seed points obtained from the segmentation results of the watershed transform of the vessel density filter and the bronchial tree to perform a rough segmentation of the lung lobe. At the same time, a new filter is proposed to identify the fissure, and the identified fissure is fitted and approximated by multi-level B-spline function, and then the lung lobes coarsely segmented by tracheal tree are adjusted. Patil et al. [17] performed watershed segmentation according to the cost image to obtain lung lobes, where the cost image is calculated from the lungs, blood vessels, airways and fissure. Bragman et al. [18] proposed to establish an average position probability model of fissure based on the probability of group fissure, and combine other anatomical structure information with groupwise fissure prior to segment lung lobes.
Although these methods have been successful in practice to a certain extent, they still have the following limitations: 1) Because they involve complex multistage pipelines, the calculation time is long; 2) The segmentation effect is greatly affected by the segmentation quality of fissure and other anatomical structures.
With the development of deep learning in the field of medical image processing [19–21], especially the victory of U-Net [22] in the cell image segmentation competition and the excellent performance of various FCNs [23] networks in medical image segmentation tasks, a new direction has been opened up for automatic segmentation of medical images. Compared with traditional segmentation methods, FCNs has the main advantages of automatically and hierarchically learning features from data, optimizing the objective function in an end-to-end manner, and calculating the objective function with the function of powerful fitting function.
Harrison et al. [24] proposed a two-dimensional deep-supervised FCN with multi-path connections, that is, a progressive fully nested network (P-HNN), which is used to segment lung regions in CT images. The P-HNN + RW algorithm proposed by George et al. [25] that is based on 2DP-HNN to predict the probability of the boundary, and combined with the 3D random walk algorithm to perform three-dimensional segmentation of the lung lobe. This method based on 2D full convolution network (FCN) processes each slice of CT 2D image independently. Ignoring that the lungs are three-dimensional and the context information between CT image layers, although this method may be a suboptimal use of 3D data, it will definitely affect the accuracy of segmentation, especially for incomplete fissure, which usually requires anatomical information from adjacent slices. Imran et al. [26] abandoned the extraction of other anatomical structure information, directly extracted features from the original three-dimensional lung CT images, and proposed a progressive dense V-Net (PDV-Net) based on P-HNN [24] and Dense V-Net [27]. Ferreira et al; [28] realized end-to-end three-dimensional lung lobe segmentation based on V-Net and added various regularization techniques (FRV-Net) such as Deep Supervision, Batch Normalization and Multi-Task Learning. Lee et al. [29] added dilated residual dense blocks, depthwise separable convolutions and spatial information enhancement to 3D FCN to improve the accuracy of lung lobe segmentation. Park et al. [5] proposed an automatic lung lobe segmentation method based on 3D U-Net [30], and trained and verified it in both public data sets and private data sets, showing clinical potential. Tang et al. [31] used the improved V-Net and proposed a hybrid loss function for optimization. Similar to this method, Lassen-Schmidt et al. [32] based on 3D U-Net and improved DICE loss function also performed well in lung lobe segmentation task. Kelei He et al. [33] proposed that multi-task multi-instance deep network (M2UNet) can simultaneously evaluate the severity of COVID-19 disease and segment lung lobes, but this method is based on two-dimensions. Although many methods of lung lobe segmentation have achieved good results, the problem of lung lobe segmentation still faces some problems, such as incomplete fissure, small dataset, unclear lung lobe boundaries and so on.
Therefore, this paper proposes a multi-stage cascade network to segment lung lobes from coarse to fine. First, the left and right lungs are segmented. Then the boundaries of the lobes are generated. Finally the five lobes are accurately segmented. Our main contributions are summarized as follows:
• The multi-stage method, including the left and right lungs segmentation, the lung lobe boundaries extraction and the lung lobes segmentation, can effectively improve the segmentation accuracy.
• A lung lobe edge enhancement method has been proposed based on generative adversarial networks to generate a response map of the fissure and lung lobe boundaries, which can improve the sensitivity of the lung lobe boundaries for the lung lobes segmentation.
• The response map of the fissure and lung lobe boundaries is concatenated with the original lung data as the input of the lung lobes segmentation network to improve the attention of the lung lobe boundaries.
The remainder of this paper is organized as follows. Section 2 presents the proposed cascade of the lung lobe segmentation framework. Section 3 introduces the experimental configuration. Section 4 describes the results and analysis. Finally, Section 5 discusses and concludes our work.
This paper proposes a cascade of lung lobe segmentation framework shown in Figure 2. The whole process framework consists of three parts: the left and right lungs are identified and the bounding box is taken using the 3DU-Net [30]; the lung lobe boundary is detected from the left and right lung bounding box and the boundary response map is generated; the left and right lung bounding box and the boundary response map are concatenated and fed into the lung lobe segmentation network to obtain the lung lobe segmentation results.
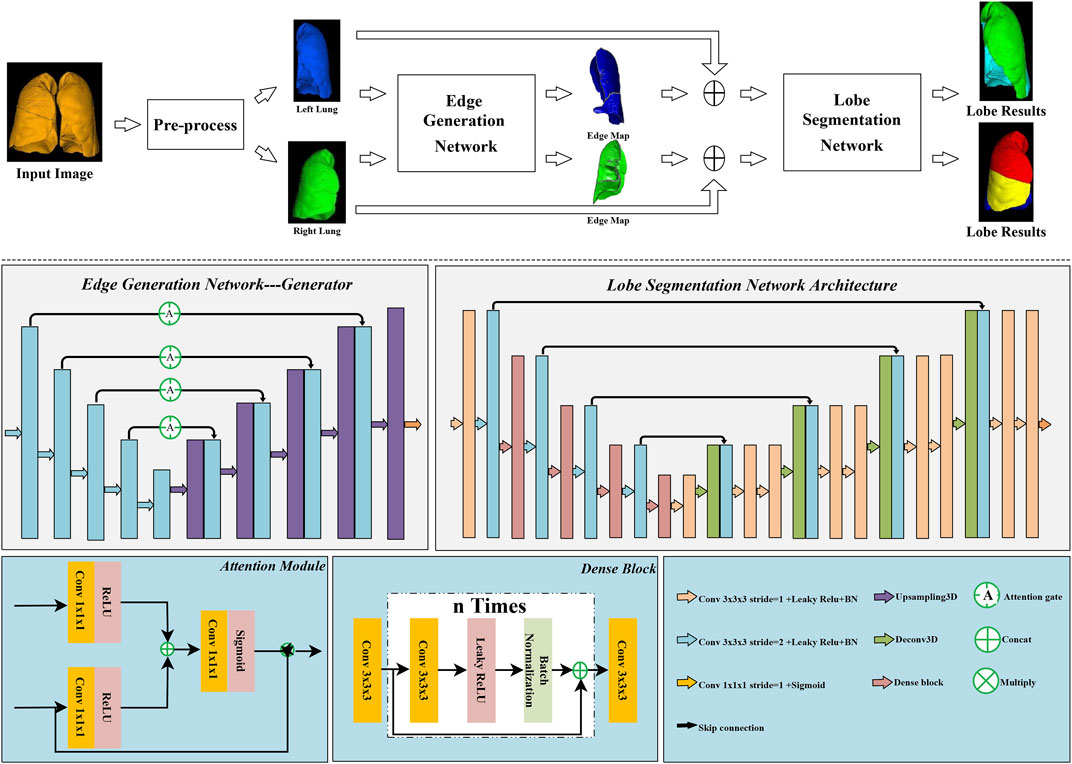
FIGURE 2. Overall workflow of the proposed lung lobe segmentation method.
The task of lobe segmentation of the left and right lungs is not symmetrical because of the different number of lobes (2 lobes in the left lung and 3 lobes in the right lung). Therefore, in pre-processing, the left and right lungs are extracted separately for subsequent boundary identification and lung lobe segmentation. Extracting the left and right lung regions separately not only reduces the requirements for GPU memory, but also improves the performance of the lung lobe segmentation network on the ipsilateral lobe. The pre-processing consists of two main steps as follows.
Step 1, 3D-UNet was used to perform left and right lung region extraction, feeding the raw CT images to obtain dual-channel left and right lung segmentation results. To reduce the impact of incorrect segmentation on follow-up, 3D maximum connected domain extraction was used to improve the segmentation results.
Step 2, according to the mask of the left and right lungs obtained in Step 1, the left and right lungs are cropped by a bounding box from the lung CT image. The principle of cropping is to expand the cross-section outwards by five pixels in the x and y directions respectively, while the number of axial direction remains unchanged. In addition, to accommodate network input, the cropped images of the left and right lungs were resized to 160 × 160 × 128.
The lung lobe segmentation methods include two types of segmentation, one based directly on the original image and the other using information from other anatomical structures in the lung to improve the lobe segmentation results.
This paper proposes a cascade network based on weighted enhancement of lung lobe edges, considering that the anatomical structure of the lung has a great influence on the accuracy of lung lobe segmentationl [18]. Edge Generation Network (EG-Net) inputs pre-processed left and right lung images with image size 128 × 160 × 160 and generates response maps of the same size containing the lung boundary and the fissure. The edge of the original image is enhanced in the form of a probability map to improve the segmentation accuracy of the lung lobe. Edge response map improve attention to lung lobe boundaries and fissures in the form of probability map [34]. In addition, the edge response map still provides a predicted probability value for both incomplete fissures and fuzzy boundaries.
EG-Net follows the design of the pix2pix GAN [35] and the EG-Net structure is illustrated in Figure 2. The generator of EG-Net is based on 3D-UNet structure and attention modules [36] are added to the network to improve attention to boundaries. There are continuous five down-sampling layers in encoder, and each layer consists of a strided convolution, a leaky relu activation function and a batch normalization operation. In the decoder, five up-sampling layers are used to gradually restore the image resolution. Each layer consists of a trilinear interpolation, followed by a regular convolutional layer containing an activation function and a BN layer to improve feature availability after upsampling. The output layer uses a 1 × 1 × 1 convolution and a Sigmoid function to rescale the results to between 0 and 1 to obtain a probability map of the boundary and the fissure. Furthermore, in order to pay more attention to the lobe boundary and the fissure, each skip connection is replaced by an attention module.
In order to make the generated boundary closer to the real boundary, the discriminator takes the generated boundary response map and the lung CT image as two-channels input. Since the purpose of this network is only to segment the boundary and fissure with better effect, which means that we pay more attention to the segmentation ability of the generator. The learning rate of the discriminator is set to 0.001 times of the generator’s. In addition, in the training phase, due to the amount of training data, the generator is updated every 13 times and the discriminator is updated once, thus ensuring that every data can be trained for the discriminator.
During the training phase, we find that it is difficult for original cross-entropy loss function to make the GAN converge. Therefore, the Mse function is used as the main loss function to ensure stable training of the GAN and prevent the mode collapse. The loss function of the final generator can be defined as
where ERM is the generated response map of the lung lobe boundary and fissure, GT is the boundary label softened by Gaussian convolution kernel (σ = 5), and the Mse loss function is expressed as
In addition, ERM* is the dual-channel data formed by ERM concatenate with original data, GT* is the dual-channel data formed by GT concatenate with original data, and the adversarial loss is expressed as
in this paper, λ1 is set to 5 and λ2 is set to 0.001.
Inspired by V-Net [37] and DenseNet [38] two networks, we proposed a Lung Lobe Segmentation Network (LS-Net). LS-Net has the same network structure as V-net for 3D feature extraction, and Dense blocks are applied to improve feature reusability. LS-Net concatenates the lung image with the corresponding edge response map as two channel inputs, and the outputs of LS-Net are the segmentation results of the two lobes of the left lung and three lobes of the right lung separately. The network shown in Figure 2 includes an encoder and a decoder. In the encoder, there are four down-sampling layers, and each layer is composed of a Dense block module for feature extraction and a strided convolution for down-sampling except for the input layer which uses convolution instead of Dense block. Where all the convolution kernel sizes of the Dense block are set to 3, and the growth rates are set to 4, 4, 4, and 8, respectively, and the step is set to 2, 4, 4, and 4, respectively. Details of the Dense block construction are shown in Figure 2. All the convolution kernel size of the convolution layer is 3 × 3 × 3, and the number of convolution kernels according to the sequence is set to 16, 16, 24, 48, 64, and 96 respectively.
At that decoder, deconvolution is used instead of interpolation for up-sampling. Two successive convolution operations are performed to fuse the shallow features with the deep features. Among them, the kernel size is set to 3, and the kernel number is set to 64, 64, 48, 48, 24, 24, 16, and 16. The output layer kernel size is 1, the kernel number is determined by the number of lung lobes. When the input is the left lung (includes two lobes), the number of output channels is set to 3, including two lobes and background. When the input is the right lung (includes three lobes), the number of output channels is set to 4, including three lobes and background.
The data of lung CT images in this experiment were all from Shengjing Hospital, Shenyang City, Liaoning Province. A total of 148 CT image series were randomly collected between January and December 2018, ranging in age from 23 to 75 years old, 67 females and 81 males. Among them, 78 sets were scanned by the Aquilation of Toshiba medical system equipment and 70 sets were scanned by Brilliance ICT of the Philips medical system equipment. All data are plain scan data, and images are stored in uncompressed format. The number of pixels in each slice of image is 512 × 512, and the layer thickness is 1 mm and 0.5 mm respectively.
There are three kinds of ground truth images, including the left lung and right lung labels, lung lobe labels and lung lobe boundary labels. Among them, the labels of left lung, right lung and five lobes were annotated by two clinicians with five and 10 years experience respectively using a software (ITK-SNAP). However, the labels of the lung lobe boundary are generated from the labels of the lung lobe. The lung lobe labels are corroded and expanded using a kernel of size 3 respectively and are subtracted to obtain the labels of the lung lobe boundary. In order to improve the recognition of fuzzy boundary and avoid the influence of incorrect boundary labels on the next segmetation network, the lung lobe boundary labels are softened using a Gaussian function (sigma = 5) to obtain the soft labels of the boundary.
This experiment is based on Windows system, carried out on Pycharm 2019.3 compiler, using Keras2.2.4 and Tensorflow1.12 deep learning frameworks, and the GPU is Nvidia GeForce GTX 1080Ti (11 GB), and an average run time is 26.6 s for a patient’s 3D lung CT.
The Dice similarity coefficient, precision, sensitivity and specificity were used to validate the segmentation results.
The Dice similarity coefficient (Dsc) was calculated as follows
where G denotes the ground-truth label, and P denotes the prediction results.
The Precision was calculated as follows
The Sensitivity (Se) was calculated as follows
The above indicates the correct detection ratio, which is the area fraction within the manual segmentation region that is also part of the automatic segmentation output (the higher the evaluation score, the better the performance of the applied algorithm).
The Specificity (Sp) was calculated as follows
The value indicates the area fraction included in the automatic segmentation region that is not covered in the ground truth mask. Therefore, a more significant Sp means a more accurate segmentation.
The Hausdorff distance (HD) was calculated as follows
The HD measures the maximum surface distance between the predicted mask map Pi for pixel i and the corresponding ground truth Gi manually labeled by the experts. The formula for calculating the surface point set distance is shown below:
Since lung lobe segmentation is carried out by cascading multiple networks in this paper, quantification will be carried out from three aspects: Section 4.1 is the segmentation result of lung, Section 4.2 is the generation result of probability map of lung lobe boundary and fissure for Section 2.2, and Section 4.3 is the result of lung lobe segmentation for Section 2.3.
In this paper, 3D-UNet is used to segment the left and right lungs of lung CT images in pre-processing. To avoid redundant areas being extracted due to incorrect segmentation, the maximum connected field of each channel is retained, reducing the false positive rate. The 148 cases of data were divided into 128 training cases and 20 test cases. Although the entire experiment included three networks and each network was trained independently, during the testing phase, the data from one patient was computed end-to-end. Therefore, to avoid data leakage between networks, the distribution of training and test data for the boundary generation and lobe segmentation networks was kept consistent with that of the lung parenchymal segmentation network. Dsc, Precision, Sensitivity (Se), Specificity (Sp) and Hausdorff distance (HD) will be used to evaluate that result of lung segmentation. The final test results are shown in Table 1. The results show that the most of the lung area is segmented and that the under and over-segmentation rates are low. Nevertheless, we have chosen to expand the bounding box by five pixels when we take it. Figure 3 shows the result of the segmentation and ground truth.
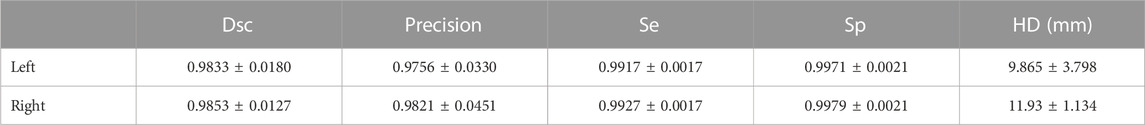
TABLE 1. Results of segmentation of the right and left lung parenchyma.
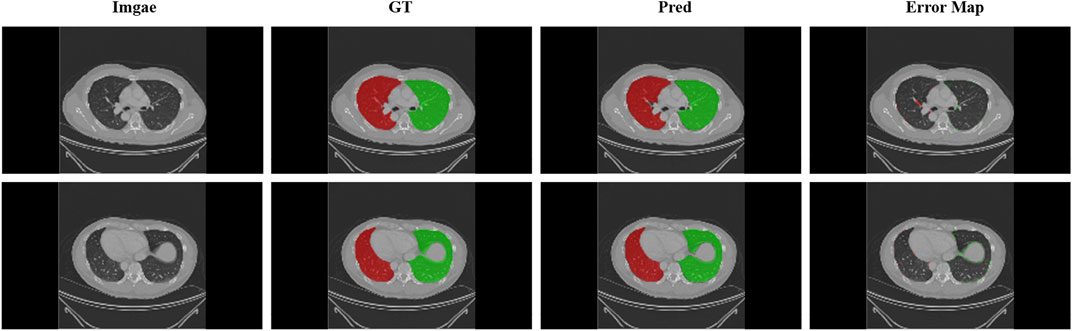
FIGURE 3. Display of lung segmentation results. Green areas: left lung; Red areas: right lung. Error map that performed the difference between the predicted and real results is shown.
Since the goal of the boundary generation network is to generate a relatively complete boundary and fissure that can provide a probability for the next level of lung segmentation network, the lung boundary and fissure generated by this level of network are actually response map. The label used in this section for evaluation, which is smoothed by Gaussian (σ = 5) function, so that the original binary label is converted into soft label, especially on the edge, to ensure that the label value of the generated boundary and fissure is between 0 and 1. After smoothing, as shown in Figure 4, the boundary enhancement network can still give a prediction probability for boundaries that are difficult to distinguish from naked eyes. The lung lobe boundary results generated by the boundary generation network is a probability map between 0 and 1. A threshold of 0.5 was used to binarize the results, and then they were evaluated using Dsc and Mse. The same data distribution as the training data and test data of lung region segmentation are adopted, and the final test results are shown in Table 2.
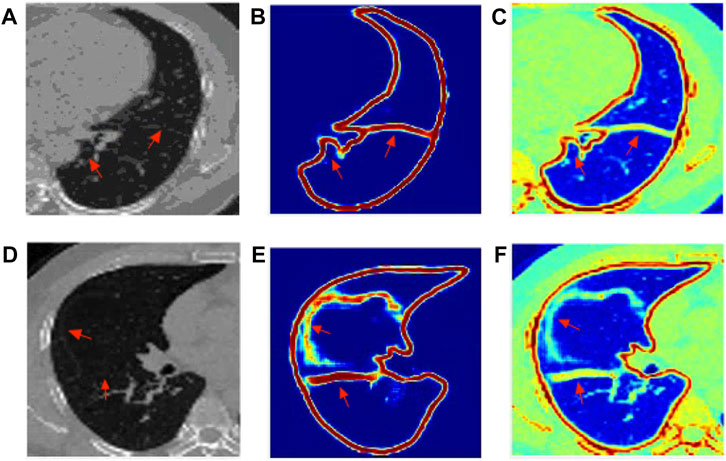
FIGURE 4. The visualization results of edge response map generated by EG-Net: (A) left lung origin data; (B) Boundary and fissure response generation map of the left lung; (C) The resulting response map is mapped to the original image; (D) right lung origin data; (E) Boundary and fissure response generation map of the right lung; (F) The resulting response map is mapped to the original image.
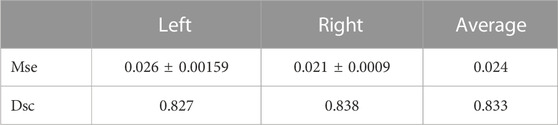
TABLE 2. Results of segmentation of the right and left lung parenchyma.
As shown in Figure 4, the boundary of the left lung and the fissure have a better effect, in which the fissure is usually complete and clear. While the fissure of the right middle lobe of the right lung is not very good and easy to distinguish, but the response map still gives a probability prediction.
In the task of lung lobe segmentation, we choose 3D U-Net [30], V-Net [37] and PDV-Net [26] for comparative experiments. 3D U-Net is widely used in the network structure of image segmentation tasks. V-Net also performs well in the task of lung lobe segmentation. PDV-Net is also a model that performs well in lung lobe segmentation based on deep learning method.
Table 3 is the Dice coefficient evaluation results compared with 3DU-Net, V-Net and PDV-Net, which are the segmentation results of two lobes of the left lung and three lobes of the right lung respectively. It can be seen that our proposed lung lobe segmentation network based on edge enhancement performs best, even for the most difficult right middle lung lobe to be segmented. Figures 5, 6 show the visualization results compared with other models.
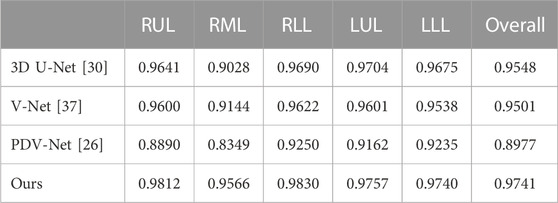
TABLE 3. Comparison of lung lobe segmentation results with other models. Dsc is used as the evaluation standard.
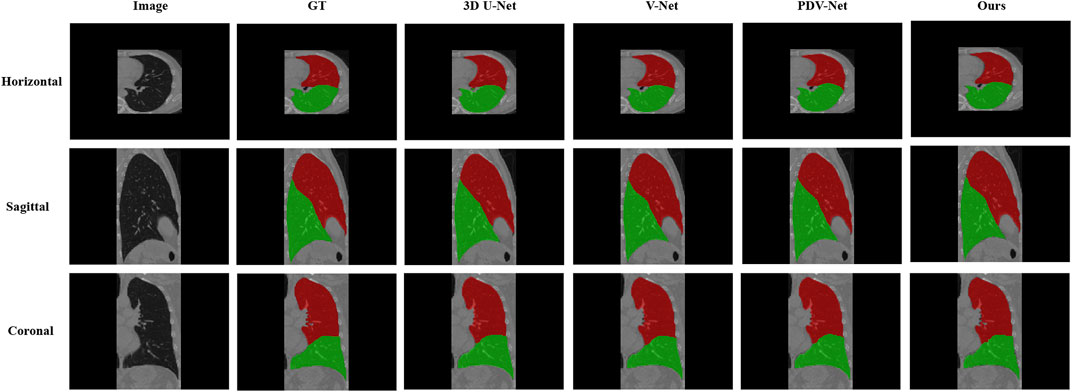
FIGURE 5. Visual comparison between our proposed model and 3DU-Net, V-Net, PDV-Net and ground truth; This figure shows the segmentation results of cross section, sagittal plane and coronal plane of the left lung region; Color indicates that red: Left Upper Lobe; Green: Left Lower Lobe.
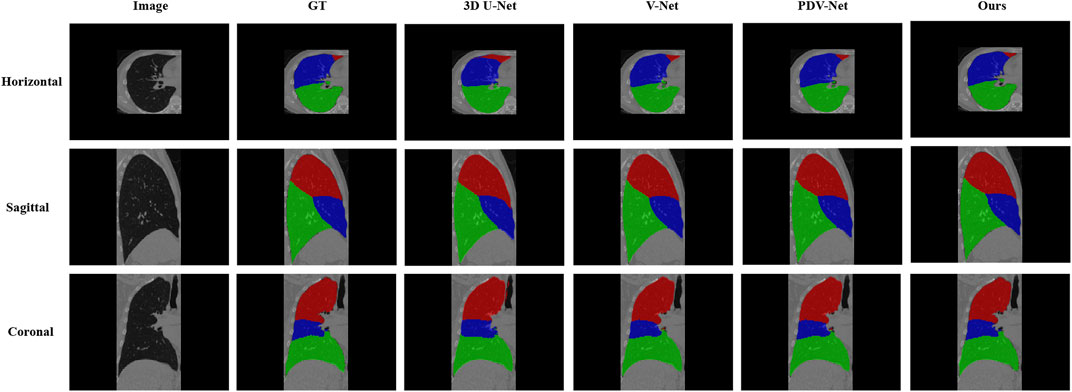
FIGURE 6. Visual comparison between our proposed model and 3DU-Net, V-Net, PDV-Net and ground truth; This figure shows the segmentation results of the cross section, sagittal plane and coronal plane of the right lung region; Color Coded, Red: Right Upper Lobe; Blue: Right Middle Lobe; Green: Right Lower Lobe.
In this study, we propose a fully automatic deep learning model for lung lobe segmentation. In this method, the left and right lungs are segmented by cascade method. Considering the importance of anatomical structure information, the lung lobe boundary and fissure are segmented, and the obtained lung lobe boundary is weighted to the original image as a response map for boundary enhancement to improve the segmentation accuracy.
The method based on boundary enhancement proposed in this paper can effectively improve the accuracy of boundary segmentation and reduce the sensitivity to fissure. For indistinguishable boundaries, the boundary enhancement network can still give a probability, thus making the lung lobe form a relatively closed area and improving the segmentation effect of the lung lobe on the boundary.
At the same time, we use 40 test data to compare 3DU-Net, V-Net and PDV-Net, which all perform well in segmentation tasks, and finally prove that our method is more effective. However, the proposed method still suffers from high memory requirements and data quality issues. Due to memory reasons, the left and right lungs can only be processed separately, which means that we need to train different models for the left and right lungs respectively. Different from natural images, the amount of medical image data is relatively small. Although depth learning performs very well in function fitting tasks, over-fitting is easy to occur, so a large amount of data will well reduce the risk of over-fitting.
The raw data supporting the conclusion of this article will be made available by the authors, without undue reservation.
Written informed consent was obtained from the individual(s), and minor(s)’ legal guardian/next of kin, for the publication of any potentially identifiable images or data included in this article.
NB, YY, QYL, QKL, and L-BZ contributed to conception and design of the study. NB designed the method and experiment validation, and wrote the first draft of the manuscript. YY performed the statistical analysis. QYL organized the database. QKL revised sections of the manuscript. L-BZ supervised the projection. All authors contributed to manuscript revision, read, and approved the submitted version.
This work is supported by the National Natural Science Foundation of China (61971118), Fundamental Research Funds for the Central Universities (N2216014), Science and Technology Plan of Liaoning Province (2021JH1/10400051).
The authors declare that the research was conducted in the absence of any commercial or financial relationships that could be construed as a potential conflict of interest.
All claims expressed in this article are solely those of the authors and do not necessarily represent those of their affiliated organizations, or those of the publisher, the editors and the reviewers. Any product that may be evaluated in this article, or claim that may be made by its manufacturer, is not guaranteed or endorsed by the publisher.
1. Zheng R, Zhang S, Zeng H, Wang S, Sun K, Chen R, et al. Cancer incidence and mortality in China, 2016. J Natl Cancer Cent (2022) 2(1):1–9. doi:10.1016/j.jncc.2022.02.002
2. Bray F, Ferlay J, Soerjomataram I, Siegel RL, Torre LA, Jemal A. Global cancer statistics 2018: GLOBOCAN estimates of incidence and mortality worldwide for 36 cancers in 185 countries. CA: a Cancer J clinicians (2018) 68(6):394–424. doi:10.3322/caac.21492
3. de Margerie-Mellon C, Bazelaire CD, de Kerviler E. Image-guided biopsy in primary lung cancer: Why, when and how. Diagn Interv Imaging (2016) 97 10:965–72. doi:10.1016/j.diii.2016.06.016
4. Bao N, Jia J, Chen Y, Li Z, Song C, Zhao R-Y. Surgery path planning for lung biopsy based on pareto optimization. In: Proceeding of the 2020 5th International Conference on Technologies in Manufacturing, Information and Computing (ICTMIC 2020). Clausius Scientific Press (2020).
5. Park J, Yun J, Kim N, Park B, Cho Y, Park HJ, et al. Fully automated lung lobe segmentation in volumetric chest CT with 3D U-Net: Validation with Intra-and Extra-Datasets. J Digital Imaging (2020) 33(1):221–30. doi:10.1007/s10278-019-00223-1
6. Gu S, Zheng Q, Siegfried J, Pu J. Robust pulmonary lobe segmentation against incomplete fissures. In: Medical imaging 2012: Computer-aided diagnosis, 8315. San Diego, California, United States: SPIE (2012). p. 905–12.
7. Pu J, Leader JK, Zheng B, Knollmann F, Fuhrman C, Sciurba FC, et al. A computational geometry approach to automated pulmonary fissure segmentation in CT examinations. IEEE Trans Med Imaging (2008) 28(5):710–9. doi:10.1109/TMI.2008.2010441
8. Gao S, Wang L. Method of pulmonary fissure segmentation based on fuzzy distance transform. In: Proceeding of the 2014 International Conference on Virtual Reality and Visualization; August 2014; Shenyang, China. IEEE (2014). p. 339–44.
9. Van Rikxoort EM, De Hoop B, Van De Vorst S, Prokop M, Van Ginneken B. Automatic segmentation of pulmonary segments from volumetric chest CT scans. IEEE Trans Med Imaging (2009) 28(4):621–30. doi:10.1109/tmi.2008.2008968
10. Pu J, Zheng B, Leader JK, Fuhrman C, Knollmann F, Klym A, et al. Pulmonary lobe segmentation in CT examinations using implicit surface fitting. IEEE Trans Med Imaging (2009) 28(12):1986–96. doi:10.1109/tmi.2009.2027117
11. Schmidt-Richberg A, Ehrhardt J, Wilms M, Werner R, Handels H. Pulmonary lobe segmentation with level sets. In: Medical imaging 2012: Image processing, 8314. San Diego, California, United States: SPIE (2012). p. 828–35.
12. Wang W, Kumar N, Chen J, Gong Z, Kong X, Wei W, et al. Realizing the potential of the internet of things for smart tourism with 5G and AI. IEEE Netw (2020) 34(6):295–301. doi:10.1109/mnet.011.2000250
13. Wang W, Chen J, Wang J, Chen J, Liu J, Gong Z. Trust-enhanced collaborative filtering for personalized point of interests recommendation. IEEE Trans Ind Inform (2020) 16(9):6124–32. doi:10.1109/tii.2019.2958696
14. Gerard SE, Patton TJ, Christensen GE, Bayouth JE, Reinhardt JM. FissureNet: A deep learning approach for pulmonary fissure detection in CT images. IEEE Trans Med Imaging (2018) 38(1):156–66. doi:10.1109/tmi.2018.2858202
15. Ukil S, Reinhardt JM. Anatomy-guided lung lobe segmentation in X-ray CT images. IEEE Trans Med Imaging (2008) 28(2):202–14. doi:10.1109/tmi.2008.929101
16. Doel T, Matin TN, Gleeson FV, Gavaghan DJ, Grau V. Pulmonary lobe segmentation from CT images using fissureness, airways, vessels and multilevel B-splines. In: Proceeding of the 2012 9th IEEE International Symposium on Biomedical Imaging (ISBI); May 2012; Barcelona, Spain. IEEE (2012). p. 1491–4.
17. Patil GU, Ponde S. Automatic segmentation of the pulmonary lobes from chest CT scans based on fissures, vessels and bronchi. Int J (2014) 2(6). doi:10.1109/TMI.2012.2219881
18. Bragman FJ, McClelland JR, Jacob J, Hurst JR, Hawkes DJ. Pulmonary lobe segmentation with probabilistic segmentation of the fissures and a groupwise fissure prior. IEEE Trans Med Imaging (2017) 36(8):1650–63. doi:10.1109/tmi.2017.2688377
19. Wang W, Yu X, Fang B, Zhao D-Y, Chen Y, Wei W, et al. Cross-modality LGE-CMR segmentation using image-to-image translation based data augmentation. IEEE/ACM Trans Comput Biol Bioinform (2022) 1–1. doi:10.1109/tcbb.2022.3140306
20. Chen J, Sun S, Zhang L-b., Yang B, Wang W. Compressed sensing framework for heart sound acquisition in internet of medical things. IEEE Trans Ind Inform (2022) 18(3):2000–9. doi:10.1109/tii.2021.3088465
21. Chen J, Chen L, Zhou Y. Cryptanalysis of a dna-based image encryption scheme. Inf Sci (2020) 520:130–41. doi:10.1016/j.ins.2020.02.024
22. Ronneberger O, Fischer P, Brox T. U-Net Convolutional networks for biomedical image segmentation. In: International conference on medical image computing and computer-assisted intervention. Springer (2015). p. 234–41.
23. Long J, Shelhamer E, Darrell T. Fully convolutional networks for semantic segmentation. In: Proceedings of the IEEE Conference on Computer Vision and Pattern Recognition. IEEE (2015). p. 3431–40.
24. Harrison AP, Xu Z, George K, Lu L, Summers RM, Mollura DJ. Progressive and multi-path holistically nested neural networks for pathological lung segmentation from CT images. In: International conference on medical image computing and computer-assisted intervention. Springer (2017). p. 621–9.
25. George K, Harrison AP, Jin D, Xu Z, Mollura DJ. Pathological pulmonary lobe segmentation from CT images using progressive holistically nested neural networks and random walker. In: Deep learning in medical image analysis and multimodal learning for clinical decision support. Springer (2017). p. 195–203.
26. Imran A-A-Z, Hatamizadeh A, Ananth SP, Ding X, Terzopoulos D, Tajbakhsh N. Automatic segmentation of pulmonary lobes using a progressive dense V-network. In: Deep learning in medical image analysis and multimodal learning for clinical decision support. Springer (2018). p. 282–90.
27. Gibson E, Giganti F, Hu Y, Bonmati E, Bandula S, Gurusamy K, et al. Automatic multi-organ segmentation on abdominal CT with dense V-networks. IEEE Trans Med Imaging (2018) 37(8):1822–34. doi:10.1109/tmi.2018.2806309
28. Ferreira FT, Sousa P, Galdran A, Sousa MR, Campilho A. End-to-End supervised lung lobe segmentation. In: Proceedings of the 2018 International Joint Conference on Neural Networks (IJCNN); July 2018; Rio de Janeiro, Brazil. IEEE (2018). p. 1–8.
29. Lee H, Matin T, Gleeson F, Grau V. Efficient 3D fully convolutional networks for pulmonary lobe segmentation in CT images (2019). ArXiv preprint arXiv:1909.07474.
30. Çiçek Ö, Abdulkadir A, Lienkamp SS, Brox T, Ronneberger O. 3D U-net: Learning dense volumetric segmentation from sparse annotation. In: International conference on medical image computing and computer-assisted intervention. Springer (2016). p. 424–32.
31. Tang H, Zhang C, Xie X. Automatic pulmonary lobe segmentation using deep learning. In: Proceedings of the 2019 IEEE 16th International Symposium on Biomedical Imaging (ISBI 2019); April 2019; Venice, Italy. IEEE (2019). p. 1225–8.
32. Lassen-Schmidt B, Hering A, Krass S, Meine H. Automatic segmentation of the pulmonary lobes with a 3D U-Net and optimized loss function (2020). ArXiv preprint arXiv:2006.00083.
33. He K, Zhao W, Xie X, Ji W, Liu M, Tang Z, et al. Synergistic learning of lung lobe segmentation and hierarchical multi-instance classification for automated severity assessment of COVID-19 in CT images. Pattern Recognition (2021) 113:107828. doi:10.1016/j.patcog.2021.107828
34. Khan S, Shahin AH, Villafruela J, Shen J, Shao L. Extreme points derived confidence map as a cue for class-agnostic interactive segmentation using deep neural network. In: International conference on medical image computing and computer-assisted intervention. Springer (2019). p. 66–73.
35. Isola P, Zhu J-Y, Zhou T, Efros AA. Image-to-Image translation with conditional adversarial networks. In: Proceedings of the IEEE Conference on Computer Vision and Pattern Recognition. IEEE (2017). p. 1125–34.
36. Oktay O, Schlemper J, Folgoc LL, Lee M, Heinrich M, Misawa K, et al. Attention U-Net: Learning where to look for the pancreas (2018). ArXiv preprint arXiv:1804.03999.
37. Milletari F, Navab N, Ahmadi S-A. V-Net: Fully convolutional neural networks for volumetric medical image segmentation. In: Proceedings of the 2016 Fourth International Conference on 3D Vision (3DV); October 2016; Stanford, CA, USA. IEEE (2016). p. 565–71.
Keywords: lung lobe segmentation, CT images, multi-stage cascaded network, edge enhancement, boundary response map
Citation: Bao N, Yuan Y, Luo Q, Li Q and Zhang L-B (2023) Edge-enhancement cascaded network for lung lobe segmentation based on CT images. Front. Phys. 11:1098756. doi: 10.3389/fphy.2023.1098756
Received: 15 November 2022; Accepted: 17 February 2023;
Published: 03 March 2023.
Edited by:
Jude Hemanth, Karunya Institute of Technology and Sciences, IndiaReviewed by:
Wazir Muhammad, Florida Atlantic University, United StatesCopyright © 2023 Bao, Yuan, Luo, Li and Zhang. This is an open-access article distributed under the terms of the Creative Commons Attribution License (CC BY). The use, distribution or reproduction in other forums is permitted, provided the original author(s) and the copyright owner(s) are credited and that the original publication in this journal is cited, in accordance with accepted academic practice. No use, distribution or reproduction is permitted which does not comply with these terms.
*Correspondence: Li-Bo Zhang, emhhbmdsaWJvLm5ldUBnbWFpbC5jb20=
Disclaimer: All claims expressed in this article are solely those of the authors and do not necessarily represent those of their affiliated organizations, or those of the publisher, the editors and the reviewers. Any product that may be evaluated in this article or claim that may be made by its manufacturer is not guaranteed or endorsed by the publisher.
Research integrity at Frontiers
Learn more about the work of our research integrity team to safeguard the quality of each article we publish.