 Hualu Shao
 Di Wang
 Baicheng Zhou1,2*
95% of researchers rate our articles as excellent or good
Learn more about the work of our research integrity team to safeguard the quality of each article we publish.
Find out more
ORIGINAL RESEARCH article
Front. Phys. , 24 January 2024
Sec. Social Physics
Volume 11 - 2023 | https://doi.org/10.3389/fphy.2023.1094659
It is necessary to study the relationship between the dynamical uncertainty and risk contagion in the financial market. In this paper, we use the Economic Policy Uncertainty (EPU) Index, calculate the stock index volatility of the top seven global economies in 2021, then construct a risk spillover network. For the sub-sample analysis, we select three different types of global crises to study the transmission direction and intensity within the risk network across each time period. The results show that firstly, EPU has both direct and indirect effects on risk contagion in cross-country stock markets. It mainly plays an intermediary role. Secondly, in the risk network, the intensity and structure are time-varying, no single country serves as the exclusive issuer or recipient of risk spillovers. Thirdly, the speed and impact of shocks from public health security crises are much greater. In light of the findings above, investors and policymakers in different countries are expected to strengthen cooperation in financial risk prevention and enhance risk early warning. And we provide new evidence to emphasize attention to shocks caused by public health events, aiming to prevent the recurrence of large cross-border financial risks.
In recent years, a series of “black swan” events, such as the financial crisis, the European debt crisis, the Sino-US trade friction and the outbreak of COVID-19, have led to an increasingly complex global economic future, increasing downward pressure on the economy and rising economic policy uncertainty. Under the severe and complex internal and external situation, the country has introduced flexible and diverse policy combinations to get out of the crisis, but the frequent policy adjustments have also further increased economic policy uncertainty [1, 2]. For example, the impact of the global COVID-19 epidemic in 2020, overlaid with the impact of the international oil price crash in March 2020, significantly increased the downturn risk and financial market uncertainty in various countries, and the U.S. stock market saw a rare continuous meltdown phenomenon. In response to the impact of global emergencies, the Federal Reserve and the European Union have taken “bailout” measures. Along with the synchronous follow-up of other countries’ policies, the global economic policy uncertainty (EPU) has deepened.
The EPU index reflects the relative frequency of the words economic (E), policy (P) and uncertainty (U) occurring in national newspaper articles, which is used to measure economic risk in a region [3]. Each month’s national EPU index is proportional to the percentage of articles done in that month’s national newspapers discussing economic policy uncertainty. The impact of the EPU index on macroeconomic limits has been widely studied in recent years, and it can trigger stock market fluctuation [4, 5], playing an increasingly important role in global risk contagion [6]. EPU is one of the causes of slow global economic growth, and when there is a high spillover of EPU risk, the performance of the real economy and financial markets deteriorates [7, 8]. Therefore, EPU can be used as a good predictor of economic development and financial market volatility. Currently, research on the spillover effects of EPU has focused on two aspects. On the one hand, the spillover and formation mechanisms around economic policy uncertainty itself across economies [9]. On the other hand, the relationship between economic policy uncertainty and systemic financial risk contagion is analyzed from the perspective of financial market correlation networks [10]. This paper starts from the second point.
Most financial crises are triggered in a few countries, which may spread to other countries for further global triggering. However, the definition of financial risk contagion has not been academically harmonized and is generally understood as the phenomenon of financial market disturbances spreading from one country to another mainly through exchange rates, stock prices, sovereign spreads and capital flows (mainly downturn disturbances). It has also been argued that financial risk is a phenomenon in which one country’s assets follow a sharp decline in another country’s relevant assets [11] is a “net contagion” that removes systemic externalities such as common shocks, fundamental correlations, and heterogeneous shocks [12], and is a phenomenon in which financial risk linkages increase during periods of financial system risk [13]. With the expanding trend of economic globalization and deepening financial integration, the volatility of financial markets across countries has become increasingly correlated and connected into a global network [14]. As for the stock market, individual stock market risks are no longer confined to the market where they erupt, but are rapidly contagious to other markets and continue to amplify globally.
Although there are studies discussing the impact of EPU on stock market risk spillovers, however, there is less literature analyzing the role of EPU in cross-contagion among risks in major global stock markets by considering EPU shocks in the analysis of stock market correlation networks. In addition to economic factors (E, financial crises), policy factors (P, policy instability such as geopolitical conflicts, terrorism and migration crises) and public safety health uncertainty events (U) can also interact with EPU [15]. In addition, existing literature has compared the 2008 financial crisis with the covid-19 crisis [16], and there are also separate studies on the impact of EPU on macro economy brought by Brexit [17–19]. However, there are few studies comparing three kinds of crises (such as financial crisis, political crisis, public health crisis) and how they differ in the risk contagion of stock market.
To fill the above-mentioned research gaps, this paper constructs a network structure chart that can dissect the global equity risk spillover effects through the extreme differential volatility indexes of the global major economies’ stock markets. The sliding window technique is then used to explore the risk spillover effects of global stock markets under economic policy uncertainty shocks in two dimensions, static and dynamic, respectively. Finally, three representative and different types of crises are selected to construct EPU and stock market risk contagion networks, and the differences between individual time periods are discussed in separate samples.
This paper analyzes seven stock markets in Asia, Europe, and the Americas from 5 January 1998, to 22 April 2022, for a comparative study. The main contributions are obtained as follows. Firstly, we compare and analyze the stock market risk spillover index with and without the EPU index to visually and statically discuss the role EPU plays in stock market risk contagion. Secondly, the total spillover index, directional spillover index (From index, to index), and net spillover index of EPU and stock market risk are measured over the full sample. Based on the intensity and size of risk contagion, we dynamically analyze the role of EPU in risk contagion in the global stock market and discuss the temporal classification of three crises. Finally, we select representative crises (2008 financial crisis, 2019 Brexit, and 2020 COVID-19) and divide the full sample into three time periods (during the international financial crisis, during the global political risk, and during the global public health security event) to draw a risk spillover network diagram of the global EPU and international stock markets. The impact of EPU on the stock market of each country under the three crises is analyzed.
The remainder of the paper is organized as follows. Section 2 is the mechanism of action. Section 3 is the research methodology. Section 4 is the data and empirical analysis, which is discussed for the full sample and sub-samples, respectively. Section 5 is the conclusion.
First is the role of the inter-stock market. There are currently three main channels of action for financial risk contagion, one is the trade channel, which is the main contagion channel for systemic financial risk contagion [20]. The depth of a country’s presence in the trade network represents the strength of the country’s level of financial risk contagion [21]. Direct bilateral trade contagion refers to two countries that trade very closely, and when a financial crisis occurs in one country, the economic variables of its trading partners also change, which in turn affects the economy in terms of risk contagion. Indirect multilateral trade is more common in the market (especially in developing countries and emerging markets) and requires the use of third-party markets as a transmission medium (mostly in developed countries). The second is the financial channel, mostly via financial institution contagion, which refers to the risk contagion that occurs when the country at the source of risk contagion sells its holdings of other countries’ financial assets in order to avoid excessive liquidity constraints in itself, thereby making other countries’ financial assets illiquid due to devaluation. The asset structure of financial institutions initially works in concert with the convergence of risk diversification factors (e.g., large swaps, etc.) and short-term debt (financing structures), which exacerbates the contagion of crises and triggers financial market risk [22]. The third is the expectations channel, which is seen as the aggregation of all channels other than the two mentioned above. It can be divided into economic expectations, political expectations, cultural similarities, and herd effects (also known as net contagion effects). The most research is based on the herd effect, which is a non-contact contagion effect that refers to irrational investors whose sentiments are influenced by herd mentality to produce pessimism and make decisions that are synchronized with the herd thereby leading to financial risk outbreaks or contagion, triggering sustained negative effects [23–25]. Herd effects are highly likely to lead to volatility in financial markets and lower prices of financial products, which in turn undermine market confidence, amplify financial panic, and exacerbate net global risk contagion.
The second is the mechanism of EPU’s direct and indirect action on the inter-stock market. One is the direct action. The discounted future cash valuation method in modern financial theory suggests that stock prices are the net present value of future cash flows. When EPU increases, the investment heart of market participants will be affected, generating pessimistic investor sentiment about future dividends and discount rates. In addition, the herd mentality of market participants makes the behavior of most investors deviate, which will promote the spread of stock market risks [24, 25]. The other is EPU’s mediating role [26], which affects the stock market through the channels of corporate investment and household consumption. For example, when uncertainty is too high, it can lead to a decline in the stock market prices of a country causing a deterioration in the asset position of investors in that country, which is likely to undermine macroeconomic performance [27]. Specifically, uncertainty can lead to risk contagion by affecting the income of the population and the price of the currency. On the one hand, when economic policy uncertainty causes a crisis in a country’s stock market, the economic fundamentals of that country likewise decline and the disposable income of the population decreases. At this time, consumer demand for imported goods decreases, which affects the sales balance of the commodity-exporting country, leading to a decline in expected earnings during this period, and the contraction in sales may even affect the liquidity of the country’s importers, causing a liquidity crisis and ultimately a decline in the valuation of assets in the stock market of the trade-related country [28]. On the other hand, a stock market crisis in one country due to economic policy uncertainty may also cause a fall in the price of the country’s currency, making domestic goods less expensive compared to imported goods, undermining the competitiveness of imported goods, reducing their sales share in the country’s market, and similarly causing a contraction in the sales balance of importers, thus transmitting domestic risks to other countries. Factors such as currency depreciation, exchange rate movements, and trade spillovers can facilitate the international contagion of financial risk through the trade channel [29, 30]. According to the real options theory perspective, corporate investment and household consumption behavior can be viewed as real options that decision makers can acquire in order to have the right to invest and consume in the future. At this time, investors will pull out of foreign investments, causing a decrease in the liquidity of other countries’ stock markets, and asset prices begin to fall under the influence of supply and demand. At the same time, a decrease in the liquidity of a country’s stock market causes institutional investors in that country to reduce the proportion of their investments abroad, which in turn transmits risk abroad, leading to financial risk contagion.
Finally, the extent of shocks to EPU and stock market risk varies across different types of crises. It has been found that the interaction between EPU in the U.S. and stock returns in China and India is weak in the short run, but gradually increases in the long run, which is especially true when major financial events occur. Due to the covid-19 epidemic, EPU reached a new height, which further increased the impact on the level of financial risk contagion [31]. The correlation between EPU and financial network was significantly enhanced during COVID-19 [9].The total spillover index of the global stock markets during COVID-19 is significantly greater than that during the 2008 global crisis [16]. Brexit will increase the risk uncertainty of the UK, which will significantly reduce the correlation between the stock market and the stock markets of European countries [32]. Taking the 2008 financial crisis, Brexit in 2016, and COVID-19 in 2020 as examples, EPUs in different crises have different impacts on stocks. This paper will verify the specific differences.
There are six main research methods for risk measurement: linear correlation coefficient, VAR model, GARCH model, Copula function, CoVaR model, and Diebold and Yilmaz spillover index model. The linear correlation coefficient method compares whether the correlation coefficients of financial market returns change significantly during the financial crisis period and the smooth period to determine whether there is risk spillover in financial markets [33]. The VAR cointegration test and Granger causality test analyze the risk spillover in financial markets by estimating the dynamic relationship between variables [34]. However, these two methods are not suitable for the complex non-linear risk contagion relationship between financial markets. The multivariate GARCH models, led by the DCC-GARCH model [35], are the most widely used because they can well describe the volatility spillover effect and information transmission process. The CoVaR model treats the financial system as a whole and measures not only the size of risk spillovers among financial institutions, but also the contribution of one market or institution to the systemic risk of the financial system as a whole [36]. Copula can effectively explain the multivariate dependence structure [37, 38]. The Diebold and Yilmaz spillover index model has received a lot of attention from academics for its quantitative accuracy. The model is able to measure the size and direction of risk spillover, which makes up for the shortcomings of Copula [39]. It is also more intuitive to see how risk spillover (contagion) effects change in the time dimension and does not depend on the order of variables [40], and has been more widely used.
In this paper, we aim to analyze how economic policy uncertainty influence the global stock market risk. First, stock market risk is measured, and the correlation among it must be estimated. We follow the VAR models based on a generalized VAR framework by This method parses the forecast error variance into parts that are attributed to various shocks. The variance decompositions can show us how much of the future uncertainty of a variable of interest is caused by the shocks from other variables. The methodology is described as follows.
First, the N-variable VAR(p) model is:
This expression can be transformed it into a moving average process as equation:
where
Next, to obtain variance decompositions which are invariant to variable ordering, Diebold and Yilmaz (2012) utilize the generalized VAR framework (Koop et al., 1996, Pesaran and Shin, 1998). They propose the H-step-ahead forecast error variance, which can be viewed as:
where
Because the shocks to each element in the system are not orthogonalized, the row sum of the elements of the variance decomposition matrix
The normalized variance decomposition is given by:
Where
Based on the above, Diebold and Yilmaz (2012) propose the total spillover index. It is defined as the share of variance contributed by cross forecast errors other than own forecast errors, it can be utilized to measure the spillover of the whole system. Is calculated as shown in the following equation:
The directional spillover received by element i from all other elements j is defined as:
In a similar way, we can calculate the directional spillover transmitted by element i to all other elements j as:
The net spillover can be simply calculated as the difference between the overall spillover it contributes to other objects and that it receives from others, as shown in the following equation:
In this paper, the stock market indices of seven major global economies (U.S., China, Japan, Germany, U.K., India, and France) are selected as the research sample. These seven countries are the seven biggest economies in 2021, and the sum of the total economic volume accounts for 61.6% of the world in 2021. Both developed markets and emerging markets are comprised, as shown in Table 1.
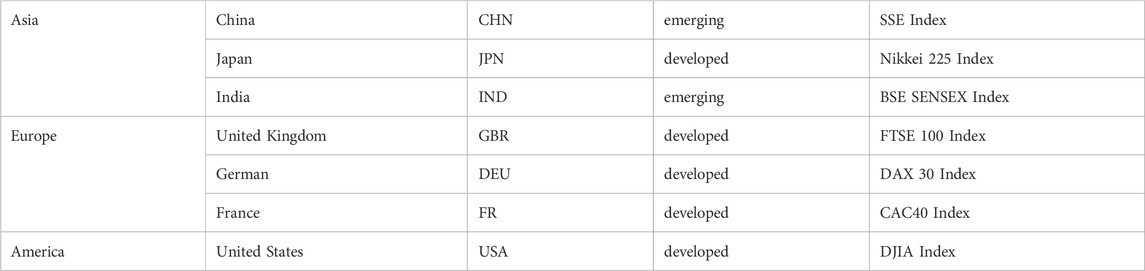
TABLE 1. Stock market Index selection.
The sample data is from 5 January 1998 to 22 April 2022, with a total of 4,972 daily observations. And the full sample period is divided into three sub-samples. The first sub-sample is during the global financial crisis (exemplified by the US subprime mortgage, period 1: 4 January 2007 to 29 December 2009). The second sub-sample is during the global political period (exemplified by Brexit, period 2: 1 April 2019 to 23 January 2020). The third sub-sample is during the global public health security crisis (exemplified by COVID-19, period 3: 6 January 2020 to 22 April 2022, with a special study of 6 January 2020-30 April 2020). We use R Studio and Python 3.7 software for research. The stock market index data were retrieved from the Wind database, the EPU index data was retrieved from http://www.policyuncertainty.com/index.html.
Data processing as follows:
(1) Following Diebold and Yilmaz (2009), we estimate stock market risk by stock return volatility:
(2) To avoid endogenous influence, we use the log EPU Index (Based on PPP-adjusted GDP) for first-order difference. Then, refer to the log return rate of the stock market, we have:
Table 2 shows the descriptive statistics of the data. It shows that the EPU index has the highest volatility, which corresponds to the risks associated with the global economy and politics. And the stock markets in India, Germany, and China are more volatile than others, indicating to some extent that the stock markets in emerging markets are less stable. France has the least volatile stock market, followed by the stock markets of Japan, the United Kingdom, and the United States. These four countries are ranked in the top four globally according to total stock market capitalization, and we believe that the larger the total market capitalization, the more resilient the stock market is to risk. The Augmented Dickey-Fuller test values are significant at the 1% and 5% levels, indicating that all variables are stationary.
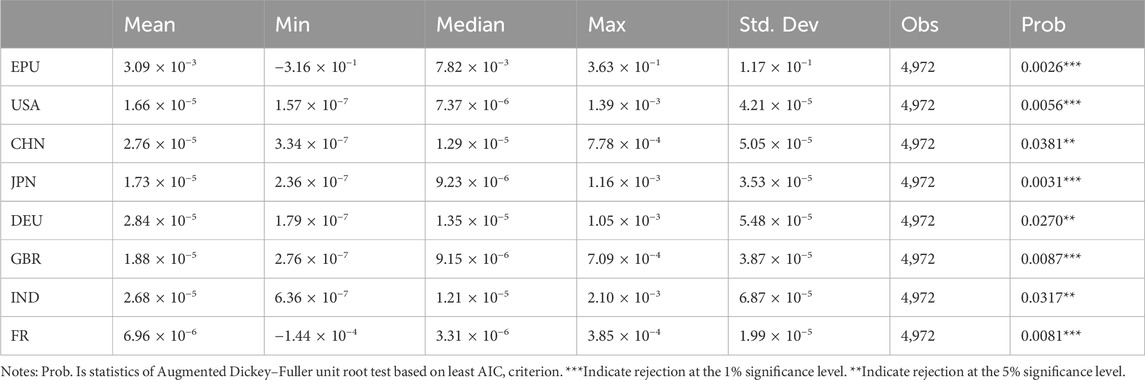
TABLE 2. Descriptive statistics of variables.
In this section, we explore the relationship of risk spillover effects among international stock markets under EPU shocks based on the DY (2012) spillover index model, and the results are shown in Table 3.
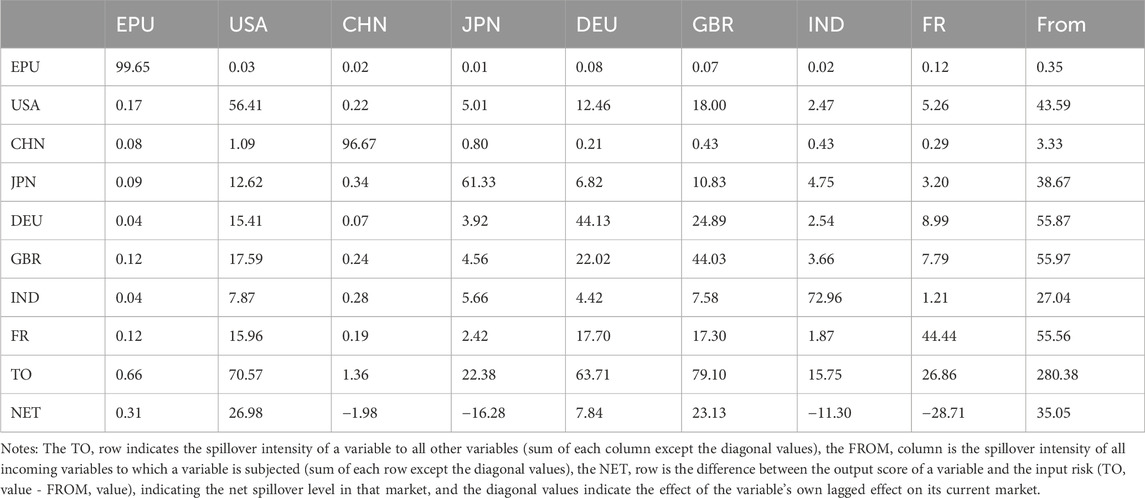
TABLE 3. Full-sample spillover indices (EPU and stock market).
In Table 3, in terms of risk spillover effect (TO row), the UK stock market risk spillover effect is the maximum (79.1%), followed by the US and Germany with 70.57% and 63.71%. Comparing the EPU risk spillover effect on the stock market, it is found that the UK and US stock markets are subject to the highest EPU spillover intensity of 0.12% and 0.17% respectively, which proves that these two markets are more vulnerable to the global EPU impact. And the spillover effect of stock markets of these two economies to EPU index is relatively more significant, which is mainly due to the impact of EPU, the governments of these countries quickly adjust various economic policies that inhibit their stock markets, and even take some extreme measures, leading to further increase of economic uncertainty in the global economy. To some extent, this indicates that the UK and US stock markets are the main sources of risk spillover from the global stock market. In terms of risk spillover effects (FROM column), the UK, Germany, and France are most likely to receive risks from other countries’ stock markets, with spillover indices reaching 55.97%, 55.87%, and 55.56% respectively. This suggests that European market country regulators should pay more attention to the monitoring and prevention of risks in global stock markets. In terms of spillover direction (NET row), China, Japan, India, and France have negative net spillover effects (−1.98%, −16.28%, −11.30%, and −28.71%) and are net recipients of risk spillover from international stock markets. The U.S., U.K., and Germany have positive net spillover effects (26.98%, 23.13%, and 7.84%) and are net exporters of risk. Among them, the US and the UK are also the most vulnerable to EPU shocks among international stocks, and they are both risk takers and risk exporters. From the diagonal of spillover effects, EPU index and the Chinese stock market are highly affected by their own lagged effects with values as high as 99.65% and 96.67%, indicating the persistence of stock market risks on the Chinese market and EPU.
Next, we calculate the network spillover effects of international stock markets without the EPU index, as shown in Table 4. When EPU index is not taken into account, the intensity of risk contagion in the UK, US, and German stock markets remains at the top. However, the spillover index improves by 0.71% in the UK, decreases by 0.27% and 0.07% in that of Germany and the US. This indicates that there is a correlation network between EPU and international stock markets, and that EPU is able to absorb a limited amount of risk from other markets, which, combined with the correlation network, makes its risk spillover intensity greater, eventually causing a corresponding increase in the TSI within the network (280.38%–280.40%). Comparing Table 3 and Table 4, we find that the change in the risk spillover effect in the international stock market is not much related to the inclusion of EPU, the main reason being that EPU acts as an intermediary in the risk contagion in the international stock market. As to the full-sample network diagram shown in Figure 5, it can be seen that EPU index has the smallest spillover effect, which also confirms that EPU tends to act as an intermediary in the international stock market risk contagion process. On the one hand, EPU generates shocks to the stock market risk of each country. On the other hand, EPU also bears the shocks generated by the stock market risk of each country accordingly, i.e., in the process of stock market risk contagion among countries, countries will make economic policy changes in order to prevent and control the risk, and frequent adjustment of economic policies will also exacerbate the stock market risk among countries to a certain extent, thus generating a circular effect.
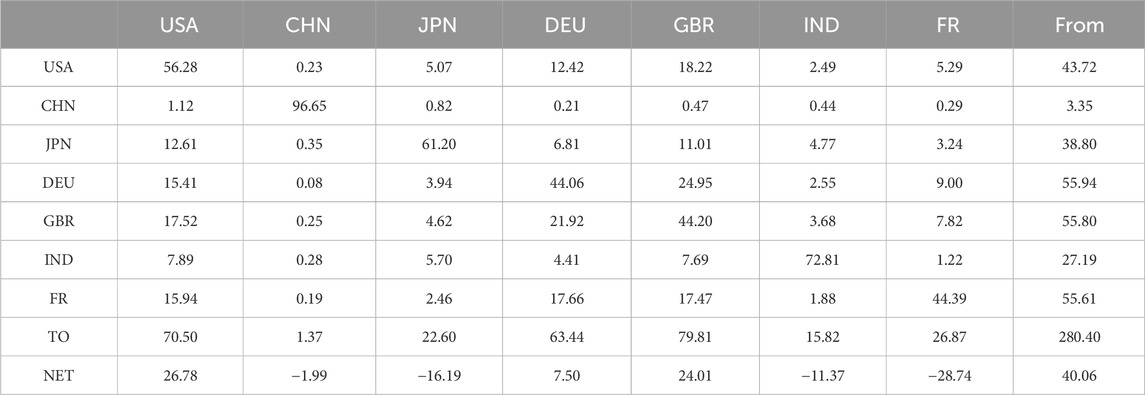
TABLE 4. Full-sample spillover indices (only stock market).
After examining the static effects, we have a preliminary grasp of the volatility information transmission relationship between the EPU index and international stock markets. This section further examines the dynamics of information transmission among the variables and the level of correlation by measuring the total spillover index, FROM index, TO index, and NET index for the full sample period. The sliding window width is 200 and the forecast step is 10. The dynamic spillover plot drawn can examine how the risk premium of each variable changes over time, and the dynamic spillover charts are shown in Figures 1–3.
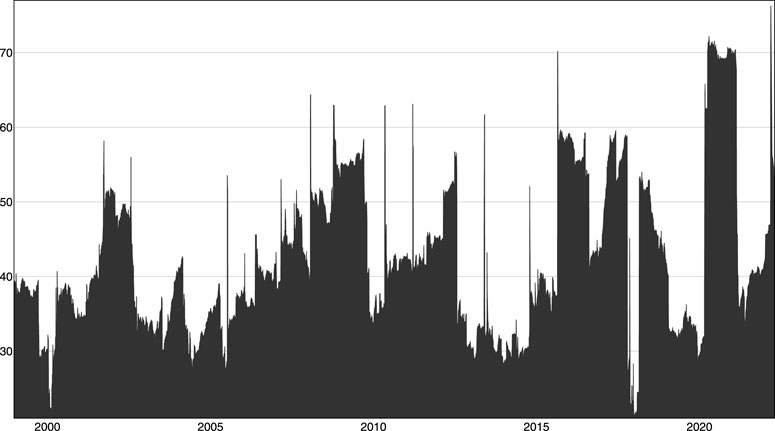
FIGURE 1. Total spillover index.
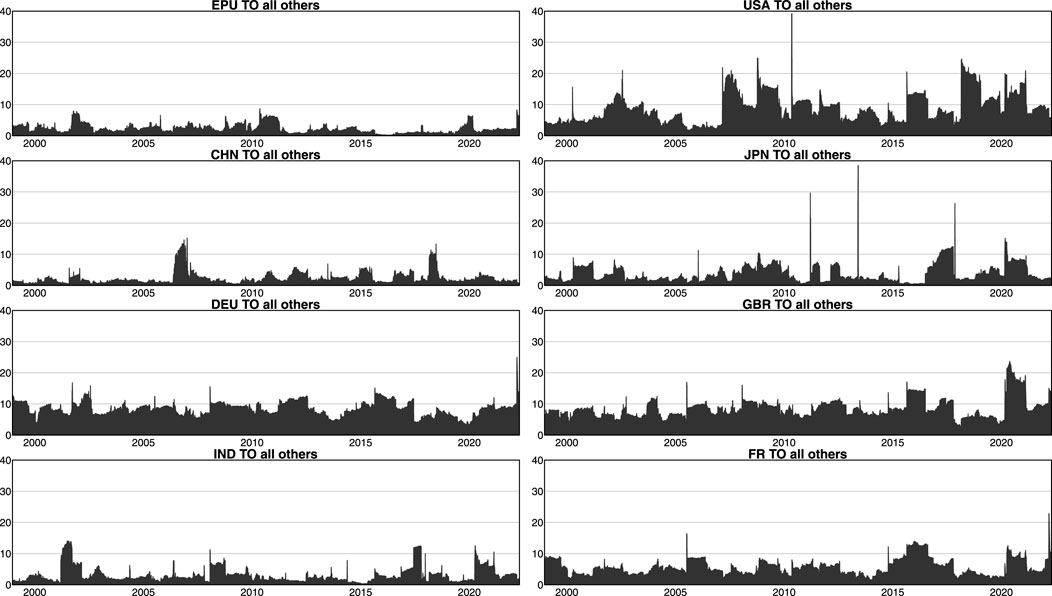
FIGURE 2. Directional spillover index (TO Index).
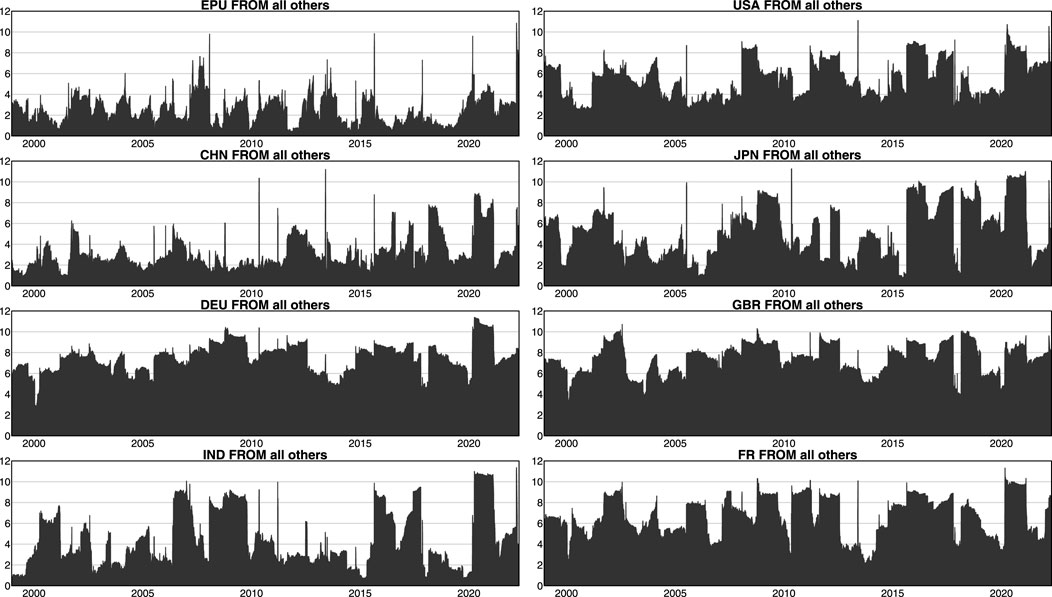
FIGURE 3. Directional spillover index (FROM Index).
Figure 1 shows the changes in total spillover indices (TSI, hereafter). The TSI does not have a long-term trend throughout the sample period, but has a cyclical character in the short term. According to the TSI’s peaks, we divide Figure 1 into four cycles. The first is from November 2002 to July 2003, during which the total spillover index continues to rise until it exceeds 50%, which is already larger than the average level during the sample period. This period was mainly due to the SARS outbreak that causes a sudden global health public event, which leads to a significant increase in global EPU and increased the spillover effect among national stock markets. After this period, the TSI starts to decrease, but always with significant cyclical fluctuations. The second was from January 2007-December 2009. In January 2007, HSBC Holdings increased for the first time the amount of provisions for U.S. subprime housing credit by an additional amount and issued a warning of a possible significant increase in provisions. The outbreak of the U.S. subprime mortgage crisis brought the total risk spillover effect to over 60%. The period was characterized by enhanced global EPU index, severe turmoil in international financial markets and significant risk spillover effects in national stock markets. The third is in 2016–2017, a period when events such as the Brexit referendum and the official inauguration of Donald Trump occurred, followed by ongoing trade frictions between the U.S. and China. The TSI grows at a rapid rate in this cycle, peaking at one point at over 70%. The fourth began in 2020 with the outbreak of COVID-19. The outbreak development dynamics were unclear at the beginning, countries did not have an effective response strategy, and EPU increased significantly. Capital markets are negatively impacted by panic, with high levels of cross-border risk contagion in global stock markets and an increasing TSI that significantly exceeds 70%. This high risk has continued throughout 2020, the intensity of this public health security event is much greater than that of SARS. In the four cycles, we find that the duration and the volatility are decreasing, and the four TSI peaks are gradually increasing. This is because the TSI accumulates faster than it abates. Specifically, when faced with a shock, the total spillover effect appears to jump sharply in the short term, and the risk accumulates rapidly. After reaching the peak, the risk contagion does not disappear immediately but takes some time to return to a more stable level, which indicates that the spillover effect is persistent. Therefore, EPU and international stock markets always have to control some crises so that they are internally and not transmitted outward, so the peak of the total spillover effect will increase over time.
Figure 2 displays the dynamics of risk spillovers in EPU and international stock markets. First, we find that U.S. stock market shows strong dynamics in risk spillovers, indicating that the U.S. is the most important source of risk contagion in the stock market, especially during important short periods of major economic policy changes, such as 2007–2010, 2016–2021, etc. It means the U.S. is the discourse and dominance of the U.S. in the global economy. As an important partner in the import/export trade and business transactions of most countries, the U.S. stock market volatility can spill over to international stock markets through foreign trade and capital flows. It also indicates that as an international financial center, if the U.S. is hit by an unexpected event that triggers a plunge in its stock market, the strong risk spillover effect of U.S. stocks will inevitably lead to risk contagion to other countries, which in turn will trigger global capital market turmoil. Second, the risk spillover effects in the German and U.K. stock markets are quite stable and the data are similar. It indicates that a steady state has been formed among European intra-stock markets, and although there is a certain amount of risk spillover, the amount of change is relatively small. Third, China, Japan and India stock markets have less risk spillover effects to the outside world, which indicates that Asian stock markets do not dominate the global stock market. Although emerging stock markets rank higher in the world in terms of total market capitalization, other strengths still need to be enhanced. Finally, we find that the spillover effects in all seven subplots of Figure 3 except China increase extremely rapidly around 2020 and fluctuate more in the period afterward. It suggests that a public health security event in 2020 (COVID-19) has a significant global impact and brings a great deal of uncertainty, with a higher effect than any of the previous events. It also indicates that China is very effective in preventing and controlling COVID-19.
Figure 3 indicates the dynamics of risk spillover for EPU index and international stock market risk. It can be seen that the German, UK and French stock markets are all characterized by a high risk premium-in, even higher than that of the US. This is inextricably linked to the occurrence of events, such as the European debt crisis and Brexit in the European market in the context of global economic integration. In contrast, China and India, both developing countries, and China and Japan, both in Asia, show weak spillover effects and are the main bearers of risk contagion in international stock markets.
The intensity of stock market risk contagion is analyzed in the above discussion. Figure 4 illustrates the dynamic diagram of EPU index and the net spillover effect of risk in the international stock market. In this part, we discuss the direction of risk contagion is explored in terms of the net spillover effect, and then the position of each variable in risk contagion. If the spillover effect is greater than the spill-in effect, the net spillover index is positive and the market is a net risk exporter. And vice versa, a net risk taker. From the perspective of important time points, the U.S. stock market exhibited strong net risk spillovers during the 2008 subprime crisis and during the 2020 COVID-19. The global economy was in a downturn during the subprime crisis period and coupled with the U.S. stock market shock and the collapse of large financial institutions, the abnormal volatility in financial markets led to frequent monetary and fiscal policies by national authorities. COVID-19 began a massive outbreak in March 2020 in the United States, becoming the center of global stock market risk spillovers after hitting the meltdown mechanism four times in a row in 2020. The development of the epidemic continued to sweep through Europe, with net risk spillover from negative to positive in France, the UK, Germany, and other European countries, indicating that European stock markets gradually evolved into a major spillover center for global stock market risk. China, Japan, and India became net risk takers at one point. Moreover, after 2016, the US and European stock markets are the net risk spillover end, while the EPU has a negative net risk spillover with Asian market stock markets. The risk spillover from Europe and the US is greater than that from other regions due to the Brexit and Sino-US friction around 2016.
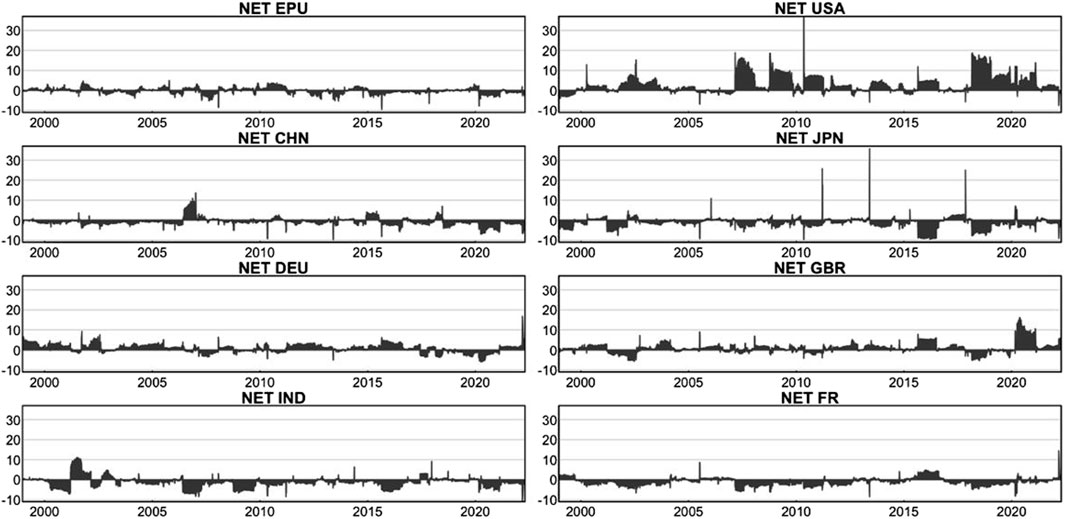
FIGURE 4. Net spillover index.
Figure 5 displays the full sample network. It shows that the European stock market, represented by the UK and Germany, and the US stock market are quite closely linked to each other. Developed stock markets are the main risk exporters and importers. In addition, German and UK stock markets have the strongest risk linkages, indicating that stock markets within the EU have become more strongly correlated. China is the least risk-exporting and risk-importing country. What’s more, the global EPU index also plays the smallest role during the full sample period, which is consistent with the illustration in Figures 1-4.
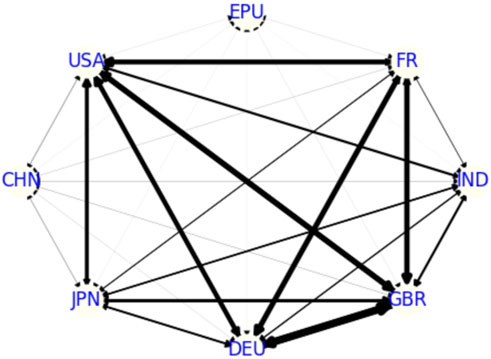
FIGURE 5. Full sample network (January 1998 to April 2022).
In summary, we find that the total spillover index, FROM index, TO index, and net spillover index do not have long-term characteristics over the full sample period, but all have short-period volatility. The U.S. is the largest risk spill-from and spill-to country globally. The European countries have seen the same increase and decrease in risk, proving that EU economic integration has been very successful. For the most part, the Chinese and Indian stock markets have neither had a great deal of export risk nor have they taken many risks. But this situation is getting better, which proves that the capacity of emerging markets is improving. However, the spill-from and spill-to effects of the global EPU index in this section are not sufficiently pronounced over the full sample time. We argue that EPU plays a mediating effect, indirectly linking risk to stock markets. The next section discusses the full sample in three sub-samples to look at risk contagion more intuitively.
Based on the study above, this section divides the full sample into three representative time periods to further investigate the risk contagion in international stock markets under EPU. The three subsamples are the period of global financial crisis (Period 1: 2007.1.4-2009.12.29, exemplified by the 2008 financial crisis), the period of global political risk (Period 2: 2019.4.1-2020.1.23, exemplified by the Brexit referendum), and the period of global public health security (Period 3: 2020.1.6–2022.4.22, exemplified by COVID-19, especially 2020.1.6-2020.4.30). Table 5 shows the reason for the chosen date, which considered our research objectives, data availability, and the major events.

TABLE 5. The chosen date in Sub-sample.
In addition, this section constructs a pairwise spillover network of EPU and global financial market risk spillover using EPU and 7-country stock market as network nodes, the risk spillover index derived from DY decomposition as the connected edge of the network, and EPU and market risk spillover direction as the direction of the connected edge. The corresponding network diagrams of the full sample and the three sub-samples are shown in Figures 7–9. The thickness of the connecting lines in the picture indicates the correlation size between the nodes, and the thicker the line, the stronger the correlation between the two nodes.
Figure 6 shows the total spillover index (TSI) for the three subsample periods. Figure 6A is the financial crisis TSI, Figure 6B is the political risk period TSI, and Figure 6C is the public security crisis TSI. As can be seen, in terms of TSI volatility, the risk TSI fluctuation of the financial crisis has a continuous fluctuation, and when the subprime crisis first broke out in 2008, its TSI spiked from less than 40% to nearly 65%, and then the TSI value has continued to be high (around 50%). And the TSI has been rising slowly, showing the asymmetric characteristics of fast accumulation and slow decay. In terms of TSI peaks, public safety and health crises have the largest TSI values, up to about 70%, and are very stable over the duration, after which they quickly revert to a steady state. In contrast, the TSI value of political risk period is generally around 37%, holding a constant decay, indicating that the political risk period factor has a weaker and smoother effect on the risk contagion of EPU and global stock market.
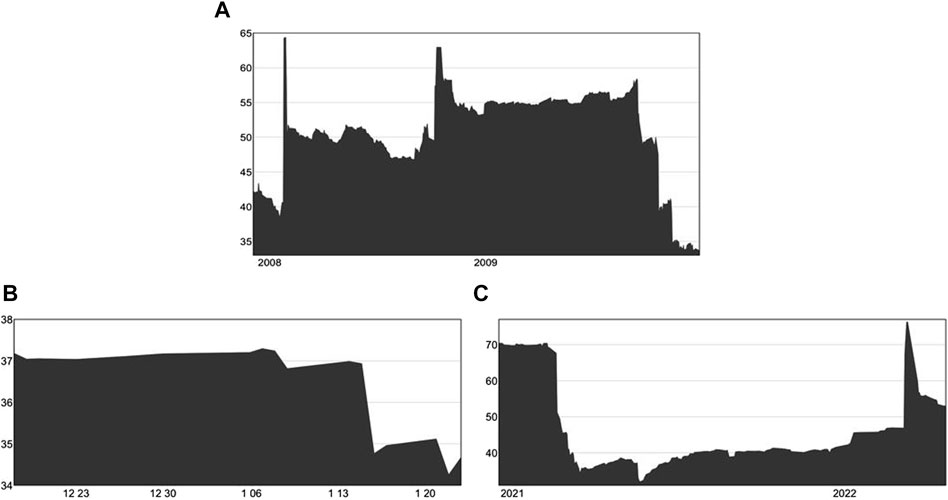
FIGURE 6. Three-period TSI. (A) The financial crisis; (B) The political risk period; (C) The public security crisis. Note: The second sub-sample duration is brief. In order to provide a clearer representation, the horizontal axis in Figure6(B) has been labeled with specific dates instead of years.
Therefore, the risk spillover impact of public safety events on EPU and global stock markets is rapid and violent. The EPU brought about by financial crises is more complex, and the factors acting on the stock market are long and high level, with asymmetric characteristics. Political risk crises, exemplified by Brexit, bring a relatively homogeneous EPU boost in the short term, but do not act as strongly on global stock markets as the other two crises. We will analyze the risk contagion within each time period through network diagrams in the next subsections.
Figure 7 shows the correlation network diagram during the global financial crisis. It can seen that during the subprime crisis, the US was the largest risk exporter (102.38%) and its risks were most imported to France (25.56%), Germany (22.42%), the UK (20.53%), and Japan (20.47%). These risk-taking countries are mainly concentrated in European markets, with significant spillover effects between the UK and German stock markets (more than 20%), proving the existence of risk contagion effects across markets within major European stock markets as well. However, the US stock market has the weakest spillover effect on Chinese stock market risk, with a risk spillover effect of only 0.93%. Chinese stock market also receives the lowest value of risk input from other countries (3.78%), with the highest being stock market in Japan (1.00%) and the lowest being Germany (0.13%), followed by the UK (0.10%). In addition, stock market in China exports very little risk to other countries’ markets (1.34%), as does that in India, also as an emerging market economy, not being a major risk importer and exporter. Moreover, the U.S., French, and Japanese stock markets are the most vulnerable to EPU risk spillovers, and their market risks also influence the global EPU to accelerate risk contagion across markets. It can be seen that during the U.S. subprime mortgage crisis in 2008, the U.S. was the leading risk exporter and importer of global stock markets, with positive risk contagion effects on all other countries. There are more stock market linkages among developed stock markets due to their key position in international trade and capital flows, making them the main importers of stock market risk and also more vulnerable to economic policy uncertainties. Emerging stock markets, led by China and India, remain less linked to other markets, despite their high aggregate market capitalization globally. Compared to the full sample period, EPU played a larger role during the global financial crisis.
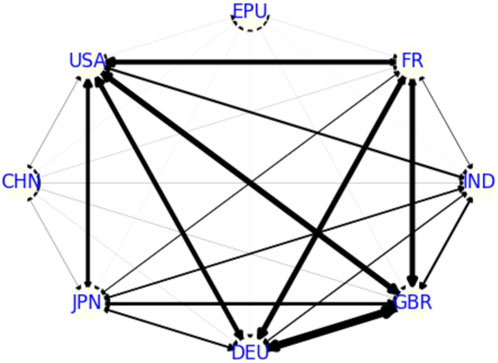
FIGURE 7. Period 1 network.
Figure 8 shows the global political risk period network. It can seen that EPU is the most dominant risk spillover country in this period (67.16%) compared to other periods. The most risk from EPU flows to countries such as Japan (20.80%) and the United States (12.59%), and very little to the stock markets of countries in the European region (below 5% on average). At the same time, Japan is also the largest risk importer (51.48%), followed by European country regions (above 40% on average). Otherwise, spillovers between other international stock markets are significantly lower than during the subprime crisis. The possible reason for this is that the stock markets of European and American countries were exposed to great risks after the events of the Brexit referendum in 2016 and the coming to power of Trump in 2017. It is worth mentioning that European countries belonged to the period when they were absorbing risks internally and did not spill over much. Political risk crises can directly lead to a rise in global EPU, using global EPU as an intermediary to spread the risk to other countries. During the US-China trade friction, the US restrained China through Japan. In Figure 8, the line between China and the U.S. is thin, and the line between EPU and China, the U.S. and Japan is thick, indicating that EPU not only has an intermediary role, but also can act as a driver of risk.
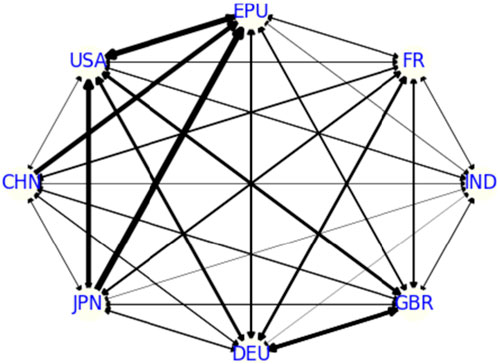
FIGURE 8. Period 2 network.
The two images in Figure 9 are the measurement of the sample period of the epidemic, which can be seen to be significantly different from the previous two crises. We start with the worst period of COVID-19, i.e., Figure 9A, 2020.1.6–2020.4.30 just after the outbreak. First, that the risk contagion effect is strong in both EPU index and international stock markets, with the US no longer being the largest risk exporter (109.62%) and importer (84.07%). The largest risk exporter was France (114.33%), which was also the largest net risk exporter (34.52%), which had a severe epidemic and a vulnerable stock market at the time. The largest risk-importing country was Germany (91.72%), followed by India (85.85%) and the UK (85.61%). Second, China ceased to be the country with the smallest risk spillover effect during the new crown epidemic and started to play a significant role in the risk contagion in the global stock market. The smallest risk exporter is Germany (65.34%), which suggests that Germany absorbed risk very well during the epidemic. Third, compared to other periods, the EPU risk spill-to effect during the new crown epidemic was the most pronounced (90.41%) and the net spill-from effect was the smallest (−36.40%). It demonstrates that the shock of global public health safety event raised much uncertainty, and EPU transmitted risk in a combination of direct and intermediary roles in the global stock market network.
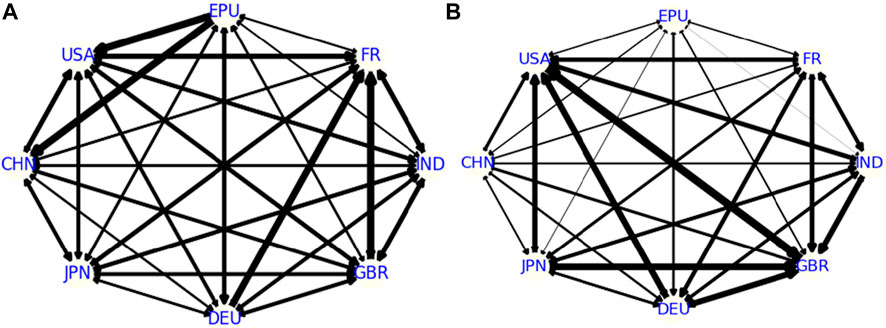
FIGURE 9. Period 3 network. (A) Just after the pandemic; (B) In a longer period.
Figure 9B shows the network from 2020.1.6 to 2022.4.22. It can be seen that since the outbreak of COVID-19, the main global stock market risk contagion is very close, and the importance of countries in the risk contagion network is much greater than during the financial crisis and the political risk period. The largest risk export side is still concentrated in the European and American markets, respectively in the U. K. (132.76%), the U. S. (124.64%) and Germany (81.62%). The same is true for the risk import side. What’s more, stock markets in the U.K. and the U.S. are also the largest positive net risk spill-from sides (65.25%, 62.10%). In contrast, Chinese stock market and EPU are the largest negative net risk side (−41%, −26.52%), indicating that both have much more risk input than output during this period. However, EPU is weaker for the stock market than during the outbreak of COVID-19 (which can be seen in Figure 9A). We can see that stock market risk contagion in Figure 9B is weaker than that in Figure 9A. The possible reason for this is that the global EPU and stock market risk networks suffered a huge and rapid shock when COVID-19 initially wreaked havoc on the global macroeconomy, and after a recovery period of about 2 years, it can be seen that the global EPU and stock markets have networked to absorb some of the risks.
The empirical analysis is based on a forecast step of 10 and a sliding window period width of 200. In order to avoid the influence of the forecast step and sliding window selection on the empirical analysis, forecast steps of 8 and 12 and sliding window period widths of 150 and 250 are further selected for robustness testing. It is found that the trends of the dynamic change graphs of economic policy uncertainty and the total spillover effect of stock market risk are consistent, as shown in Figures 10, 11. In addition to this, different orders of the benchmark VAR of the spillover index model are also considered, and the lag 2- lag 6 are chosen to be tested together. The results show that the dynamic trends of the total spillover effect at different orders are also largely consistent, as shown in Figure 12. It indicates that the change of forecast step and the sliding window does not change the empirical conclusion, and the research in this paper is robust.
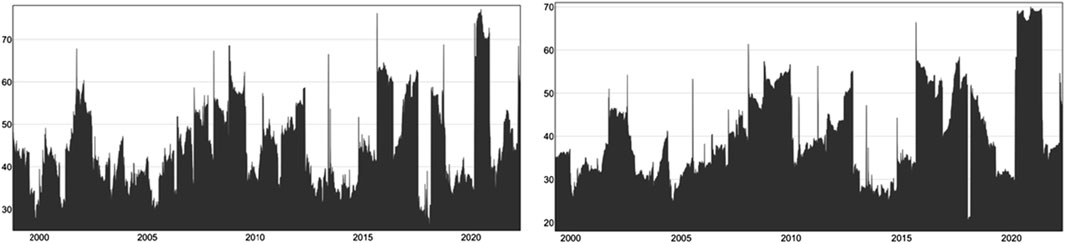
FIGURE 10. Robustness test 1 (sliding window period: 150, 250).
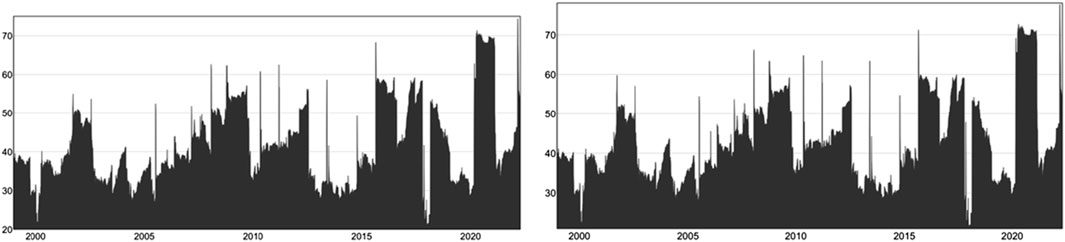
FIGURE 11. Robustness test (H-forecast step: 8, 12).
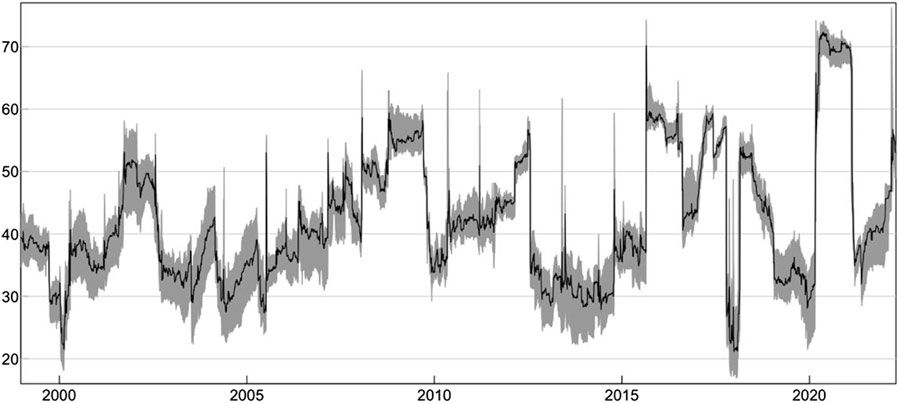
FIGURE 12. Robustness test 3 (VAR lag: 2–6).
This study investigates the global EPU and stock market risk spillover effects in seven countries (the U.S., China, Japan, Germany, the U.K., India, and France), and analyzes the stock return volatility of seven global stock markets from 5 January 1998 to 22 April 2022, discussing the dynamic relationships in different subsamples. The conclusions are as follows: first, EPU can act both as a driver of risk contagion, directly in the stock market, and as a mechanism of propagation and amplification, amplifying risk globally in stock market transactions. What is certain is that a high EPU index can lead to disruptions in macroeconomic performance. It sometimes exhibits moderate countercyclical volatility, probably because policymakers prefer to experiment with new policies during economic downturns. Second, the structure and intensity of risk spillovers in the stock markets of the world’s top seven economies are time-varying. Overall, the U.S. is the main risk spiller and taker, having the largest control over global stock markets, followed by the European and Japanese markets. This suggests that financial linkages among developed market economies are stronger and more likely to influence emerging markets directly or indirectly. The Chinese stock market, the largest emerging stock market, is currently more stable and is neither a source of stock market risk nor rarely exposed to it. Chinese stock market risk spillovers have increased significantly in recent years, reflecting the impact of China’s rising economic strength on the global economic system. However, no country can always be the sender and receiver of risk spillovers, reflecting the changing global economic environment. Third, financial crises, political risk crises, and public security crises can bring significant economic volatility and stock market risk contagion to both developed and emerging market economies. However, the shocks from crises can vary significantly depending on the type of crisis and the time of occurrence.
The policy implications derived from this paper are as follows:
The first is to strengthen cooperation among countries to prevent risks and establish cooperation mechanisms to prevent cross-country risk contagion. In addition, investors in each country need to consider the relevant policies and choices of large economies and design good policy institutions and agencies to limit the scope of rising EPU triggered by negative shocks. Policy risks are unstable in every country, but the frequency of global financial crises may increase when risk spillovers among large economies are closely linked and strong. Multinational organizations such as the International Monetary Fund and the World Bank should strengthen their assessment of policy risks in large economies to prevent large cross-country financial risks.
The second is to strengthen the construction of transnational risk early warning mechanisms to effectively prevent and disperse the impact of international emergencies. The current international situation is volatile, for example, since February 2022, the Russia-Ukraine conflict has caused dramatic fluctuations in bulk commodities, and the rise in prices of related raw materials and energy will also lead to an increase in growth costs. The death of Shinzo Abe in July 2022 could easily bring bad demonstrations and new geopolitical conflicts to the world. Each economy is at a different stage of development and has its own unique endowment and culture. How can we achieve the human goal of sustainable development while respecting each country’s national conditions and safeguarding international free trade and each country’s right to development? What kind of consensus should the international community reach? These are the questions that need to be concerned.
The third is that we should continue to be alert to the negative impact of contagion risk from public health events on countries’ financial markets. We find that shocks from public health and safety crises can more quickly and directly lead to a rise in global EPUs, which act more strongly on stock markets and trigger financial crises. International stock markets are open, dynamic, and complex, with characteristics such as latency, suddenness, rapid spread, and difficulty in tracking traceability. If a sudden public health security event is not effectively controlled, it can lead to massive shocks in global stock markets and diminished economic growth prospects.
Publicly available datasets were analyzed in this study. This data can be found here: Wind database.
HS: conceptualization, methodology, software, formal analysis, data curation, writing—original draft preparation, writing—review, and editing. HS, DW, and BZ: validation. BZ: investigation, resources, supervision, project administration, and funding acquisition. DW: visualization. All authors contributed to the article and approved the submitted version.
This research was funded by Philosophy and Social Science Research Innovation Team Project (Grant No. 2022CXTD04) and the National Natural Science Foundation of China (Grant No. 11901233).
The authors are grateful for the funding support in the writing process. They thank the editors for their hard work in the article review process and the reviewers for their professional opinions.
The authors declare that the research was conducted in the absence of any commercial or financial relationships that could be construed as a potential conflict of interest.
All claims expressed in this article are solely those of the authors and do not necessarily represent those of their affiliated organizations, or those of the publisher, the editors and the reviewers. Any product that may be evaluated in this article, or claim that may be made by its manufacturer, is not guaranteed or endorsed by the publisher.
1. Dicks DL, Fulghieri P. Uncertainty aversion and systemic risk. The J Polit economy (2019) 127(3):1118–55. doi:10.1086/701356
2. Dai PF, Goodell JW, Huynh LDT, Liu ZF, Corbet S. Understanding the transmission of crash risk between cryptocurrency and equity markets (2022). doi:10.1111/fire.12340
3. Baker SR, Bloom N, Davis SJ. Measuring economic policy uncertainty. Q J Econ (2016) 131(4):1593–636. doi:10.1093/qje/qjw024
4. Worthington A, Valadkhani A. Measuring the impact of natural disasters on capital markets: an empirical application using intervention analysis. Appl Econ (2004) 36(19):2177–86. doi:10.1080/0003684042000282489
5. Foglia M, Dai PF. “Ubiquitous uncertainties”: spillovers across economic policy uncertainty and cryptocurrency uncertainty indices. J Asian Business Econ Stud (2022) 29(1):35–49. doi:10.1108/jabes-05-2021-0051
6. Liow KH, Liao WC, Huang YT. Dynamics of international spillovers and interaction: evidence from financial market stress and economic policy uncertainty. Econ Model (2018) 68:96–116. doi:10.1016/j.econmod.2017.06.012
7. Bai L, Zhang XH, Liu YT, Wang Q. Economic risk contagion among major economies: new evidence from EPU spillover analysis in time and frequency domains. Physica a-Statistical Mech Its Appl (2019) 535:122431. doi:10.1016/j.physa.2019.122431
8. Adeosun OA, Olayeni RO, Tabash MI, Anagreh S. The dynamics of oil prices, uncertainty measures and unemployment: a time and frequency approach. China Finance Rev Int (2023) 13:682–713. doi:10.1108/CFRI-06-2022-0094
9. Li Y, Luo JQ, Jiang YM. Policy uncertainty spillovers and financial risk contagion in the Asia-Pacific network. Pacific-Basin Finance J (2021) 67:101554. doi:10.1016/j.pacfin.2021.101554
10. Yang ZH, Zhou YG, Cheng X. Systemic risk in global volatility spillover networks: evidence from option-implied volatility indices. J Futures Markets (2020) 40(3):392–409. doi:10.1002/fut.22078
11. Blume LE, Durlauf SN. Capital in the twenty-first century: a review essay. J Polit Economy (2015) 123(4):749–77. doi:10.1086/682367
12. Masson P. Contagion:. J Int Money Finance (1999) 18(4):587–602. doi:10.1016/s0261-5606(99)00016-9
13. Forbes KJ, Rigobon R. No contagion, only interdependence: measuring stock market comovements. J Finance (2002) 57(5):2223–61. doi:10.1111/0022-1082.00494
14. Bloom N. The impact of uncertainty shocks. Econometrica (2009) 77(3):623–85. doi:10.3982/ecta6248
15. Sharif A, Aloui C, Yarovaya L. COVID-19 pandemic, oil prices, stock market, geopolitical risk and policy uncertainty nexus in the US economy: fresh evidence from the wavelet-based approach. Int Rev Financial Anal (2020) 70:101496. doi:10.1016/j.irfa.2020.101496
16. Yuan M, Hu D. Study of risk spillover effect of global stock market against background of COVID-19 impact. Finance Forum (2021) 9:36–48. doi:10.16529/j.cnki.11-4613/f.2021.09.005
17. An XQ, Barnett WA, Wang X, Wu QY. Brexit spillovers: how economic policy uncertainty affects foreign direct investment and international trade. Eur J Finance (2022) 29:1913–32. doi:10.1080/1351847x.2022.2134812
18. Jafari Y, Britz W. Brexit: an economy-wide impact assessment on trade, immigration, and foreign direct investment. Empirica (2020) 47(1):17–52. doi:10.1007/s10663-018-9418-6
19. Crafts N. Reducing high public debt ratios: lessons from UK experience. Fiscal Stud (2016) 37(2):201–23. doi:10.1111/j.1475-5890.2015.12064
20. Eichengreen BJ. Globalizing capital: a history of international monetary. Princeton: Princeton University Press (2008).
21. Kali R, Reyes J. Financial contagion on the international trade network. Econ Inq (2010) 48(4):1072–101. doi:10.1111/j.1465-7295.2009.00249.x
22. Allen F, Rogoff K. Asset prices, finance stability and monetary policy. The Riksbank’s inquiry into the risks in the Swedish housing market (2011) 189–218.
23. Massad N, Andersen JV. Three different ways synchronization can cause contagion in financial markets. Risks (2018) 6(4):104. doi:10.3390/risks6040104
24. Cen L, Lu H, Yang LY. Investor sentiment, disagreement, and the breadth-return relationship. Manag Sci (2013) 59(5):1076–91. doi:10.1287/mnsc.1120.1633
25. Bash A, Alsaifi K. Fear from uncertainty: an event study of Khashoggi and stock market returns. J Behav Exp Finance (2019) 23:54–8. doi:10.1016/j.jbef.2019.05.004
26. He F, Ma F, Wang ZW, Yang BH. Asymmetric volatility spillover between oil-importing and oil-exporting countries' economic policy uncertainty and China's energy sector. Int Rev Financial Anal (2021) 75:101739. doi:10.1016/j.irfa.2021.101739
27. Saxegaard ECA, Davis S, Ito A, Miake N. Policy uncertainty in Japan. J Jpn Int Economies (2022) 64:101192. doi:10.1016/j.jjie.2022.101192
28. Belke A, Dreger C, Dubova I. On the exposure of the BRIC countries to global economic shocks. World Economy (2019) 42(1):122–42. doi:10.1111/twec.12674
29. Born B, Pfeifer J. Policy risk and the business cycle. J monetary Econ (2014) 68(1):68–85. doi:10.1016/j.jmoneco.2014.07.012
30. Handley K, Limao N. Policy uncertainty, trade, and welfare: theory and evidence for China and the United States. Am Econ Rev (2017) 107(9):2731–83. doi:10.1257/aer.20141419
31. Li R, Li SF, Yuan D, Yu KM. Does economic policy uncertainty in the US influence stock markets in China and India? Time-frequency evidence. Appl Econ (2020) 52(39):4300–16. doi:10.1080/00036846.2020.1734182
32. McGrattan ER, Waddle A. The impact of Brexit on foreign investment and production. Am Econ Journal-Macroeconomics (2020) 12(1):76–103. doi:10.1257/mac.20170399
33. Hilliard JE. Relationship between equity indexes on world exchanges. J Finance (1979) 34(1):103–14. doi:10.2307/2327147
35. Engle R. Dynamic conditional correlation: a simple class of multivariate generalized autoregressive conditional heteroskedasticity models. J Business Econ Stat (2002) 20(3):339–50. doi:10.1198/073500102288618487
37. Hu L. Dependence patterns across financial markets: a mixed copula approach. Appl Financial Econ (2006) 16(10):717–29. doi:10.1080/09603100500426515
38. Patton AJ. On the out-of-Sample important of skewness and asymmetric dependence for asset allocation. Lond Sch Econopmics (2004) 2(1):130–68. doi:10.1093/jjfinec/nbh006
39. Diebold FX, Yilmaz K. Measuring financial asset return and volatility spillovers, with application to global equity markets. 1 Univ Pa NBER 2 Koc Univ (2009) 119(No.534):158–71. doi:10.1111/j.1468-0297.2008.02208.x
Keywords: economic policy uncertainty, risk contagion, stock market, financial crisis, COVID-19
Citation: Shao H, Wang D and Zhou B (2024) Economic policy uncertainty on stock market risk contagion: a network-based approach. Front. Phys. 11:1094659. doi: 10.3389/fphy.2023.1094659
Received: 10 November 2022; Accepted: 21 December 2023;
Published: 24 January 2024.
Edited by:
Matjaž Perc, University of Maribor, SloveniaReviewed by:
Jaka Sriyana, Islamic University of Indonesia, IndonesiaCopyright © 2024 Shao, Wang and Zhou. This is an open-access article distributed under the terms of the Creative Commons Attribution License (CC BY). The use, distribution or reproduction in other forums is permitted, provided the original author(s) and the copyright owner(s) are credited and that the original publication in this journal is cited, in accordance with accepted academic practice. No use, distribution or reproduction is permitted which does not comply with these terms.
*Correspondence: Baicheng Zhou, Y2NiZXlvbmRAMTI2LmNvbQ==
Disclaimer: All claims expressed in this article are solely those of the authors and do not necessarily represent those of their affiliated organizations, or those of the publisher, the editors and the reviewers. Any product that may be evaluated in this article or claim that may be made by its manufacturer is not guaranteed or endorsed by the publisher.
Research integrity at Frontiers
Learn more about the work of our research integrity team to safeguard the quality of each article we publish.