
95% of researchers rate our articles as excellent or good
Learn more about the work of our research integrity team to safeguard the quality of each article we publish.
Find out more
ORIGINAL RESEARCH article
Front. Phys. , 15 February 2023
Sec. Medical Physics and Imaging
Volume 11 - 2023 | https://doi.org/10.3389/fphy.2023.1071981
This article is part of the Research Topic Breakthrough in Particle Therapy: At the Edge of Physics, Biology and Medicine View all 8 articles
 Giorgio Cartechini1,2,3
 Elena Fogazzi1,2
 Shanyn-Dee Hart4,5
 Luna Pellegri4,5
 Marie Vanstalle6
 Michela Marafini7,8
 Chiara La Tessa1,2,3*
Introduction: The main rationale for using protons in cancer treatment is based on the highly conformal dose distribution and normal tissue spearing compared to conventional radiotherapy. The main limit of proton therapy is the particle range uncertainty due to patient setup, dose calculation and imaging. To account for this, a safety margin is added to the tumor to ensure the prescribed dose to the target. Reducing range uncertainties would result in the reduction of irradiation volume and would allow full exploitation of the proton therapy benefits. In this work, we presented a feasibility study for a strategy to achieve in vivo proton range verification based on prompt gammas (PG). This approach relies on the detection of signature prompt gammas, generated by the interaction of primary protons with a non-radioactive element, that is selectively loaded into a tumor with a drug carrier. The number of characteristic gammas is directly related to the proton range, and its measurement provides an estimate of the position at which the primary beam stops with respect to the tumor location.
Method: We identified the criteria for selecting potential candidate materials and combined them with TALYS predictions to make the selection. We carried out an experimental campaign to characterize the PG spectra generated by the chosen materials when irradiated with therapeutic protons and compared them with TOPAS Monte Carlo toolkit predictions.
Results: We identified 31-Phosphorous, 63-Copper and 89-Yttrium as potential candidates for this application based on TALYS calculations. The experimental data confirmed that all candidates emit signature prompt gammas different from water (here used as a proxy for normal tissue), and that the gamma yield is directly proportional to the element concentration in the solution. Four specific gamma lines were detected for both 31P (1.14, 1.26, 1.78, and 2.23 MeV) and 63Cu (0.96, 1.17, 1.24, 1.326 MeV), while only one for 89Y (1.06 MeV). The simulations indicate that the count of characteristic gammas is directly proportional to the proton range, reaching in some cases a saturation value around the tumor’s far edge. The results also indicate that to achieve a range accuracy below the current value of 2–3 mm, the uncertainty on the prompt gammas count has to be below 5% for 31-Phosphorous and 63-Copper, or 10% for 89-Yttrium.
Discussion: We demonstrated that loading the tumor with a label element prior to proton treatment generates signature gammas that can be used to verify the beam range in vivo, reaching a potential range accuracy below the current limitations. This approach can be either used stand-alone or combined with other existing methodologies to further improve range resolution.
Proton therapy is a well-established technology in radiotherapy, whose benefits stem from both physical and biological properties [1]. Ions deposit the maximum dose in a localized region close to the end of the range (called the Bragg Peak BP), and the combination of the favorable depth-dose profile with advanced delivery techniques translates into a high dose conformality in the tumor, as well as into a superior sparing of normal tissue [2]. Although clinical results have been encouraging, numerous treatment uncertainties remain major obstacles to the full exploitation of proton therapy. One of the crucial challenges is monitoring the dose delivered during the treatment, both in terms of absolute value and spatial distribution inside the body. Ideally, the actual beam range in the patient should be equal to the value prescribed by the Treatment Planning System (TPS). However, there are sizable uncertainties at the time of irradiation due to anatomical modifications, patient alignment, beam delivery and dose calculation [2,3]. Range errors reflect on the selection of the safety margins applied to the tumor volume, whose values depend on clinical protocols as well as on the treated area (e.g., 3.5% of the nominal range +1 mm) [3,4]. Decreasing the range uncertainties would reduce the safety margins, i.e., the treatment volume, and thus decrease the dose delivered to the normal tissue around the tumor [5]. Monitoring the proton range in vivo is a key tool to achieve this goal, and thus to improve the overall treatment effectiveness as well as to allow for more dose escalation. Several techniques have been proposed to address the fundamental issue of in vivo proton verification [6–8], among which prompt gamma (PG) imaging is very promising. This technique exploits inelastic nuclear interactions between primary protons and the nuclei of the patient tissues, which leave the nuclei in an excited state. To return to the ground state, the target nuclei decay by emitting a single photon (PG). Typically, the gammas produced in this process have energies up to 7–8 MeV emitted with an isotropic and anisotropic angular distribution depending on the decay chain involved in the reaction [9]. Exploiting this reaction [10], was the first to show the correlation between the PG emission profile and the proton dose distribution, which allowed them to estimate the Bragg peak position for a given beam energy. Therefore, using PG imaging is possible to obtain information on the range of each beam spot in the case of active beam delivery. The almost simultaneous PG production time from the time of irradiation (10–19–10−9 s) represents the main advantage of this technique, which has the potential to provide a dose verification during the treatment delivery, i.e., online. When compared to the conventional post-treatment positron emission tomography (PET) method [11–14], PG imaging does not suffer from signal washout, or uncertainties due to patient movement [5]. In addition, PG production is on average ten times higher than PET signal for both passive scattering and pencil beam scanning delivery systems [15]. Although INSIDE [16] has made a significant advance in PET, providing a first in-beam imagining with a millimeter uncertainty measured in clinical tests with patients [17], [18], limitation still remains. In-beam PET is designed to work with low duty-cycle accelerators, and so far has only been installed in a fixed beam line.
The practicability of in vivo prompt gamma range verification for proton therapy has been demonstrated by numerous experimental and Monte Carlo studies [6,7,19,20], as well as by its recent application to the clinical practice for inter-fractional range variation evaluations [21]. The current accuracy achieved on patients for retrieving the range of a single pencil beam is of 2–3 mm [22,23]. Together with the advantages discussed above, all studies identified the low PG statistics as the major factor limiting the full exploitation of this technique for single spot range verification. This issue is caused by: i) the short duration of a single spot delivery, ii) the immense gamma-ray production rate during delivery, iii) the finite rate capability of detectors, iv) the electronic throughput limits and v) the signal-to-background ratio.
In this study, we present an approach for in vivo range verification in proton therapy based on creating signature gammas emitted only when protons traverse the tumor, and whose yield is directly related to the beam range. We propose to achieve this goal by loading the tumor with a drug-delivered stable element, that emits characteristic de-excitation PG following nuclear interactions with the primary protons. The approach of injecting a PG enhancer in the tumor has been explored by [24], who report a full Monte Carlo investigation of the use of metallic nanoparticles for proton range verification. Studies from [25], [26] experimentally investigated the use of external medical devices filled or made of metallic elements (e.g., Si, Mo) for monitoring either the proton range or the dose delivered to the healthy tissues.
In this work, we investigate the feasibility of the proposed methodology including both experiments and Monte Carlo simulations. First, we identify the criteria for selecting potential candidate materials and combine them with TALYS [27] predictions to make the selection. We then present the results from an experimental campaign to characterize the PG spectra generated by the chosen materials when irradiated with therapeutic protons and compared them with TOPAS Monte Carlo toolkit [28] predictions. We finally discuss the correlation between the yield of signature gammas and the proton range and the accuracy that can be achieved with this method.
TALYS code [27] was selected as a tool to investigate the proton-induced reaction channels for all candidates labeling elements. TALYS is a software package for the simulation of nuclear reactions in the 1 keV-200 MeV energy range, involving different projectiles (e.g., protons, neutrons, photons, alphas, etc.) and targets (mass equal or higher than 5). This code can be also used in applied nuclear physics to predict nuclear level density, gamma-ray strength functions, compound nucleus reaction mechanism, as well as direct and pre-equilibrium processes [29]. In all TALYS calculations, we used the default values of all parameters.
To characterize the PG emissions of the selected elements, we carried out two experimental campaigns at the research room of the Trento proton therapy center (TPC) in Italy [30] and at the Cyrcé cyclotron (Institut Pluridisciplinaire Hubert CURIEN—IPHC) in Strasbourg, France [31]. At TPC, we used a 70 MeV proton pencil beam with a Gaussian profile (16 mm FWHM at the isocenter), corresponding to a 41 mm range in water. At Cyrcé, targets were exposed to a proton beam of 25 MeV nominal energy, which decreased to an effective value of 23.68 MeV at the exit window, corresponding to a 5.7 mm range in water. The beam shape in the plane perpendicular to the target could be described by a 2 mm × 3 cm rectangular distribution.
At both facilities, we measured the gamma energy spectrum produced by the labeling elements with a LaBr3:Ce cylindrical scintillator 7.62 cm high and with 7.62 cm of diameter (3” × 3”), coupled with a Hamamatsu R6233 photomultiplier tube. The presence of 138La and impurities in the crystal, combined with its large size, resulted in non-negligible background radiation, whose energy spectrum is plotted in Figure 1A. The most probable 138La decay channels channel is the electron capture to the first excited level of 138Ba, followed by the emission of a 1435.8 keV gamma-ray as nuclear de-excitation product. During the atomic relaxation process, a cascade of characteristic X-rays of maximum energy equal to 37.4 keV are emitted by 138Ba. As these X-rays have a certain probability to escape from the LaBr3:Ce crystal, the resulting internal emission spectrum has a peak at 1471 keV (1435.8 keV + 37.4 keV), with a shoulder at 1435.8 keV generated by the partial X-ray detection. 138La second decay channel is a β − continuum (up to 258 keV) to the first excited state of 138Ce, followed by the emission of a 788 keV gamma-ray, which shifts the continuum up to 1047 keV [32]. A detailed characterization of the LaBr3:Ce internal radioactivity can be found in [33]. Figure 1B shows the energy resolution of LaBr3:Ce as a function of gamma energy, assessed using multiple sources (60Co, 133Ba, 137Ba and AmBeNi). Details on the LaBr3:Ce detection efficiency can be found in [34].
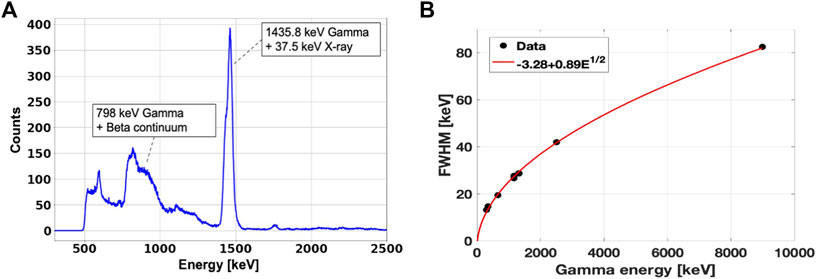
FIGURE 1. (A): Measured energy spectrum of the LaBr3:Ce internal radioactivity. (B): LaBr3:Ce energy resolution measured with radioactive sources of 60Co, 133Ba, 137Ba and AmBeNi. The values on the y-axis represent the peaks FWHM. The experimental points are fitted with the function
The setups of the two experimental campaigns are shown in Figure 2. At TPC (Figure 2A), an ionization chamber was placed in front of all targets to monitor the total number of protons delivered. All targets were located at 120 cm from the exit window along the beam axis. The LaBr3:Ce detector was placed at 90° from the beam axis, and at a distance of 18.5 cm from the target center. A 5 mm thick plastic scintillator was placed in front of the LaBr3:Ce to discriminate charged particles in the post-processing analysis. The solid angle covered by the detector with respect to the target center was 0.13 ± 0.02 sr. The setup used at the Cyrcé facility was modified to be adapted to the different beam line characteristics (Figure 2B). The beam current was monitored using a movable Faraday cup located upstream of the exit window. To obtain the number of delivered protons, the Faraday cup was calibrated against a plastic scintillator detector as described in [31]. The LaBr3:Ce detector was placed at 40° with respect to the beam axis, and at 17.5 cm from the target center. The 5 mm plastic scintillator placed in front of the LaBr3:Ce was removed, because all charged fragments ranged out in the 1.5 mm thick aluminum case surrounding the detector.
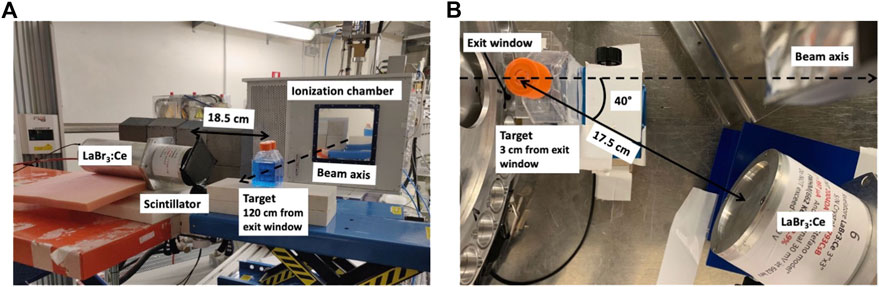
FIGURE 2. Pictures of the experimental setups used at TPC (A) and at the Cyrcé facility of Strasbourg (B). In the images, the liquid targets are displayed. The solid targets were placed at the same positions, and suspended in air with a thin plastic wire. All distances were measured from the target center and the LaBr3:Ce surface, and are reported in cm.
The PG production of all candidate materials was measured using both solid and liquid targets, irradiated at the two facilities with the setups shown in Figure 2. As a solid target, we used a63Cu cylindrical rod of 9.5 mm diameter and 30 mm height both at TPC and at Cyrcé. For 89Y, we irradiated a cylindrical rod of 6.35 mm diameter and 6.35 mm height at TPC, and a 3.3 × 17.5 × 17.5 mm slab at Cyrcé. The 89Y target employed at TPC could not be also used at Cyrcé because of radioprotection constraints. At both facilities, during the irradiation the solid targets were placed with the long side perpendicular to the beam, and suspended in air with a thin plastic wire to avoid production of background radiation from the supports. All liquid targets consisted of water-based solutions containing salts of the candidate label elements at different concentrations. The salts used in this experiment were NaH2PO4 for 31-Phosphorus, CuSO4 for 63-Copper and Y(NO3)3 for 89-Yttrium. The molar concentration of each salt, and the corresponding elemental mass fraction are listed in Table 1. In addition to these solutions, we irradiated distilled water as a proxy for human tissue, to characterize the background spectrum emitted by the tumor without the marker elements. All liquid targets were contained in 5 × 5 × 5 cm3flasks made of PMMA (Poly methyl methacrylate), with walls equivalent to 1.35 mm water thickness. At TPC, for each material we used two flasks placed back-to-back. At Cyrcé, liquid targets were contained in a 2.5 × 5 × 5 cm3 flask with a thin entrance wall about 88 μm thick, in order to minimize the beam energy loss.
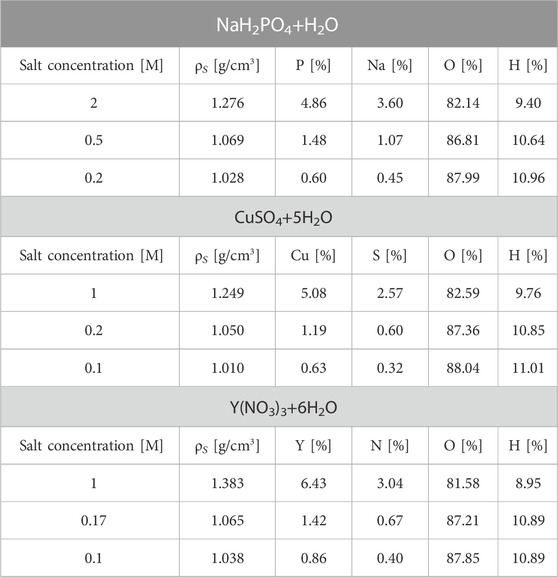
TABLE 1. List of the irradiated solutions at three different molar concentrations. Solution density (ρS) and the elemental composition mass fraction is reported. Molar concentrations were chosen to achieve around the 5%, 1%, and 0.1% of element mass fraction in the solution. Uncertainties on the solutions mass fractions depends on the solution preparation (weight of the salt and water), and have been estimated to be 1%.
For both experimental campaigns, the data were recorded with a VME-based data acquisition system (DAQ) triggered by the LaBr3:Ce. The analog signals of the two detectors were processed by a CAEN 792N 12-bit resolution Charge-To-Digital Converter (QDC), using a 500 ns long integration gate for the LaBr3:Ce and a 100 ns long integration gate for the plastic scintillator. A CAEN V830 scaler was used to count the number of events registered by each detector, as well as the number of triggers accepted by the DAQ. These data were needed to estimate the acquisition dead time, defined as the ratio between accepted and total triggers, that we used to correct all experimental PG energy spectra. The events produced by the LaBr3:Ce internal radioactivity contributed both to the number of the free triggers and accepted triggers, and generated
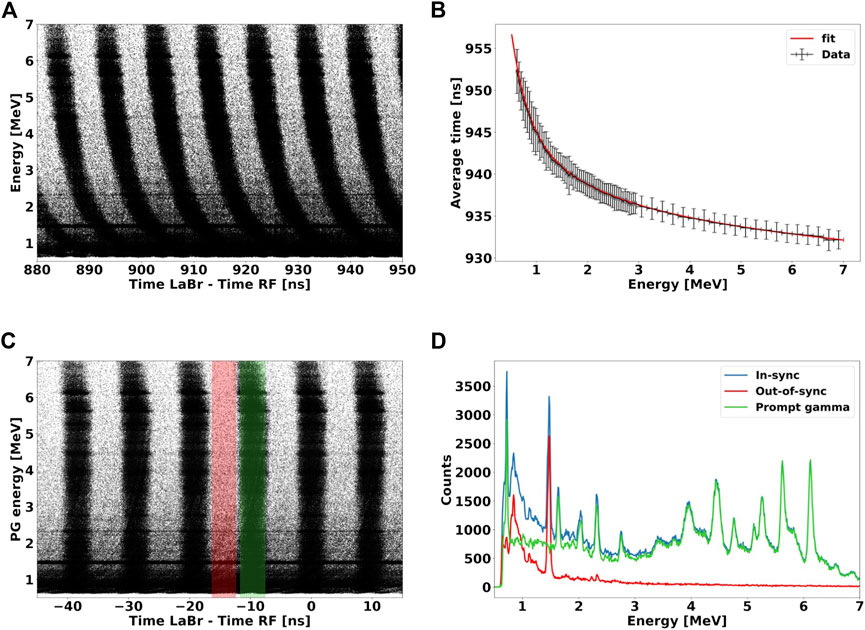
FIGURE 3. (A): 2D plot of energy deposited versus TLaBr−RF of all acquired events. (B): average events TLaBr−RF as a function of energy deposited for a single bunch. The solid red line represents the fit function used to model the time dependence on the gamma energy deposited, caused by the discriminator time walk effect. (C): 2D spectrum of (A) after the time walk correction has been applied to all events. The color bands mark the time windows used to gate in-sync (green) and out-of-sync (red) events. (D): energy deposited spectra of all events (blue lines) acquired by the LaBr3:Ce and of events out-of-sync (red line) with the RF, which represent the radiation background. The energy spectrum of prompt gammas (blue line) is obtained by subtracting the out-of-sync events from the full spectrum. The spectrum was acquired for 70 MeV protons interacting water.
The off-line processing of the raw data consisted of four steps:
1. Energy calibration: all spectra were calibrated using the de-excitation peaks of 12C and 16O nuclei measured with the water target as well as those produced by the LaBr3:Ce internal radioactivity (Figure 1A);
2. Time walk correction: Although prompt gammas should all arrive on the LaBr3:Ce simultaneously, Figure 3A shows that the TLaBr−RF depends on their energy deposited. This behavior is caused by the time walk effect of the leading edge signal discrimination [35]. This electronic artifact results in a bend shape of the PGs population produced within a same proton bunch, and must be corrected. To model the energy deposited-time dependency, we selected a single cluster and calculated the average TLaBr−RF as a function of the particle energy (Figure 3B). We used the sum of four exponential functions to model the curve trend and calculated the function parameters by fitting the graph points defined as follows:
We then subtracted the fit function value from the raw TDC value, and obtained the TDC corrected spectrum shown in Figure 3C, where the bend of each bunch at low-energy has disappeared [36];
3. Subtraction of background and out-of-sync events: we identified three main sources of background radiation during the experiment: i) prompt gammas created outside the target, e.g., in the beam line elements, ii) gammas generated by the LaBr3:Ce internal radioactivity (Figure 1), and iii) secondary neutrons and delayed gammas produced either inside or outside the target. Only events belonging to i) are in-sync with the RF signal. Gammas of ii) are randomly emitted in time, and thus do not correlate with the primary protons, while events of iii) reach the detector outside the RF time interval. In fact, delayed gammas have a much larger temporal scale of emission than prompt gammas, while secondary neutrons emitted at large angles, where the LaBr3:Ce is located, have a relatively low-energy [2], and corresponding TLaBr−RF of several ns. Taking advantage of this hypothesis, we were able to discriminate in-sync from out-of-sync events. We defined a 2 ns wide time window centered in the middle of a bunch, and identified all events within this region as in-sync with the RF. We then shifted the same gating window by half of RF period (4.7 ns), to identify out-of-sync events. Figure 3D illustrates the energy spectrum for in-sync and out-of-sync events identified by the gating process. By subtracting out-of-sync from the in-sync events, we discriminated the background events and were able to obtain the energy spectrum of prompt gamma only. Prompt gammas produced outside the target i) could not be identified with this method. However, we acquired no-target measurements to characterize their contribution, and eventually subtract them from the total spectrum.
All PG counts (Nγ) were then normalized to the number of primary protons delivered to the target (NP), energy bin width (ΔE), as well as corrected for the acquisition dead time (DT):All simulations performed in this study were carried out with TOPAS MC (v3.7) toolkit based on Geant4 version 10.06.p03. [28,37], and using the default physics list validated for proton therapy applications [38]. In particular, for the electromagnetic interaction we used the g4em-standard_opt4 and the g4h-phy_QGSP_BIC_HP which employees the Binary intranuclear cascade (BIC) model for the simulation of proton-nucleus interaction. The work of Wronska A. et al. [39] showed that the QGSP_BIC_HP physics list is the most accurate in reproducing experimental values with respect to other physics lists available for proton therapy applications.
TOPAS MC was used to simulate the experiments described in Section 2.2 both for solid and liquid targets, accurately reproducing the setup geometries shown in Figure 2. The room walls as well as elements outside a 50 cm radius from the target stand were neglected. The LaBr3:Ce detector was simulated as two concentric cylinders: the outer one was made of Aluminum (8.64 cm diameter and 8.98 cm length) and the inner one of LaBr3:Ce (8.04 cm diameter and 8.38 cm length). The detector internal radioactivity was not reproduced both to optimize the computational time, and to obtain energy spectra without background. The energy spread of the 70 MeV proton beam at TPC was modeled with a Gaussian function with 0.8 MeV of standard deviation, while the spatial profile was described by a Gaussian function of 1.6 cm FWHM on the plane orthogonal to the beam direction. The energy of the Cyrcé beam was set at 23.68 MeV with a 0.1 MeV Gaussian energy spread. In this case, the spatial profile was modeled as a 2 mm × 3 cm uniform distribution on the transverse plane. The ionization chamber used for the experiment at TPC was not included in the simulation geometry due to its negligible water-equivalent thickness. To take into account the gamma interaction efficiency in the detector, we performed a two-step simulation. First, we scored the phase space (position, momentum, time-of-flight, etc.) of all PGs arriving on the LaBr3:Ce active volume surface. The phase space was then used as a radiation source for a second simulation, where the event-by-event energy deposition inside the detector was scored.
TOPAS was also employed to investigate the correlation between the proton range and the profile of PG produced by the label elements. The simulation geometry consists of a cylindrical phantom (length 30 cm, diameter 15 cm) made of soft tissue, whose composition was defined according to the ICRP [40]. Inside the phantom, we placed a 2 cm diameter and 2 cm long cylinder, representing the tumor (Figure 4). This region was either made of 100% soft tissue, or set as a compound material made of 95% of soft tissue, and 5% mass fraction of the label elements (31-Phosphorous, 63-Copper or 89-Yttrium) for enhancing the PG production. The proximal tumor face was placed at a depth of 150 mm with respect to the entrance plane of the soft tissue phantom. The phantom was exposed to proton beams of energies from 147 MeV to 165 MeV in step of 2 MeV, corresponding to a range between 147 mm (3 mm upstream of the tumor) and 180 mm (10 mm downstream of the tumor). We scored the energy of all PGs exiting the tissue phantom at 4π solid angle as a function of the incident proton energy. All gammas produced at least 10 mm before the tumor region (i.e., at a 140 mm depth) were not scored, under the hypothesis that a collimator is used to minimize the background of PGs produced upstream of the tumor. This assumption is based on the works from [41], [22], which both employ tungsten shielding to collimate PGs in the energy range of interest. We estimated the PG enhancement due to the presence of the marker element in the tumor as NE − Nbkg, where NE is the total number of PGs for a signature PG in a given energy range when the tumor is loaded with the label element, while Nbkg is the number of events in the same energy range produced by the tumor without marker.
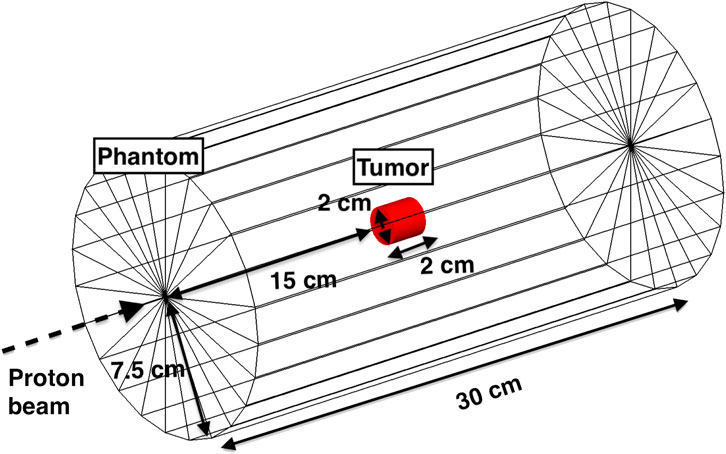
FIGURE 4. Setup used for all TOPAS MC simulations to investigate the correlations between the number of signature PGs and the proton range. The geometry is composed of an outer cylinder made of soft tissue, and a tumor region (red cylinder) located at a depth of 15 cm from the entrance. The energies of the proton beam ranged between 145 MeV and 165 MeV.
To identify candidate materials for labeling the tumor, we looked for elements that are currently employed in medicine either for diagnostic or therapeutic purposes, and for which a drug carrier already exists. Although this prerequisite limits the number of potential candidates, it also makes the clinical applicability of our methodology more realistic. The fact that both the element and the carrier are already used on patients ensures a detailed knowledge on their behavior in biological environments, including tolerance levels and toxicity effects. Once the feasibility of this approach is demonstrated for some candidates, it could then be extended to others for further optimization. For the selection, we considered the stable isotopes of all elements reported in [42], and narrowed the pool considering two constraints: i) a relatively low abundance in the body, and ii) a production of characteristics PGs with energies higher than 0.5 MeV and outside the 4–7 MeV region, where the most probable de-excitation peaks produced by 12-Carbon and 16-Oxygen are found. These requirements ensure that the PGs emitted by the label element are different from those produced by tissues (here simulated as Carbon and Oxygen, because of their large presence in the human body [43], and thus that the signal-to-background ratio is favorable. To check the relative abundance of all potential elements, we used the data reported in [43], while we assessed their characteristic PG spectrum with TALYS. On the basis of the selection criteria, we identified three potential candidates: 31-Phosphorus (31P), 63-Copper (63Cu) and 89-Yttrium (89Y).
31-Phosphorous (31P): Pure Phosphorus and Phosphorus-based compounds are largely applied in nanomedicine, because of their ability to interact with proteins (e.g., conjugate with antibodies or enzymes), to bind and transfer genetic material, as well as to act as antiviral agents [44]. Furthermore, Phosphorus nanoparticles have been developed to treat cancer [45]. Phosphorous is present in the human body around 0.1% of mass fraction [43].
63-Copper (63Cu): Several studies demonstrated the potential of the diacetyl-bis (N4-ethylthiosemicarbazone) Cu-ATSM for hypoxia assessment in oncology and non-oncology settings [46]. Copper is an essential element in the human body, because it is involved in a large number of metabolic processes, and its abundance is a few part per million [47].
89-Yttrium (89Y): Yttrium belongs to the radiometal family, which has gained increasing interest for both diagnostic imaging and therapeutic applications. 90Y is currently employed in RadioImmunoTherapy (RIT). The 90Y-labeled monoclonal Antibody (mAb), 90Y- ibritumomab tiuxetan (Zevalin®, Spectrum Pharmaceuticals, Henderson, NV, United States), was approved in 2002 by the US Food and Drug Administration for targeting CD20 in Non-Hodgkin’s lymphoma patients and is now part of the standard treatment for this disease [48]. Yttrium is not an essential element in human nutrition and is not naturally present in the human body.
TALYS simulations for the three selected materials are plotted in Figure 5, and include the total PG production cross section as a function of the incident proton beam (Figure 5A), as well as the differential PG production cross section versus the gamma energy (Figures 5B–F). The results take into account all possible reaction channels that yield prompt gammas. Values for 12-Carbon and 16-Oxygen are also reported to simulate the background signal produced by the tissues.
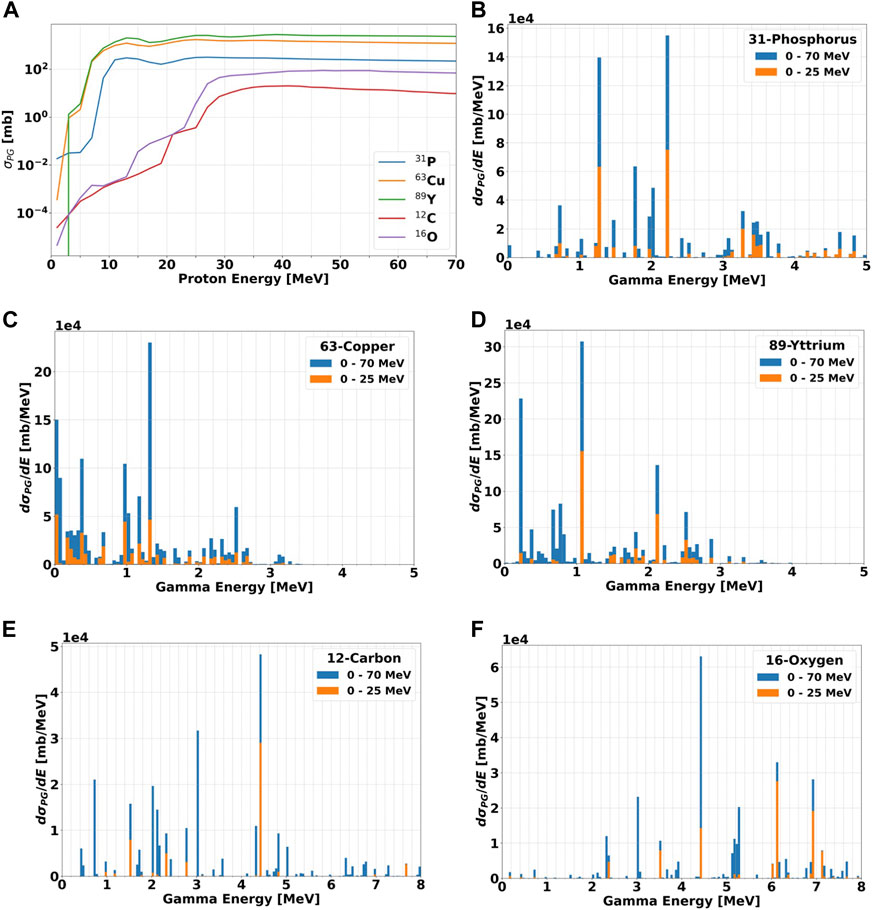
FIGURE 5. (A): Total production cross section σPG for PGs of all energies as a function of the incident proton beam energy. The data are show for the three candidate elements (31P, 63Cu, and 89Y) and the most abundant nuclei in the human body (12C and 16O). The proton energy step is set to 1 MeV. (B–F): differential cross sections in energy dσPG/dE for the production of PGs as a function of their energy for all materials when irradiated with protons in the energy ranges 0–25 and 0–70 MeV. The data were calculated by summing up all gammas of a given energy produced in the material and divided by the bin width of 0.05 MeV. All calculations have been performed with TALYS.
For all elements, Figure 5A indicates that the number of PG increases at increasing proton energy up to approximately 30 MeV (i.e., in the BP region), where it becomes relatively constant. The curves for 12-Carbon and 16-Oxygen are very similar, while all candidate materials have a much steeper initial growth, and are always characterized by a larger cross section. The gap is over 4 orders of magnitude for 15 MeV protons, and drops down to approximately 1-2 orders of magnitude above 30 MeV, where 31P gets closer to 12C and 16O.
To investigate the characteristic de-excitation gammas of each material, we simulated an irradiation with protons of different energies in the range 0–25 MeV and 0–70 MeV, chosen as representatives of the radiation field seen by the tumor and by the surrounding normal tissue, respectively. The differential cross section in energy dσPG/dE for all materials are plotted as a function of the gamma energy in Figures 5B–F. In addition, the dσPG/dE values calculated with TALYS for the most probable excited states are reported in Table 2, together with the corresponding reaction chains. Independently of the proton energy, all label elements generate most PGs below 2 MeV, while for 12C and 16O the most probable gamma energy is above 3 MeV, as already observed by [20,41,49–52]. At increasing proton energy (0–70 MeV dataset), the production cross section increases independently of the gamma energy. For 12C, 16O, and 31P some de-excitation channels appear to be extremely improbable at low proton energy (σPG ≈ mb) but become dominant at higher energy (σPG ≈ b). Although 12C and 16O can generate gammas in the same energy range of the candidate materials, their σPG appear much lower, and thus we expect a clear signature when the labeling elements are irradiated with protons.
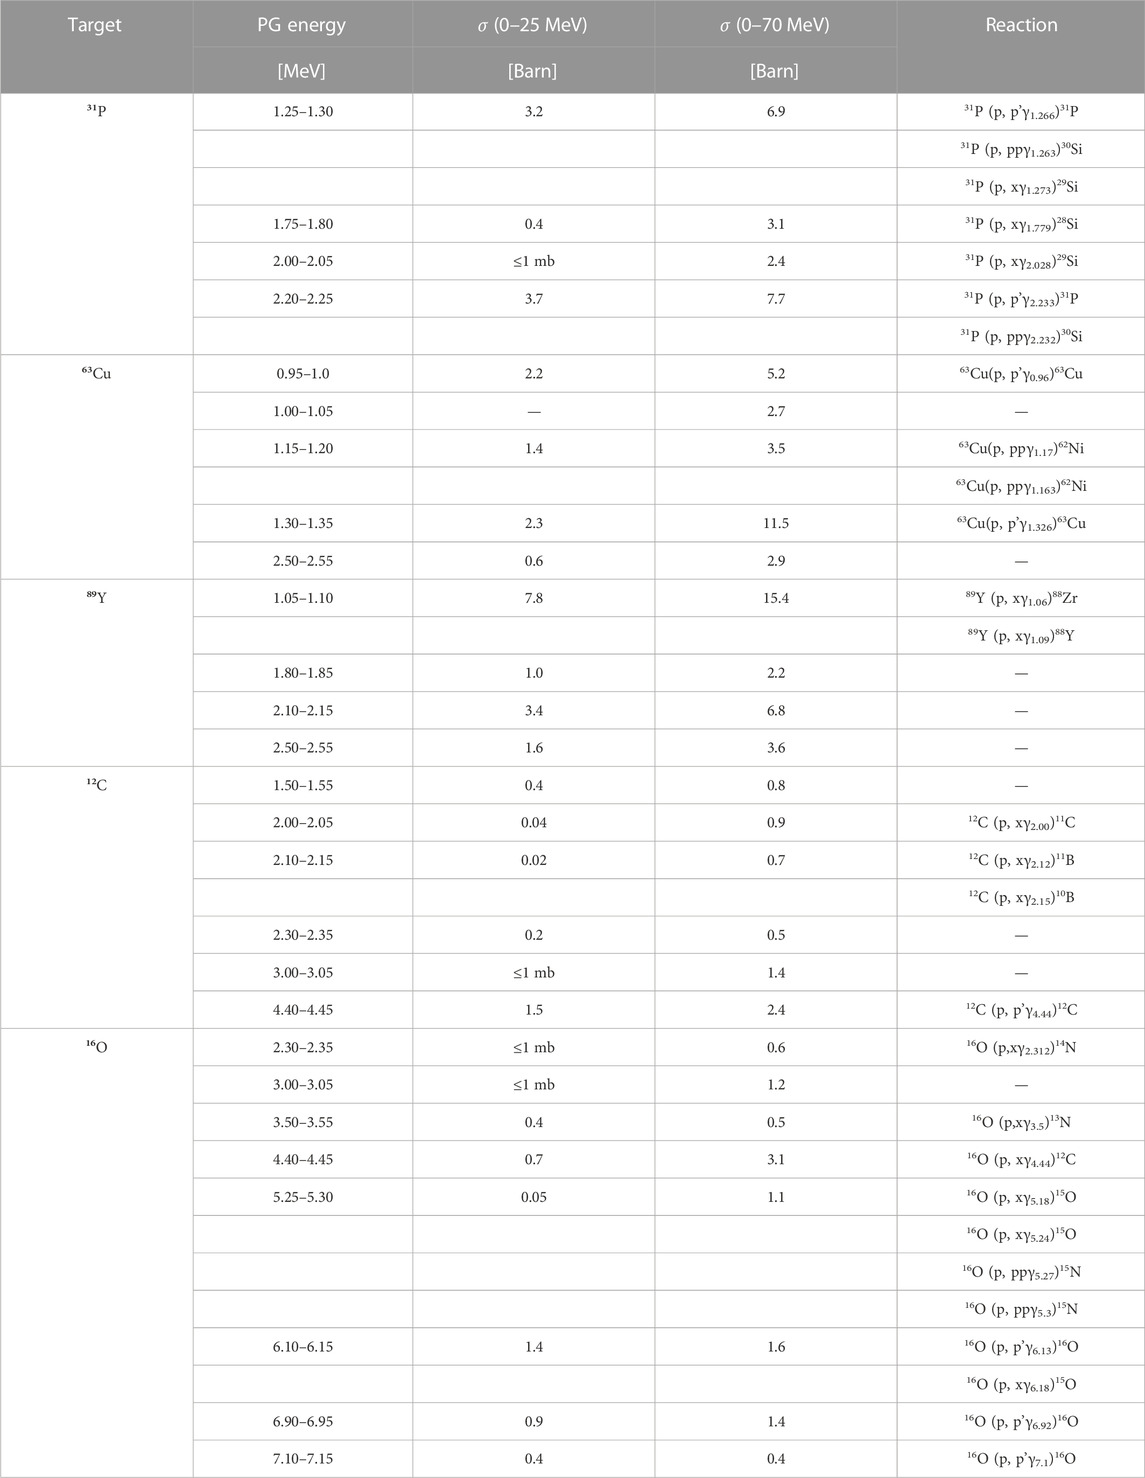
TABLE 2. List of most probable prompt gammas generated by nuclear interactions between protons and either the candidate elements (31P, 63Cu, and 89Y), or 12C and 16O used as proxies for tissues. The PG production cross sections σPG were evaluated with TALYS, by counting all gammas of a given energy generated in the material with a 0.05 MeV resolution (bin width). The results are reported for two different proton energy ranges (0–25 and 0–70 MeV). The production reactions reported (where identified) are from the NUDAT database [62].
From panels (b)-(d), we selected the PGs with the highest dσPG/dE, and calculated their production σPG as a function of the incident proton energy. The results are reported in Figure 6, and suggest that the proton energy corresponding to the largest cross section varies significantly both with the material and gamma energy. As for the dσPG/dE of Figure 5, the σPG are calculated for gammas within a 0.05 MeV energy interval, which reflects the LaBr3:Ce energy resolution (Figure 1B). The 1.25–1.30 MeV gamma from 31P has a clear peak at 10 MeV protons, while the 2.20–2.25 MeV signature has a small peak at 10 MeV and a broader one between 15 and 30 MeV protons. The two lowest signature gammas from 63Cu have a relatively flat production cross section for the entire proton energy range, with a slight increase below 20 MeV. The high-energy gamma at 1.30–135, instead, has a clearly different behavior, with two well-defined peaks at 15 and 50 MeV protons. Both characteristic gammas of 89Y show the highest cross section between 20 and 30 MeV protons. The 4.4–4.45 MeV PG from 12C has a steep increase in the production for protons below 25 MeV, while the 3.00–3.05 MeV is much flatter, and slightly grows below 40 MeV proton energy. The two PGs of 16O have similar behavior, with a first small and narrow peak around 18 MeV protons, and then a large and almost flat region above 40 MeV.
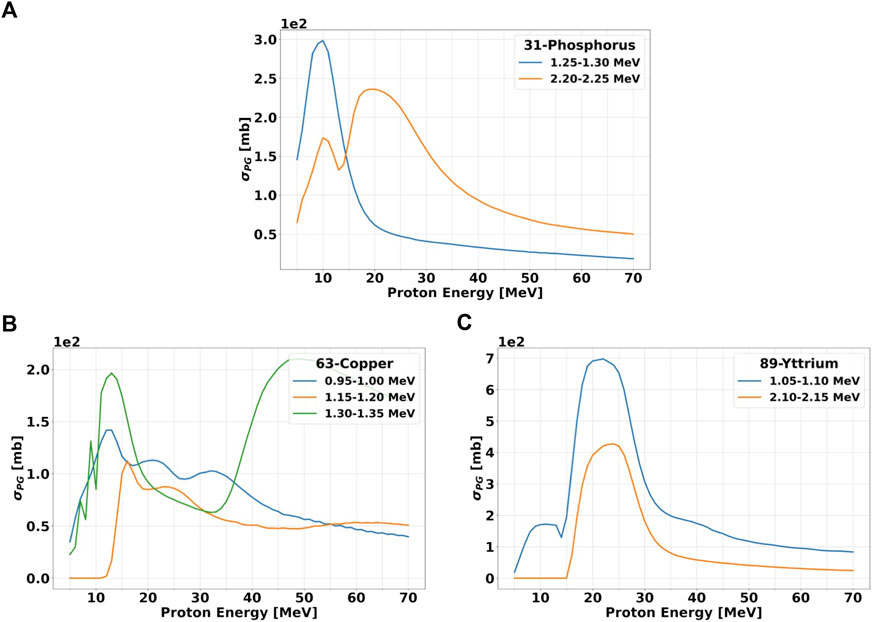
FIGURE 6. Production cross section σPG versus incident proton energy for gammas of selected energies. The data are shown for the three candidate elements: 31P (A) 63Cu (B) and 89Y (C). The proton energy step is set to 1 MeV. The gamma energy range over which the cross sections have been evaluated is the same as Figures 5B–F and it is specified in the legend. All calculations have been performed with TALYS.
The fact that some datasets do not show a single peak suggests that more than one characteristic gamma is present in the considered energy range. This behavior will be reflected also in the experimental measurements because the LaBr3:Ce energy resolution will not allow to discriminate gammas with energies within ≈0.05 MeV.
According to TALYS calculations, the characteristic gammas which present the sharpest σPG peak, and thus better correlate with a given proton energy, are 1.25–1.30 MeV for 31-Phosphorous, 1.30–1.35 MeV for 63-Copper and both 0.95–1.00 MeV and 1.15–1.20 MeV for 89-Yttrium. Considering that the proton kinetic energy at the Bragg peak is around 10 MeV, the element that will provide the largest yield of signature gammas at the end-of-range is 31-Phosphorous. Data reported by [41], [6] show that the σPG for most characteristics gammas of 12-Carbon (4.44 MeV) and 16-Oxygen (61.3 MeV) reach their maximum of ≈150 mb between 10 and MeV 20 proton energy.
To study the PG production of the selected elements when exposed to protons, we performed two sets of measurements:
1. We irradiated solid targets made 100% of the candidate materials to characterize the PG spectrum, and to identify the signature peaks typical of each element;
2. We irradiated water-based solutions containing the label elements at different concentrations, and measured the PG emission as a function of the element concentration.
The aim of these measurements was to verify that the presence of the label element creates a signature spectrum different from the tissue background, and to find what are the lowest element concentrations at which the signature can still be detected.We measured the PG energy spectra of pure solid 63Cu and 89Y targets irradiated with protons at 25 and 70 MeV. 31P could not be studied because of the safety constraints related to the production of a solid target only composed of this material. During the experimental campaign, liquid water was also characterized to simulate the background produced by the tissues. The results are reported in Figure 7 together with TOPAS predictions.
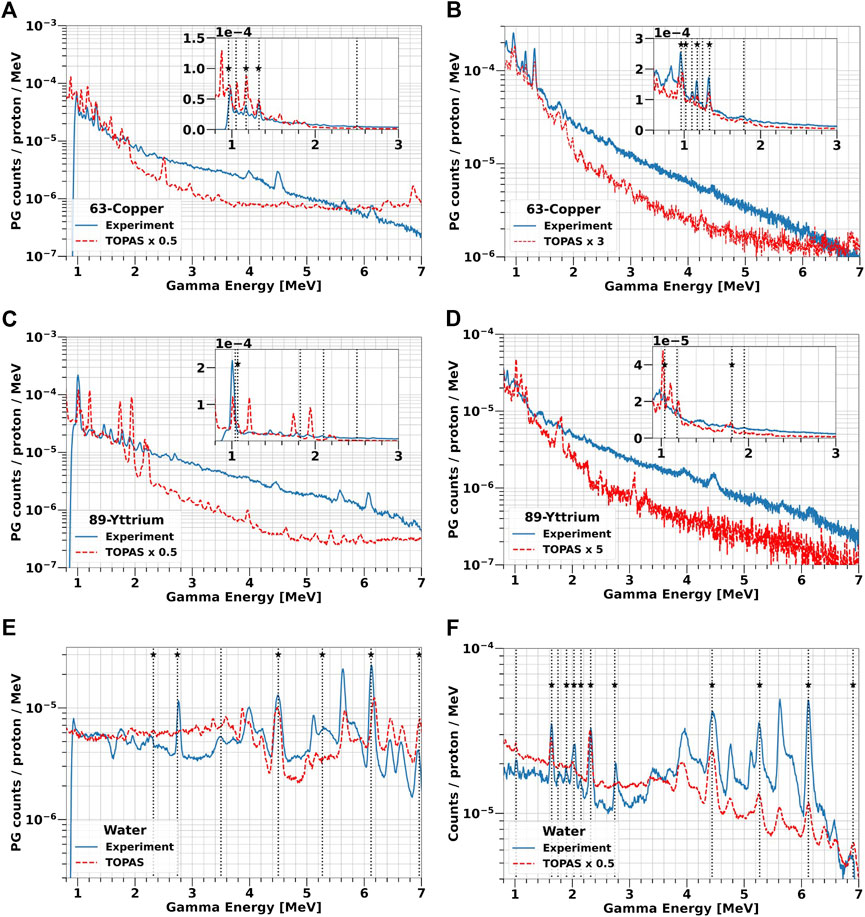
FIGURE 7. PG energy spectra from solid 63-Copper and 89-Yttrium targets and water irradiation at 25 MeV (A, C, E) and 70 MeV (B, D, F) proton beam. The experimental data are plotted as blue solid lines, while TOPAS simulations are reported as red dashed lines. The boxes in (A–D) contain a zoom of the spectra in the low-energy region between 1 and 3 MeV. The vertical lines indicate all the PG peaks experimentally detected, while the stars mark those predicted by TALYS (Table 2).
The two energy spectra acquired with 63-Copper (Figures 7A, B) both show characteristic peaks at 0.96 MeV, 1.17 MeV, and 1.33 MeV, which are the first excited states of 63Cu and 62Ni in agreement with TALYS simulations and NUDAT data (Figure 5C; Table 2). Of the two additional peaks predicted by TALYS at 1 MeV and 2.5 MeV, only the low-energy one can be identified in the experimental data. The spectra overall shape is independent of the proton energy, but a higher PG yield is observed at 70 MeV. TOPAS reproduces the trend of experimental data in the energy region of interest (1–3 MeV), but predicts additional peaks which are not visible in the measured spectra. Below 3 MeV, the yield is overestimated on average by a factor of 2 at low protons energy but underestimated approximately by a factor of 3 at 70 MeV. In the high-energy region, TOPAS precision is very limited in reproducing both the spectrum shape and the yield.
Figures 7C, D show the gamma spectrum emitted by the 89Y target. At 25 MeV, we could only observe the peak at 1.06 MeV, which is predicted by TALYS and listed in NUDAT. Also at 70 MeV, the peak related to the 88Zr production appears at 1.06 MeV. Additional characteristic PG peaks can be observed up to 2.5 MeV, but we could not link them either to the decay of 89Y nuclei or of their fragments. Unlike 63-Copper, both the experiments and TOPAS indicate a higher PG yield for 25 MeV proton. The peaks predicted by TOPAS do not always match the measurements. Below 3 MeV, the simulated PG yield is on average a factor 2 higher than the experimental data at 25 MeV and a factor 5 lower at 70 MeV.
The measured spectra indicate that water mostly produces PGs between 2 MeV and 7 MeV (Figures 7E, F, validating the results reported in literature [41,52,53] and in NUDAT, as well as the values obtained from TALYS (Figures 5E, F). Gammas are generated from the de-excitation of 12C and 16O nuclei, as well as of their fragments produced by nuclear interactions with the protons. At both beam energies, the most probable PGs are produced at 4.44 MeV from 12C to 6.13 MeV from 16O, as well as peaks at 6.9 MeV and 7.1 MeV coming from the third and fourth 16O energy levels, respectively, which are more visible at 25 MeV than at 70 MeV. Single and double escape peaks can be also identified next to the main peaks. Below 3 MeV, the spectrum contains the additional signatures at 2 MeV and 2.31 MeV, generated by 11C and 15O, and 2.7 MeV created by 10B, 11C, 14N and 16O. The PG yield grows at higher proton energy, as a direct consequence of the increasing nuclear fragmentation cross section [2]. Traversing a longer path in the target (6 mm at 25 MeV versus 41 mm at 70 MeV), protons have a higher probability to interact with the 12-Carbon and 16-Oxygen nuclei, and thus to produce secondary fragments, whose decay might generate PGs. In the spectrum of panel 7f, we identified characteristic gammas from 15N (5.27 MeV), 14N (1.64 MeV, 2.3 MeV) and 11C (2.0 MeV), which are all 16-Oxygen fragments.
To characterize the PG emission of all candidate materials in a more realistic scenario, we irradiated water-based solutions of 31P, 63Cu, and 89Y. We used different concentrations, ranging between 0.1 and 2 M to check the dependence between the element abundance and the yield of characteristic PGs as well as the overall PGs enhancement. Using a liquid target, we were also able to study 31-Phosphorous, whose characteristic gammas could not be investigated with a solid target. The gammas emitted by all solutions exposed to 25 and 70 MeV protons are presented in Figure 8, together with the spectra measured with pure water.
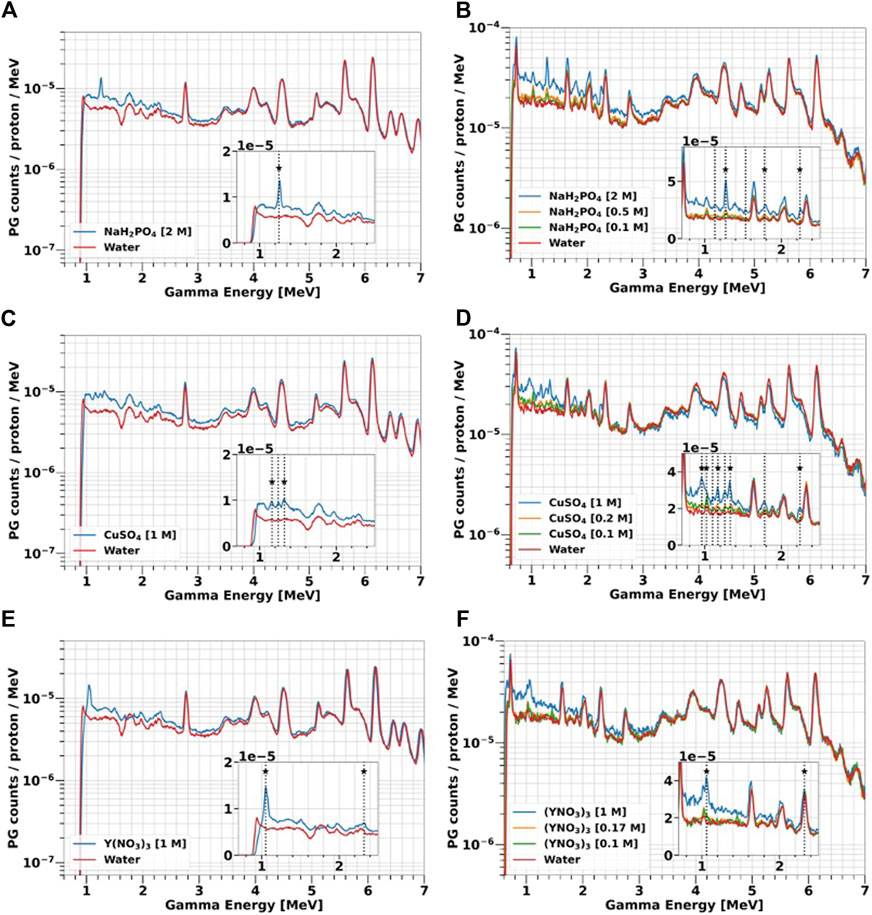
FIGURE 8. PGs emitted by water-based solutions of 31P (A, B), 63Cu (C, D) and 89Y (E, F) at different concentrations (0.1–2 M) and exposed to 25 and 70 MeV protons. The details of the experiments can be found in Section 2.2. The spectra acquired with water are plotted as a representation of the tissues background. The boxes contain a zoom of the spectra in the low-energy range. The vertical lines indicate all the PG peaks experimentally detected, while the stars mark those predicted by TALYS (Table 2).
Independently of the proton energy, element type and concentration, the largest PG enhancement compared to water is always observed below 3 MeV, which is the region where the characteristic gammas of the investigated elements are emitted, as indicated by the solid target results (Figure 7). The overall yield is always higher at 70 MeV, because protons traverse a longer path in the solutions, and thus the probability of interactions is larger as already discussed for water. By reducing the element concentration in the solution, the height of both the characteristic gamma peaks and of the continuum background decrease, approaching the water spectrum. At the lowest concentration (0.1 M), most of the signature peaks are less defined, due to the lower interaction probability between protons and the marker element. The PG enhancement becomes negligible above 4 MeV, where the gamma emission characteristic of 12-Carbon and 16-Oxygen dominate. Even at the maximum concentrations, 16-Oxygen still represents the main component of the solution, and thus the spectra acquired with the liquid targets are very similar to those obtained when using pure water in that gamma energy range.
The 31-Phosphorous solution NaH2PO4 (Figures 8A, B) present two main signatures peaks at 1.26 and 2.23 MeV, with the latter only detected with 70 MeV protons. According to TALYS and NUDAT (Table 2), these gammas are generated by de-excitation of either 31P or its fragments 30Si and 29Si. TALYS predicts two additional Silicon de-excitation peaks at 1.77 MeV and 2.03 MeV, which however are not listed in NUDAT and are not visible in the experimental spectra.
At 70 MeV, the 63-Copper solution CuSO4 produces the same signature gammas observed for the solid targets (Figures 7A, B) at 0.96 MeV, 1.17 MeV and 1.3 MeV. We detected an additional peak at 2.2 MeV, that does not correspond to any 63Cu de-excitation, and we hypothesize that it is generated by the 32S (p,p’γ2.23)32S reaction, due to the presence of 32-Sulfur in the CuSO4 salt. At 25 MeV (Figure 8C), only the 1.17 MeV and 1.33 MeV signature peaks are visible.
Gamma energy spectra for 89-Yttrium solution Y(NO3)3 are shown in Figures 8E, F. For both proton energies, we detected the 1.06 MeV peak from 88Zr de-excitation, already observed with the solid target (Figures 7C, D). We also identified a signature peak at 2.3 MeV, generated by the de-excitation of 14N according to NUDAT. 14-Nitrogen is either a component of the Y(NO3)3 salt or a 16-Oxygen fragment produced by nuclear reactions. To assess the contribution from these two sources, we took advantage of the water spectrum, where 14-Nitrogen can only be produced by fragmentation. At 25 MeV, the 14-Nitrogen peak in water is much lower than in the 89-Yttrium solution, indicating that most of the 2.3 MeV PG are generally produced by de-excitation of 14-Nitrogen contained in the salt. At 70 MeV, instead, the peaks of water and the 89-Yttrium solution match, indicating that fragmentation is the dominant process for 14-Nitrogen creation.
From the spectra measured with the 70 MeV beam, we could also estimate the signature gamma production yield as a function of the element concentration, whose results are shown in Figure 9. [54], [55] investigated the same aspect, and reported that the characteristic PG yield versus element concentration is well described by a two-parameters logarithmic function. However, this trend describes the gamma production in a broader concentration range, which extends on values much higher than the maximum of
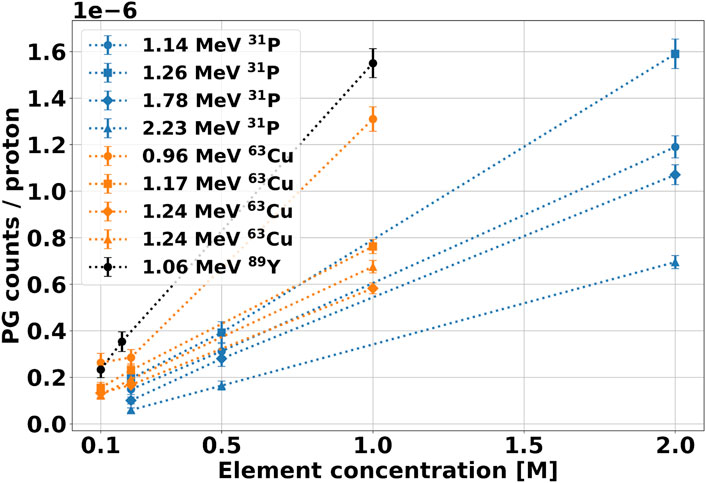
FIGURE 9. Yield of signature gammas as a function of the element molar concentration in the solution after irradiation with 70 MeV protons. The PG counts have been calculated from the integration of the corresponding peak in the spectra of Figure 8. The background contribution from water has been subtracted from the spectrum, and the results have been normalized to the number of protons incident on the target.
At the highest concentration, we compared all experimental data with TOPAS simulations. The results are reported in Figure 10 for all label elements. As already observed for the solid targets, TOPAS is relatively accurate in predicting the PGs energy both for the selected elements and for water. However, the code does not correctly reproduce the PG yield, ranging from an overestimation of factor 2 to an underestimation of factor 5, without a clear trend. In addition, for a given data set the factor appears to vary depending on the PG energy, especially between the low-energy region below 3 MeV and the high-energy region above 4 MeV.
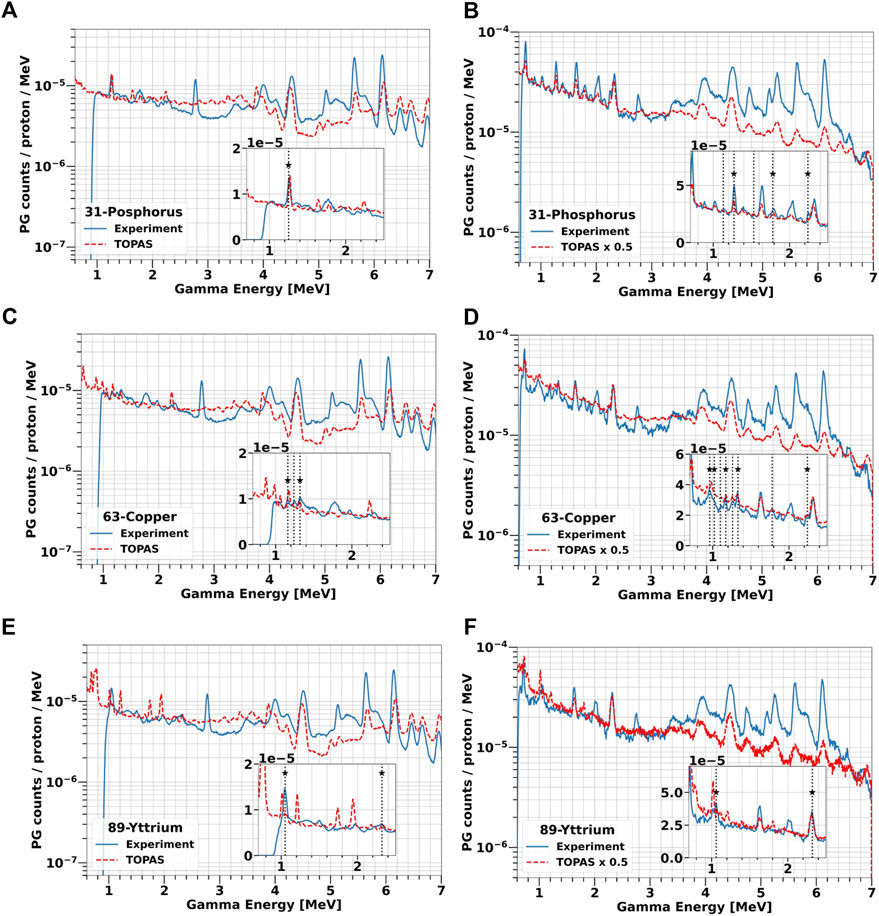
FIGURE 10. Comparison of experimental and simulated PG energy spectra from water-based solutions of 31P [2 M, (A, B)], 63Cu [1 M, (C, D)] and 89Y [1 M, (E, F)] irradiated with 25 and 70 MeV protons. All simulations were performed with TOPAS. The measurements are plotted as blue solid lines while TOPAS predictions are red dashed lines. The vertical lines indicate all characteristics PGs experimentally detected, while the label stars mark those in agreement with TALYS.
Overall, both the experimental data and TOPAS simulations confirmed that 31P, 63Cu or 89Y produce several characteristic gammas different from the tissue background when irradiated with protons in the energy range typical of the tumor region.
Using the liquid targets results, we were able to extrapolate the production of characteristic PGs for a more realistic clinical scenario, where we assumed the following conditions: i) an element concentration in the tumor of 0.4 mM (corresponding to 0.0009%, 0.002%, 0.003% mass fraction of 31P, 63Cu and 89Y respectively), ii) 109 protons delivered to the tumor and iii) a 5 sr solid angle covered by the detector. Although there are no specific studies for tumor uptake of the selected elements, a concentration up to 0.4 mM has been observed for glucose in colon cancer [56]. Based on this data, we hypothesize that if we employ a glucose-carrier, such as 2-deoxy-D-glucose used in FDG, a 0.4 mM concentration of the signature element can be achieved in the tumor. In the calculation, we used 109 protons, as this value represents a typical order of magnitude delivered for a single energy slice in a two-fields treatment plan with a prescribed dose of 2 Gy per fraction [57]. The detector solid angle was estimated assuming a PET-like detection system, i.e., a cylindrical geometry with 30 cm radius and 20 cm length [58].
To calculate the PG yield at a 0.4 mM concentration, we performed a linear regression on the curves of Figure 9, and used the fit parameters to extrapolate the desired gamma count. We could apply this method for the 70 MeV protons dataset but not at the lower energy, where we measured the spectra with only one element concentration. The linear parameters obtained from the fit are reported in Table 3, together with the R2 values. All intercepts (a) are consistent with zero within the error bar, indicating that no signature gammas are emitted when the element concentration is null. The error bar on the intercept reflects the accuracy of the background subtraction procedure. It provides us with an estimate of the smallest yield of signature gammas we can detect with the selected experimental conditions. The R values obtained from the fit support the hypothesis of a linear relationship between element concentration and yield of the characteristic gammas for such low concentrations. Based on this finding, we estimated the gamma production at 0.4 mM by applying a scaling procedure. For the 70 MeV, we used the fit slopes b of Table 3 multiplied by 0.4 mM, while for the 25 MeV beam, we scaled the yield from the measured concentration. The number of projected signature PGs for all elements and gamma energy is reported in Table 4 for both proton beams.
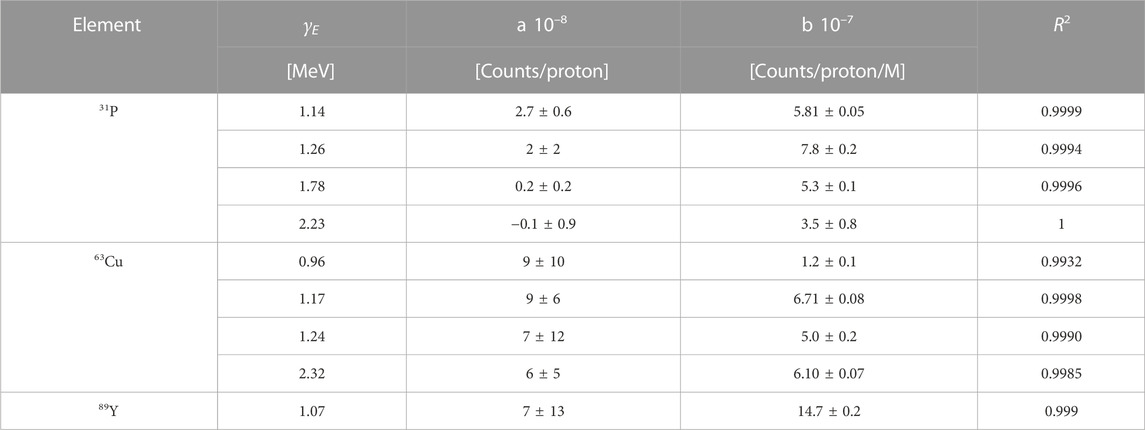
TABLE 3. Parameters obtained by fitting the experimental data of Figure 9 with a linear function y = a + b x.
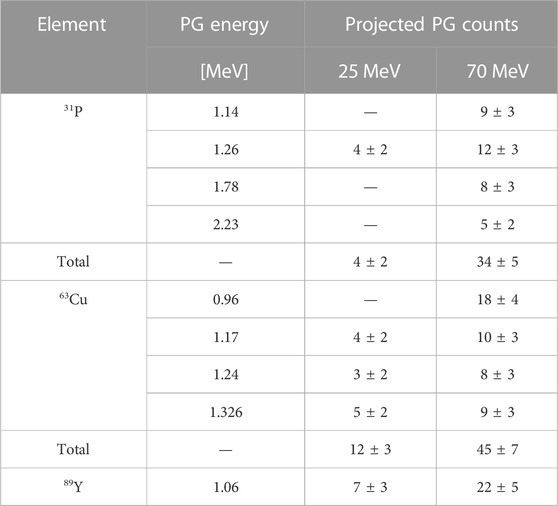
TABLE 4. Expected count of signature PGs generated by 25 and 70 MeV beams, with the following conditions: 0.4 mM element concentration in the tumor, 109 protons delivered and a detection apparatus covering 5 sr. The values for 0.4 mM have been obtained either by scaling the data at the measured concentration (25 MeV) or using the parameter b of Table 3 (70 MeV). The uncertainties on the single gamma lines are assessed as the square root of the counts, while the error propagation on the sum was considered for the total number of projected gammas.
As the two beam energies correspond to ranges of ≈5 mm and ≈40 mm, the number of characteristic gammas can be considered as representative of the beginning and end of the tumor region, respectively. As already observed for the liquid targets, the PG yield increases with increasing proton energy. Still, in both cases, we expect to detect a signature above the background for all candidate elements, if we consider the single peaks or we sum all the contributions together.
To further evaluate the utility of the proposed methodology, we investigated the correlation between the yield of characteristic PGs and the proton range. The experimental data could not be used for this purpose, as only two beam energies were investigated, and thus we used TOPAS. For the simulations, we employed the geometry described in Section 2.3 to calculate the gamma spectrum generated by a soft tissue phantom, loaded with the label elements in a specific region mimicking the tumor. The phantom was irradiated with proton beams of different energies, that stopped upstream, inside or downstream of the tumor. We scored the signature PG spectra of the three candidate elements considering all gammas emerging from the phantom, integrated the signature peaks listed in Table 4, and subtracted the background contribution from soft tissue. The results obtained for 109 protons and a 0.4 mM element concentration are plotted in Figures 11A, E as a function of the proton range.
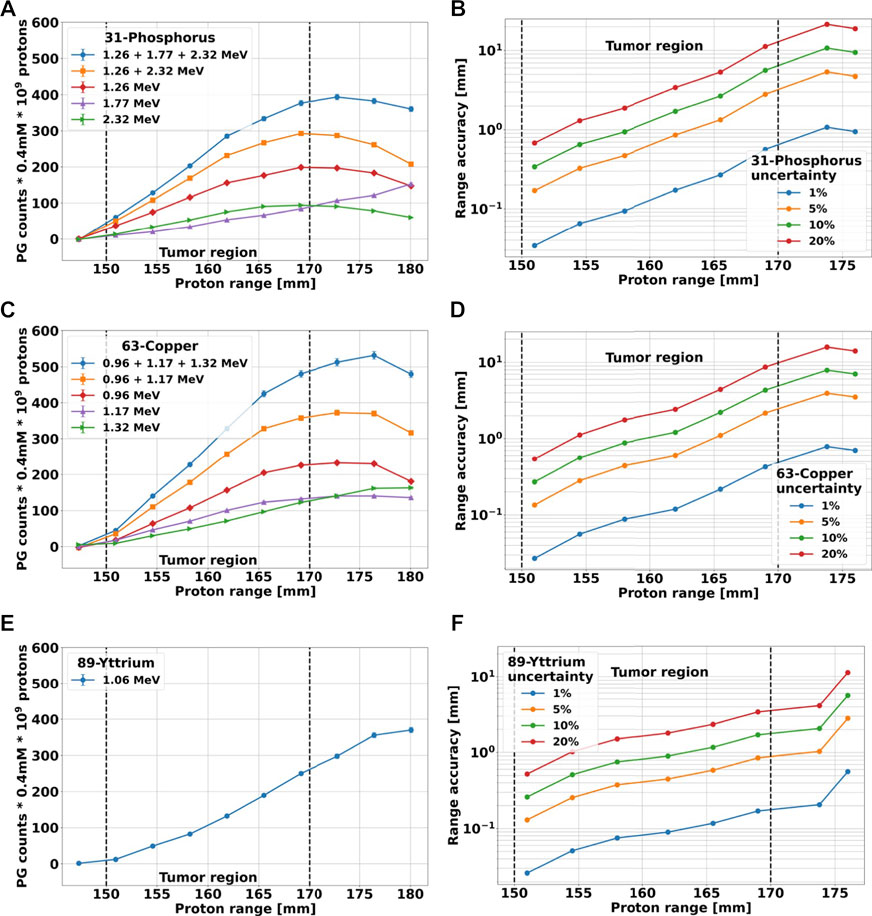
FIGURE 11. (A, C, E): counts of characteristic PGs of 31P, 63Cu and 89Y, respectively, plotted as a function of proton range. The results have been obtained with TOPAS, using the geometry described in Section 2.3 for simulating the irradiation of a soft-tissue phantom with protons of different energies. The labeling elements are only contained in the tumor region, here marked with dashed lines. All simulations were run to achieve an uncertainty below 1%, but the counts have been scaled to 109 incoming protons and a 0.4 mM element concentration. The background produce by soft tissue has been subtracted. (B, D, F): Proton range accuracy versus range calculated from the cumulative blue curves of (A, C, D) when different percentage errors on the PG count are considered.
To increase the signal-to-noise ratio, for 31-Phosphorus and 63-Copper we added up signature gammas of different energies. To obtain the highest count, we considered the sum of all characteristic PGs, while to achieve the best count-range correlation at the tumor far-edge, we selected only PGs that followed the behavior described by ii). The results are also reported in Figures 11A, C. All cumulative curves show a steeper increase in the PG counts than the single curves. With the exception of the 31P curve for 1.26 + 2.32 MeV, which reaches its maximum value at the tumor far-edge and immediately start to decrease, all other curves exhibit a plateau downstream of the tumor region.
Finally, we used the cumulative curves including all characteristics PGs to estimate the correlation between the number of gammas detected and the accuracy in predicting the proton range. We considered an uncertainty on the PG counts of 1%, 5%, 10% and 20%. For each point of the cumulative curve and each percentage error, we calculated the minimum and maximum proton range that could be associated to a given PG count as the projection of the PG uncertainty onto the range axis. The average deviation from the nominal range was plotted in Figures 11B, D, F for all elements. The shape of all curves is very similar, showing an initial slow growth of the range uncertainty with the proton range, followed by a steep rise towards the tumor far-edge and downstream of it. For each element, the curves are very close in the first part independently of the uncertainty percentage, but then they deviate in the second part and indicate a stronger dependence of the range accuracy on the PGs count error for longer proton ranges. In fact, independently of the gamma count error, the range accuracy becomes worse for beams with enough energy to traverse the entire tumor and stop downstream of it. The datasets of 31P and 63Cu reach a maximum value downstream of the tumor edge, while the 89Y curves keep growing. These results suggest that the presented methodology can match the range resolution of 2–3 mm currently obtained on patients with other PG-based methodologies [22,59], if signature PGs are acquired with an uncertainty below 10% for 31P and 63Cu, and 20% for 89Y.
In vivo, real-time range assessment remains an unmet need in particle therapy. The most promising methodologies exploit the correlation between the primary beam dose profile and the spatial distribution of secondary radiation generated through nuclear interactions and emerging from the patient. In this framework, several studies have focused on prompt gamma production during treatment, and have led to the first clinical trial dose validation with PGs detection using the IBA knife-edge slit camera [21]. The current proton range resolution reached by PG-based approaches is as low as 2–3 mm [59].
In this study, we present an approach for real-time range verification in proton therapy based on creating a PG signature spectrum emitted only by the tumor. To obtain a spectrum significantly different from the background created by tissues, we propose to load the tumor with a non-radioactive element delivered before treatment with a high-selectivity carrier. In this way, if the beam misses the tumor, no characteristic PGs will be emitted. If instead the protons enter the tumor, we can exploit the correlation between their range and the characteristic PG yield to assess the tumor position with respect to the planned target volume, providing an online verification of the delivered treatment plan. To achieve this goal, we will follow the same approach proposed in [41], but instead of relying only on the production of 12-Carbon and 16-Oxygen prompt gammas, we will also take advantage of those produced by the labeling element.
In this work, we discussed the key points for the applicability of the technique and investigated the proton range accuracy that can be potentially achieved. As a first step, we identified elements with suitable features for this application. We started from the list of elements that are already used on patients, for which both toxicity studies and a carrier already exist, and used TALYS and NUDAT to identify those that emit characteristic gammas different from normal tissue. Following this process, we selected three candidates: 31-Phosphorus, 63-Copper and 89-Yttrium. We then investigated their PG spectra with two experimental campaigns, where we irradiated both solid targets that made 100% of the elements and water-based liquid targets with 25 and 70 MeV protons. The results (Figures 7, 8) confirmed that all candidate materials produce signature gammas below 3 MeV, i.e., outside the regions where the main peaks of 12-Carbon and 16-Oxygen are located, being the two elements most abundant in tissue. For each element, we identified the gammas with the most visible peak and highest yield, which can be used as a signature (Table 4). From the experiment, we also learned that for ranges of mass fractions considered here, the relationship between the gamma yield and element concentration can be approximated with a linear function (Figure 9; Table 3). This outcome allowed us to evaluate the number of signature PGs that would be emitted in a realistic case assuming i) a reachable uniform uptake of the element in the tumor, ii) a number of protons corresponding to an energy slice, and iii) an achievable detector solid angle (Table 4). The results indicate that, when irradiated with 25 and 70 MeV protons, all candidate elements create enough characteristic gammas to be detected above the normal tissue background. Although the measurements only describe the behavior for two beam energies, these values correspond to a range of 0.5 and 40 mm, respectively, and thus are representative of the beginning and end of the tumor area.
We also compared the measurements to TOPAS Monte Carlo simulations, to assess the code accuracy in reproducing the PG production reactions, and verify if we could use it as an additional tool to investigate our approach. The findings indicated that TOPAS is adequately accurate in predicting the energy of all characteristic gammas, but not their yield, which is either underestimated up to a factor 5 or overestimated by a factor 2, depending on the target and proton energy without suggesting a clear systematic trend. This outcome suggests that the nuclear models included in TOPAS might not be very accurate in predicting the yield of prompt gammas, especially in the high-energy region, as was already reported in [60], [61]. The data also indicate that the discrepancy is not constant, but depends on the target type (solid versus liquid) and material. Because the size of solid targets made of 63-Copper and 89-Yttrium is smaller than the beam lateral wide, not all primary protons traverse the target. This geometry was fully reproduced by TOPAS, but uncertainty on the beam width, as well as target misalignment, can contribute to fluctuations in the prompt gamma yield. This hypothesis is supported by the fact that for liquid targets, whose size is the same for all elements and much larger than the beam width, the discrepancy between the experiment and simulation is constant for each proton beam.
Because TOPAS can reproduce correctly all signature gammas, we could employ it to obtain a proof-of-principle of the proposed methodology and to investigate the potential proton range accuracy achievable under realistic conditions of protons delivered, tumor uptake of the element and detector geometry. The outcomes shown in Figure 11 indicate that the yield of characteristic PGs has a strong correlation with the proton range. When the beam stops upstream of the tumor, where no marker element is present, the yield of signature gammas after background subtraction is zero. At increasing proton range, the number of interactions between the beam and the elements increases, and thus the yield of characteristic PGs grows. The relation between PG counts and range is linear at the beginning, then levels out and starts decreasing. The slope, range at which the curves flatten out as well as the plateau extension, depends on the element type and gamma energy.
A fully linear behavior, like 89-Yttrium, implies a continuous change of the PG counts with the proton range. This correlation translates into a range accuracy below 2 mm up to 5 mm from the tumor edge, even for 10% error on the gamma yield. On the other hand, the fact that the PG count reaches its maximum at the tumor far-edge, as exhibited by 31-Phosphorous and 63-Copper, provides an easily recognizable indicator that protons are stopping in the proximity of the tumor edge. However, this part of the curve either has a small slope or is flat and thus the correlation between the number of PGs created and the proton range is weaker. This reflects on the range uncertainty, which steeply increases around the tumor edge for each given PG error. To achieve a range accuracy below 3 mm with 31-Phosphorous or 63-Copper, the uncertainty on the PG count has to be below 5%. To further boost the number of signature gammas, both the element concentration and the detection system could be optimized. For our calculation, we hypothesized a 0.4 mM element uptake in the tumor, as a possible value achieved in clinical practice. However [58], reported that up to a 2 mM 2-deoxy-D-glucose concentration can be reached in the tumor without toxicity effects with a slow-release pump administration. This could increase the PG production by a factor of 5. In addition, all our estimates are based on the LaBr3:Ce detection efficiency, which could be further improved by using another system. Another important factor related to detection is the solid angle, and we hypothesized that a 5 sr could be achieved using a PET–like system. However, this has never been implemented in a gantry, and its functionality in this setup will have to be investigated.
An important point for the success of this methodology is the ability to correctly characterize the background, which is then subtracted from the measured PG spectrum to assess the absolute number of signature prompt gammas. The background depends on several factors, including the tumor type and location, as well as the patient’s anatomy, and for this reason, is highly variable from patient to patient. We propose two strategies to address this issue:
• We will build a database of background measurements. It will include data collected on patients that are treated for different malignancies, as well as a library of the PG spectrum emitted by different tissues. We will use all these inputs to train a machine-learning model that can predict the background on the base of the patient’s CT scan.
• During the first treatment faction, we will not administer the label element to the patient, and measure the background. We will use the experimental spectrum to tune that predicted by the machine learning model.
This approach will allow having an accurate and personalized characterization of the background of each patient. Anatomical changes or misalignments that can occur between fractions might affect the background. To take into account this effect, the spectrum measured during the first faction will be further optimized to match the flat regions in between peaks of the data acquired in the following sessions with the label element.In conclusion, the findings reported in this study, indicate that loading the tumor with an element that emits signature PGs different from the tissue background has the potential to reach a superior accuracy of in vivo range verification, either standalone or in combination to existing techniques. The outcome presented here represents a proof-of-principle of this methodology, but to fully evaluate its usefulness, several other sources of uncertainties have to be considered, such as patient alignment, full anatomical geometry, element uptake inhomogeneity inside the tumor or traces of the signature element in the surrounding normal tissue. Assessing these contributions to the overall range uncertainty will be a key to progress toward the applicability of the proposed approach to the clinics.
The raw data supporting the conclusion of this article will be made available by the authors, without undue reservation.
CL, LP, and MM contributed to the conception and design of the study. MV participated and supported to the data taking at Cyrcé facility. GC and EF set up the detection system performed Monte Carlo simulations and analyzed the results. All authors contributed to the manuscript revision, and read, and approved the submitted version.
This work has been partially funded by INFN CSN5.
LP acknowledges support from the National Research Foundation of South Africa. The authors thank M. Pellicioli, J. Schuler, C. Haas, and N. Dick-Schuler for their technical support and valuable help with the Cyrcé cyclotron. Thank also to professor F. Camera for providing the LaBr3(Ce) detector and its contribution in the characterization. Thanks to E. Verroi for the fundamental technical support at Trento protontherapy center. The authors also thank Professor G. Guella and F. Trenti for the preparation of water solutions for liquid targets.
The authors declare that the research was conducted in the absence of any commercial or financial relationships that could be construed as a potential conflict of interest.
All claims expressed in this article are solely those of the authors and do not necessarily represent those of their affiliated organizations, or those of the publisher, the editors and the reviewers. Any product that may be evaluated in this article, or claim that may be made by its manufacturer, is not guaranteed or endorsed by the publisher.
1. Durante M, Orecchia R, Loeffler JS. Charged-particle therapy in cancer: Clinical uses and future perspectives. Nat Rev Clin Oncol (2017) 14:483–95. doi:10.1038/nrclinonc.2017.30
2. Durante M, Paganetti H. Nuclear physics in particle therapy: A review. Rep Prog Phys (2016) 79:096702. doi:10.1088/0034-4885/79/9/096702
3. Paganetti H. Range uncertainties in proton therapy and the role of Monte Carlo simulations. Phys Med Biol (2012) 57:R99–R117. doi:10.1088/0031-9155/57/11/r99
4. Schuemann J, Dowdell S, Grassberger C, Min C, Paganetti H. Site-specific range uncertainties caused by dose calculation algorithms for proton therapy. Phys Med Biol (2014) 59:4007–31. doi:10.1088/0031-9155/59/15/4007
5. Knopf A-C, Lomax A. In vivo proton range verification: A review. Phys Med Biol (2013) 58:R131–60. doi:10.1088/0031-9155/58/15/r131
6. Wrońska A. Prompt gamma imaging in proton therapy-status, challenges and developments. J Phys Conf Ser (IOP Publishing) (2020) 1561:012021. doi:10.1088/1742-6596/1561/1/012021
7. Krimmer J, Dauvergne D, Létang J, Testa É. Prompt-gamma monitoring in hadrontherapy: A review. Nucl Instr Methods Phys Res Section A: Acc Spectrometers, Detectors Associated Equipment (2018) 878:58–73. doi:10.1016/j.nima.2017.07.063
8. Parodi K, Polf JC. In vivo range verification in particle therapy. Med Phys (2018) 45:e1036–50. doi:10.1002/mp.12960
9. Sheldon E, Van Patter DM. Compound inelastic nucleon and gamma-ray angular distributions for even-and odd-mass nuclei. Rev Mod Phys (1966) 38:143–86. doi:10.1103/revmodphys.38.143
10. Min C-H, Kim CH, Youn M-Y, Kim J-W. Prompt gamma measurements for locating the dose falloff region in the proton therapy. Appl Phys Lett (2006) 89:183517. doi:10.1063/1.2378561
11. Maccabee HD, Madhvanath U, Raju MR. Tissue activation studies with alpha-particle beams. Phys Med Biol (1969) 14:213–24. doi:10.1088/0031-9155/14/2/304
12. Enghardt W, Crespo P, Fiedler F, Hinz R, Parodi K, Pawelke J, et al. Charged hadron tumour therapy monitoring by means of PET. Nucl Instr Methods Phys Res Section A: Acc Spectrometers, Detectors Associated Equipment (2004) 525:284–8. doi:10.1016/j.nima.2004.03.128
13. Parodi K, Paganetti H, Shih HA, Michaud S, Loeffler JS, DeLaney TF, et al. Patient study of in vivo verification of beam delivery and range, using positron emission tomography and computed tomography imaging after proton therapy. Int J Radiat Oncology*Biology*Physics (2007) 68:920–34. doi:10.1016/j.ijrobp.2007.01.063
14. Studenski MT. Proton therapy dosimetry using positron emission tomography. World J Radiol (2010) 2:135. doi:10.4329/wjr.v2.i4.135
15. Moteabbed M, Espana S, Paganetti H. Monte Carlo patient study on the comparison of prompt gamma and pet imaging for range verification in proton therapy. Phys Med Biol (2011) 56:1063–82. doi:10.1088/0031-9155/56/4/012
16. Bisogni MG, Attili A, Battistoni G, Belcari N, Cerello P, Coli S, et al. Inside in-beam positron emission tomography system for particle range monitoring in hadrontherapy. J Med Imaging (2016) 4:011005. doi:10.1117/1.jmi.4.1.011005
17. Ferrero V, Fiorina E, Morrocchi M, Pennazio F, Baroni G, Battistoni G, et al. Online proton therapy monitoring: Clinical test of a silicon-photodetector-based in-beam PET. Scientific Rep (2018) 8:4100. doi:10.1038/s41598-018-22325-6
18. Moglioni M, Kraan AC, Baroni G, Battistoni G, Belcari N, Berti A, et al. In-vivo range verification analysis with in-beam pet data for patients treated with proton therapy at cnao. Front Oncol (2022) 12:929949–14. doi:10.3389/fonc.2022.929949
19. Pinto M, Bajard M, Brons S, Chevallier M, Dauvergne D, Dedes G, et al. Absolute prompt-gamma yield measurements for ion beam therapy monitoring. Phys Med Biol (2014) 60:565–94. doi:10.1088/0031-9155/60/2/565
20. Kelleter L, Wrońska A, Besuglow J, Konefał A, Laihem K, Leidner J, et al. Spectroscopic study of prompt-gamma emission for range verification in proton therapy. Physica Med (2017) 34:7–17. doi:10.1016/j.ejmp.2017.01.003
21. Richter C, Pausch G, Barczyk S, Priegnitz M, Keitz I, Thiele J, et al. First clinical application of a prompt gamma based in vivo proton range verification system. Radiother Oncol (2016) 118:232–7. doi:10.1016/j.radonc.2016.01.004
22. Xie Y, Bentefour EH, Janssens G, Smeets J, Vander Stappen F, Hotoiu L, et al. Prompt gamma imaging for in vivo range verification of pencil beam scanning proton therapy. Int J Radiat Oncology* Biology* Phys (2017) 99:210–8. doi:10.1016/j.ijrobp.2017.04.027
23. Hueso-González F, Rabe M, Ruggieri TA, Bortfeld T, Verburg JM. A full-scale clinical prototype for proton range verification using prompt gamma-ray spectroscopy. Phys Med Biol (2018) 63:185019. doi:10.1088/1361-6560/aad513
24. Penninckx S, Hespeels F, Smeets J, Colaux JL, Lucas S, Heuskin A-C. Metallic nanoparticles: A useful prompt gamma emitter for range monitoring in proton therapy? Radiation (2021) 1:305–16. doi:10.3390/radiation1040025
25. Magalhaes Martins P, Freitas H, Tessonnier T, Ackermann B, Brons S, Seco J. Towards real-time pgs range monitoring in proton therapy of prostate cancer. Scientific Rep (2021) 11:15331–13. doi:10.1038/s41598-021-93612-y
26. Burbadge C, Kasanda E, Bildstein V, Dublin G, Olaizola B, Höhr C, et al. Proton therapy range verification method via delayed γ-ray spectroscopy of a molybdenum tumour marker. Phys Med Biol (2021) 66:025005. doi:10.1088/1361-6560/abbd16
27. Koning AJ, Rochman D. Modern nuclear data evaluation with the talys code system. Nucl Data sheets (2012) 113:2841–934. doi:10.1016/j.nds.2012.11.002
28. Perl J, Shin J, Schümann J, Faddegon B, Paganetti H. Topas: An innovative proton Monte Carlo platform for research and clinical applications. Med Phys (2012) 39:6818–37. doi:10.1118/1.4758060
29. Cuong PV, Thiep T, Anh LT, An TT, Hue BM, Thanh KT, et al. Theoretical calculation by talys code in combination with geant4 simulation for consideration of γ, n reactions of eu isotopes in the giant dipole resonance region. Nucl Instr Methods Phys Res Section B: Beam Interactions Mater Atoms (2020) 479:68–73. doi:10.1016/j.nimb.2020.06.011
30. Tommasino F, Rovituso M, Fabiano S, Piffer S, Manea C, Lorentini S, et al. Proton beam characterization in the experimental room of the trento proton therapy facility. Nucl Instr Methods Phys Res Section A: Acc Spectrometers, Detectors Associated Equipment (2017) 869:15–20. doi:10.1016/j.nima.2017.06.017
31. Constanzo J, Vanstalle M, Finck C, Brasse D, Rousseau M. Dosimetry and characterization of a 25-mev proton beam line for preclinical radiobiology research. Med Phys (2019) 46:2356–62. doi:10.1002/mp.13512
32. Camp A, Vargas A, Fernández-Varea JM. Determination of labr3 (ce) internal background using a hpge detector and Monte Carlo simulations. Appl Radiat Isot (2016) 109:512–7. doi:10.1016/j.apradiso.2015.11.093
33. Camera F, Blasi N, Brambilla S, Crespi F, Idini A, Maiolino C, et al. Investigation of the self activity and high energy γ-rays response of a 1”× 1” and 3”× 3” labr 3: Ce scintillators. In: 2007 IEEE Nuclear Science Symposium Conference Record (IEEE); 26 October 2007 - 03 November 2007; Honolulu, HI, USA (2007). p. 1386–1388.
34. Nicolini R, Camera F, Blasi N, Brambilla S, Bassini R, Boiano C, et al. Investigation of the properties of a 1” × 1” labr3: Ce scintillator. Nucl Instr Methods Phys Res Section A: Acc Spectrometers, Detectors Associated Equipment (2007) 582:554–61. doi:10.1016/j.nima.2007.08.221
35. Heilbronn L, Iwata Y, Iwase H. Off-line correction for excessive constant-fraction-discriminator walk in neutron time-of-flight experiments. Nucl Instr Methods Phys Res Section A: Acc Spectrometers, Detectors Associated Equipment (2004) 522:495–503. doi:10.1016/j.nima.2003.11.398
36. Agodi C, Bellini F, Cirrone G, Collamati F, Cuttone G, De Lucia E, et al. Precise measurement of prompt photon emission from 80 mev/u carbon ion beam irradiation. J Instrumentation (2012) 7:P03001. doi:10.1088/1748-0221/7/03/p03001
37. Agostinelli S, Allison J, Amako Ka., Apostolakis J, Araujo H, Arce P, et al. Geant4—A simulation toolkit. Nucl Instr Methods Phys Res section A: Acc Spectrometers, Detectors Associated Equipment (2003) 506:250–303. doi:10.1016/S0168-9002(03)01368-8
38. Jarlskog CZ, Paganetti H. Physics settings for using the geant4 toolkit in proton therapy. IEEE Trans Nucl Sci (2008) 55:1018–25. doi:10.1109/tns.2008.922816
39. Wrońska A, Kasper J, Ahmed AA, Andres A, Bednarczyk P, Gazdowicz G, et al. Prompt-gamma emission in geant4 revisited and confronted with experiment. Physica Med (2021) 88:250–61. doi:10.1016/j.ejmp.2021.07.018
40.NIST. Nist compounds: Geant4 material database — Book for application developers 10.6 documentation (2022) Accessed: 2022-07-14.
41. Verburg JM, Seco J. Proton range verification through prompt gamma-ray spectroscopy. Phys Med Biol (2014) 59:7089–106. doi:10.1088/0031-9155/59/23/7089
42.World Nuclear Association. Radioisotopes in medicine (2022). Available at: https://world-nuclear.org/information-library/non-power-nuclear-applications/radioisotopes-research/radioisotopes-in-medicine.aspx (Accessed 09 06, 2022).
43.International Commission on Radiation Units and Measurements. Tissue substitutes in radiation dosimetry and measurement. ICRU Report 44 (1989).
44. Shao J, Xie H, Huang H, Li Z, Sun Z, Xu Y, et al. Biodegradable black phosphorus-based nanospheres for in vivo photothermal cancer therapy. Nat Commun (2016) 7:12967. doi:10.1038/ncomms12967
45. Shcharbin D, Shcharbina N, Shakhbazau A, Mignani S, Majoral JP, Bryszewska M. Phosphorus-containing nanoparticles: Biomedical patents review. Expert Opin Ther Patents (2015) 25:539–48. doi:10.1517/13543776.2015.1010512
46. Lapi SE, Lewis JS, Dehdashti F. Evaluation of hypoxia with copper-labeled diacetyl-bis (n-methylthiosemicarbazone). Semin Nucl Med (2015) 45:177–185. (Elsevier). doi:10.1053/j.semnuclmed.2014.10.003
47. Chan S, Gerson B, Subramaniam S. The role of copper, molybdenum, selenium, and zinc in nutrition and health. Clin Lab Med (1998) 18:673–85. doi:10.1016/s0272-2712(18)30143-4
48. Kraeber-Bodéré F, Rousseau C, Bodet-Milin C, Mathieu C, Guérard F, Frampas E, et al. Tumor immunotargeting using innovative radionuclides. Int J Mol Sci (2015) 16:3932–54. doi:10.3390/ijms16023932
49. Belhout A, Kiener J, Coc A, Duprat J, Engrand C, Fitoussi C, et al. γ-ray production by proton and α-particle induced reactions on c 12, o 16, mg 24, and fe. Phys Rev C (2007) 76:034607. doi:10.1103/physrevc.76.034607
50. Foley K, Salmon G, Clegg A. Gamma radiation from the bombardment of 16o and 19f nuclei with 150 mev protons. Nucl Phys (1962) 31:43–52. doi:10.1016/0029-5582(62)90727-7
51. Lang F, Werntz C, Crannell C, Trombka J, Chang C. Cross sections for production of the 15.10-MeV and other astrophysically significant gamma-ray lines through excitation and spallation ofC12andO16with protons. Phys Rev C (1987) 35:1214–27. doi:10.1103/physrevc.35.1214
52. Dal Bello R, Martins PM, Brons S, Hermann G, Kihm T, Seimetz M, et al. Prompt gamma spectroscopy for absolute range verification of 12c ions at synchrotron-based facilities. Phys Med Biol (2020) 65:095010. doi:10.1088/1361-6560/ab7973
53. Polf J, Peterson S, Ciangaru G, Gillin M, Beddar S. Prompt gamma-ray emission from biological tissues during proton irradiation: A preliminary study. Phys Med Biol (2009) 54:731–43. doi:10.1088/0031-9155/54/3/017
54. Polf JC, Peterson S, Robertson D, Beddar S. Measuring prompt gamma ray emission during proton radiotherapy for assessment of treatment delivery and patient response. AIP Conf Proc (American Inst Physics) (2011) 1336:364–368. doi:10.1063/1.3586121
55. Magalhaes Martins P, Dal Bello R, Ackermann B, Brons S, Hermann G, Kihm T, et al. Pibs: Proton and ion beam spectroscopy for in vivo measurements of oxygen, carbon, and calcium concentrations in the human body. Scientific Rep (2020) 10:7007–14. doi:10.1038/s41598-020-63215-0
56. Hu X, Chao M, Wu H. Central role of lactate and proton in cancer cell resistance to glucose deprivation and its clinical translation. Signal Transduction Targeted Therapy (2017) 2:16047–8. doi:10.1038/sigtrans.2016.47
57. Smeets J, Roellinghoff F, Prieels D, Stichelbaut F, Benilov A, Fiorini C, et al. Prompt gamma imaging with a slit camera for real-time range control in proton therapy. Phys Med Biol (2012) 57:3371–405. doi:10.1088/0031-9155/57/11/3371
58. Isnaini I, Obi T, Yoshida E, Yamaya T. Monte Carlo simulation of sensitivity and necr of an entire-body pet scanner. Radiological Phys Technol (2014) 7:203–10. doi:10.1007/s12194-013-0253-y
59. Draeger E, Mackin D, Peterson S, Chen H, Avery S, Beddar S, et al. 3d prompt gamma imaging for proton beam range verification. Phys Med Biol (2018) 63:035019. doi:10.1088/1361-6560/aaa203
60. Verburg JM, Shih HA, Seco J. Simulation of prompt gamma-ray emission during proton radiotherapy. Phys Med Biol (2012) 57:5459–72. doi:10.1088/0031-9155/57/17/5459
61. Testa M, Min CH, Verburg JM, Schümann J, Lu H-M, Paganetti H. Range verification of passively scattered proton beams based on prompt gamma time patterns. Phys Med Biol (2014) 59:4181–95. doi:10.1088/0031-9155/59/15/4181
62. Kinsey R, Dunford C, Tuli J, Burrows T. The NUDAT/PCNUDAT program for nuclear data. Tech. rep., Brookhaven National Lab.(BNL), Upton, NY (United States) (1996). Available at: https://www.nndc.bnl.gov/nudat3/.
Keywords: proton therapy, proton range verification, prompt gamma, TOPAS Monte Carlo, 31-Phosporous, 63-Copper, 89-Yttrium
Citation: Cartechini G, Fogazzi E, Hart S-D, Pellegri L, Vanstalle M, Marafini M and La Tessa C (2023) Loading the tumor with 31P, 63Cu and 89Y provides an in vivo prompt gamma-based range verification for therapeutic protons. Front. Phys. 11:1071981. doi: 10.3389/fphy.2023.1071981
Received: 17 October 2022; Accepted: 27 January 2023;
Published: 15 February 2023.
Edited by:
Thomas Beyer, Medical University of Vienna, AustriaReviewed by:
Emily Draeger, Yale University, United StatesCopyright © 2023 Cartechini, Fogazzi, Hart, Pellegri, Vanstalle, Marafini and La Tessa. This is an open-access article distributed under the terms of the Creative Commons Attribution License (CC BY). The use, distribution or reproduction in other forums is permitted, provided the original author(s) and the copyright owner(s) are credited and that the original publication in this journal is cited, in accordance with accepted academic practice. No use, distribution or reproduction is permitted which does not comply with these terms.
*Correspondence: Chiara La Tessa, Y3hsMTY2NkBtZWQubWlhbWkuZWR1
Disclaimer: All claims expressed in this article are solely those of the authors and do not necessarily represent those of their affiliated organizations, or those of the publisher, the editors and the reviewers. Any product that may be evaluated in this article or claim that may be made by its manufacturer is not guaranteed or endorsed by the publisher.
Research integrity at Frontiers
Learn more about the work of our research integrity team to safeguard the quality of each article we publish.