 Jingbao Zhu
 Shuilong Li3
 Shanyou Li
 Jindong Song
- 1Key Laboratory of Earthquake Engineering and Engineering Vibration, Institute of Engineering Mechanics, China Earthquake Administration, Harbin, China
- 2Key Laboratory of Earthquake Disaster Mitigation, Ministry of Emergency Management, Harbin, China
- 3Fujian Earthquake Agency, Fuzhou, China
Introduction: China is one of the most seismically active countries in the world. It is an important task for a Chinese earthquake early warning system to quickly obtain robust magnitude estimation. However, within the first few seconds after P-wave arrival, there is considerable scatter in magnitude estimation for traditional methods based on a single early warning parameter.
Methods: To explore the feasibility of using a convolutional neural network for magnitude estimation in China, establish a magnitude estimation model suitable for China and provide more robust magnitude estimation based on strong-motion data from China, we propose a new approach combining a convolutional neural network and transfer learning (TL) to construct a magnitude estimation model (TLDCNN-M) in this study.
Results and Discussion: Our results show that for the same test dataset, in terms of the mean absolute error and standard deviation of magnitude estimation errors, the TLDCNN-M model has better performance than traditional methods and convolutional neural network models without using TL. Meanwhile, we apply the method to the 2022 Lushan M6.1 earthquake occurred in Sichuan province, China. At 3 s after the earliest P phase, the magnitude estimation error is less than 0.5. With the increase in time after the earliest P phase, the magnitude estimation is close to the catalog magnitude; at 10 s after the earliest P phase, the magnitude estimation error is less than 0.2.
1 Introduction
Earthquake early warning (EEW) systems can provide warning information to the public before destructive seismic waves reach specific areas [1]. To date, many earthquake-prone countries and regions in the world have used or tested EEW systems and have proven that EEW is an effective method for seismic risk reduction [2–4]. Meanwhile, China is one of the earthquake prone countries in the world. After the great Wenchuan earthquake in 2008, the Chinese government and seismologists began to attach importance to EEW systems, and in 2018, China began to establish a nationwide EEW system [5,6].
Robust magnitude estimation is necessary for EEW systems, which affects the reliability of early warning information and the determination of seismic potential damage zones [7]. Traditional magnitude estimation EEW methods use a single warning parameter to establish an empirical regression equation related to magnitude [8–10]. [11] found that there is a correlation between the peak amplitude of displacement (Pd) at 3 s after P-wave arrival and the magnitude, and the Pd can be used to establish a magnitude estimation function. [12] proposed using the squared velocity integral (IV2) from the scaling of the early radiated energy to establish a magnitude prediction function. With the rapid development of artificial intelligence, many researchers have applied machine learning methods to related seismology fields [13–16]. Meanwhile, some researchers have used neural networks to establish magnitude estimation models [17–19]. [20] used a deep convolutional neural network (CNN) to establish a magnitude estimation model (DCNN-M model) based on the strong-motion data recorded by the Japan Kyoshin Network (K-NET) stations.
The traditional magnitude estimation method in EEW mainly uses a single early warning parameter to establish an empirical magnitude estimation equation. However, a single parameter contains less information related to magnitude, which leads to a certain degree of magnitude estimation error, magnitude overestimation and magnitude underestimation [8,11,21,22]. Therefore, it is necessary to improve the accuracy of magnitude estimation. Meanwhile, some researches shows that machine learning is helpful to improve the accuracy of magnitude estimation [17,20]. Besides, transfer learning applies a model established based on the data of Region 1 to the data of Region 2 and can prevent the problem of insufficient generalization of a model established using Region 2 [23,24]. At present, transfer learning has been used in seismology-related fields, such as seismic phase picking [25] and prediction of earthquake ground shaking [26]. [27] established a support vector machine magnitude estimation model (TLSVM-M) using transfer learning for the Sichuan-Yunnan region, China.
To explore the feasibility of using a CNN for magnitude estimation in China, establish a magnitude estimation model suitable for China and provide more robust magnitude estimation based on strong-motion data from China, in this study, we propose a new method combining the DCNN-M model proposed by [20] and transfer learning to construct a TLDCNN-M model. We show that the TLDCNN-M model has better performance than traditional methods that use a single warning parameter and the DCNN-M model without using transfer learning. Meanwhile, we apply the TLDCNN-M model to the 2022 Lushan M6.1 earthquake occurred in Sichuan province, China, and there is a robust magnitude estimation within 10 s after the earliest P phase.
2 Data
Our dataset consists of 6,350 valid strong-motion records from 990 earthquake events that occurred in China between 2007 and 2020, and the range of magnitude is from Ms4 to Ms7. Meanwhile, the earthquake catalog of historical strong earthquake events used in this paper is shown in the Supplementary Table S1. In this paper, the magnitude is denoted by M. Figure 1A shows the distribution of epicenters (red stars) and stations (blue triangles). Meanwhile, Figures 1B–D show histograms of the number of magnitude, depth and epicentral distance records, respectively. We use the method proposed by [28] to automatically pick the P-wave arrival time on the unfiltered vertical acceleration record. And the seismic waveform with the P-wave arrival time is taken as the valid seismic waveform used in this paper. We integrate the acceleration record to obtain the velocity record and then integrate the velocity record to obtain the displacement record. Meanwhile, to remove low-frequency drift after integration, the record after integration is filtered on a 0.075 Hz high-pass Butterworth filter with four poles [29]. In addition, we randomly divide the dataset into two subdatasets: a training dataset (80%) and a test dataset (20%). And the training dataset is used as the learning data in this study. Figure 2 shows the relationship between the epicentral distance and the magnitude for the training and test datasets.
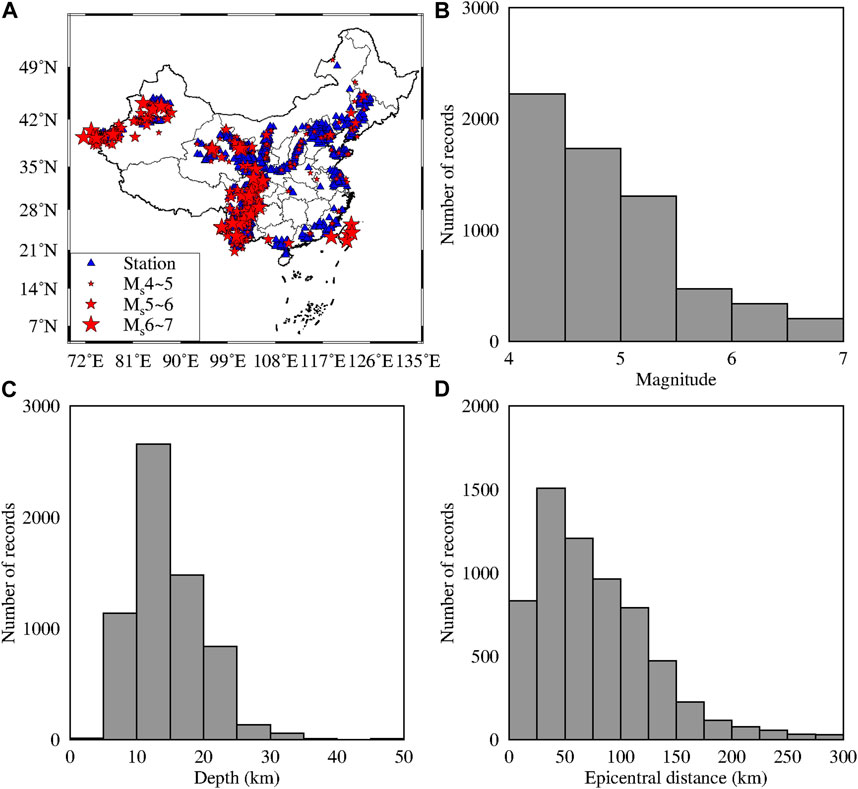
FIGURE 1. (A) The distribution of epicenters and stations in the dataset of this paper. (B) The relationship between the magnitude and the number of records. (C) The relationship between the depth and the number of records. (D) The relationship between the epicentral distance and the number of records.
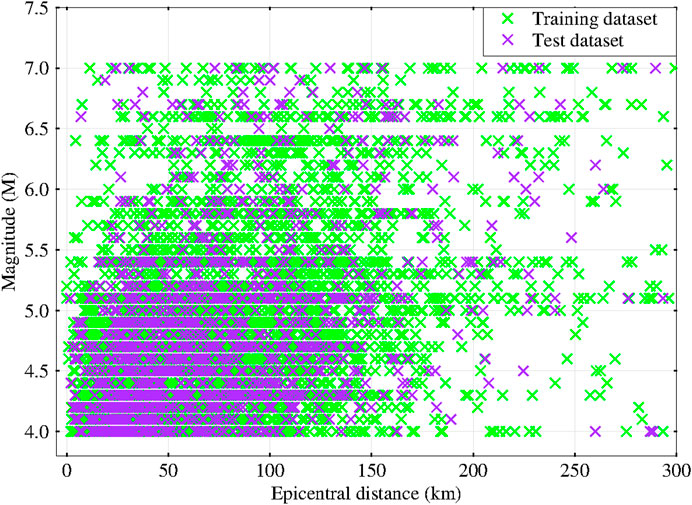
FIGURE 2. The relationship between the magnitude and epicentral distance. The green crosses represent the training dataset, and the purple crosses represent the test dataset.
3 Method
To explore the feasibility of using a CNN for magnitude estimation in China, establish a magnitude estimation model suitable for China and provide more robust magnitude estimation, in this study, we propose a new method by combining the DCNN-M model [20] and transfer learning and Chinese strong-motion data to construct a TLDCNN-M model. The network architectures of the DCNN-M model and TLDCNN-M model are shown in Figures 3A, B, respectively.
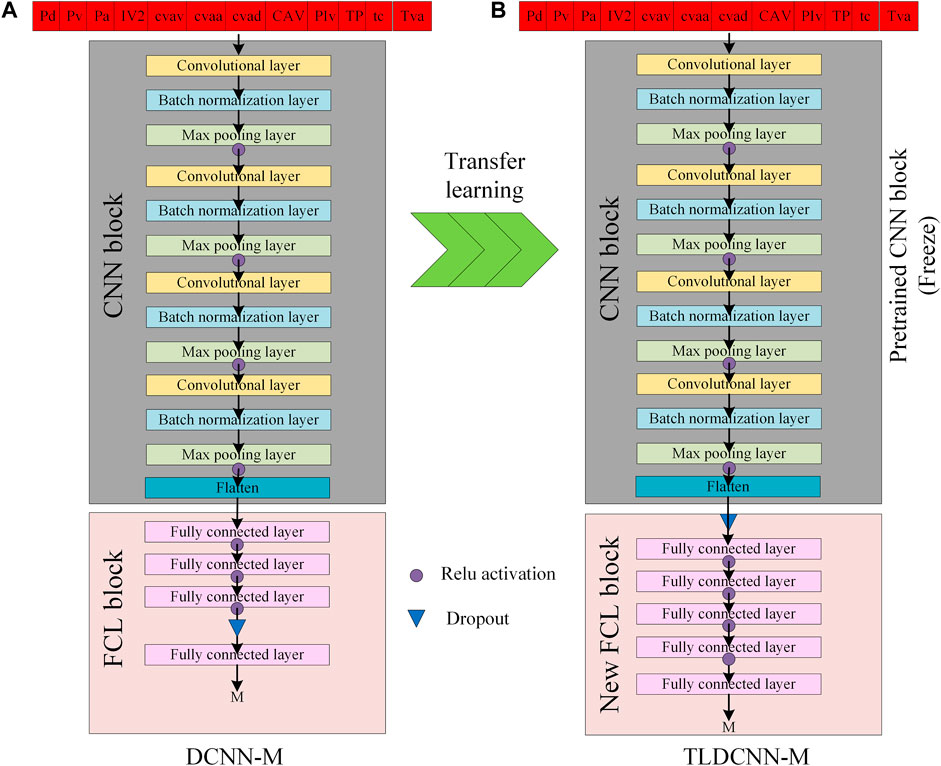
FIGURE 3. The framework of (A) the DCNN-M model [20] and (B) the TLDCNN-M model. The DCNN-M model is composed of a CNN block and an FCL block. The TLDCNN-M model is composed of a pretrained CNN block and a new FCL block.
On the dataset and learning task of Region 1 (the source domain and the source learning task), the pretrained model can be established. Transfer learning can help accelerate and optimize the learning efficiency of a pretrained model on the dataset and learning task of Region 2 (new target domain and new target task). Besides, based on the knowledge in the dataset and learning task of Region 1, transfer learning can improve the learning ability for the dataset and learning task of Region 2 [23,24].
[20] established a deep convolutional neural network (DCNN-M) for magnitude estimation (the source learning task), which was trained with strong-motion data from the Japan Kyoshin Network (the source domain). The DCNN-M model is composed of a CNN block and a fully connected layer (FCL) block. A vector composed of 12 early warning parameters collected from a single station is used as the input to the model, and the size of the input is (12, 1). The output is the magnitude estimation from a single station. These 12 early warning parameters include the parameters related to the amplitude (peak displacement (Pd), peak velocity (Pv) and peak acceleration (Pa)), the parameters related to the energy (squared velocity integral (IV2), cumulative vertical absolute velocity (cvav), cumulative vertical absolute acceleration (cvaa), cumulative vertical absolute displacement (cvad), cumulative absolute velocity (CAV) and P-wave index value (PIv)), the parameters related to the period (product parameter (TP), average period (τc) and peak ratio (Tva)). Meanwhile, the parameters related to the amplitude and energy are corrected for the source distance and normalized to a reference distance of 10 km [20,30]:
where AE is the parameter related to the amplitude or energy, R is source distance, c is correction coefficient, AE10 km is the parameter normalized to a reference distance of 10 km. Additionally, in order to deal with the input data imbalance and the numerical problems caused by the input parameters with different orders of magnitude, for each parameter, we normalized the parameter to the range from −1 to 1:
where X is the parameter before the normalization, Xnorm is the parameter after the normalization, Xmax and Xmin are the maximum value and minimum value for each parameter in the dataset, respectively. Then, the normalized parameters as inputs to the model. A detailed introduction to these parameters is provided in the research of [20] and Supplementary Text S1 in this paper.
To establish the TLDCNN-M model for magnitude estimation of earthquake events in China (new target task), during the transfer learning process, we fine-tuned the DCNN-M model. We use the same CNN block as the DCNN-M model (Figure 3), which is pretrained. And in the CNN block, there are 124, 150, 190 and 250 filters for four convolutional layers respectively. Additionally, for each convolutional layer, the kernel size of filter and the size of stride are 4 and 2, respectively. And for each max pooling layer, the size of max pooling and the size of stride both are 2. Meanwhile, the weights and training parameters of the pretrained CNN block in the TLDCNN-M model are taken directly from parts of the DCNN-M model, which are frozen in the TLDCNN-M model. For the FCL block of DCNN-M model, there are four FCLs, which have 250, 125, 60 and 1 neurons. Meanwhile, detailed information about the CNN block, FCL block and training strategy of DCNN-M model have been introduced in the research of Zhu et al. [20]. In this work, we finetune the FCL block of the DCNN-M model, and use a new FCL block in the TLDCNN-M model, which is composed of five FCLs, and the weights are retrained. Meanwhile, these five FCLs have 128, 64, 31, 27 and 1 neurons, respectively. And the last FCL with one neuron uses the linear activation function for obtaining the predicted magnitude.
We use the training dataset from Chinese strong-motion records (new target domain) introduced in the Data section to train the TLDCNN-M model and use the test dataset from Chinese strong-motion records (new target domain) to test the TLDCNN-M model. During the training process, the command “validation split = 0.1” is used to randomly divide 10% of the training dataset as a validation dataset. We use the Adam optimizer [31] and the mean squared error (MSE) loss function. The MSE loss function is defined as follows:
where n is the number of samples, ytrue is the true value, and ypred is the predicted value. We use a batch size of 16, an initial learning rate of 0.001, and 100 epochs. Additionally, we use the ReduceLROnPlateau (with a factor of 0.1, a patience of 5 epochs and a minimum learning rate of 0.5 × 10⁻⁶) to monitor the validation loss and to optimize the learning rate. ReduceLROnPlateau is a scheduler in machine learning, which is used to lower and optimize the learning rate (https://keras.io/api/callbacks/reduce_lr_on_plateau/) [32]. In this training process of the work, based on the ReduceLROnPlateau scheduler, the initial learning rate is multiplied by 0.1 if the validation loss does not improve for more than five epochs. Meanwhile, we use the EarlyStopping (with a patience of 10 epochs) to prevent overfitting [33]. When the validation loss is no longer reduced for 10 epochs, the training stops. Figure 4 shows the variation in training loss and validation loss with epochs during training, and the validation loss is close to the training loss, which indicates that there is no obvious overfitting for the model.
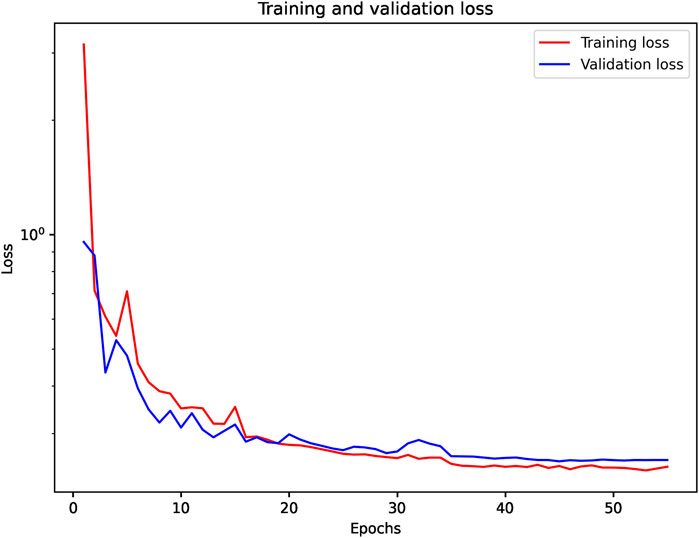
FIGURE 4. The relationship between the loss and epoch. The red line represents the training loss, and the blue line represents the validation loss.
4 Results
Our results show the comparison between the TLDCNN-M and baseline models. Meanwhile, we apply the TLDCNN-M model to the 2022 Lushan M6.1 earthquake occurred in Sichuan province, China.
4.1 Comparison with baseline models
To investigate the performance and the rationality of the TLDCNN-M model for magnitude estimation on the same dataset, we compare the TLDCNN-M model with baseline models, including traditional methods (such as the IV2 model and Pd model), the TLSVM-M model and the DCNN-M model. In this study, for a fair comparison, we use the same dataset as the TLDCNN-M model to establish the IV2 model (i.e., magnitude prediction function based on the IV2 parameter) and Pd model (i.e., magnitude prediction function based on the Pd parameter) for magnitude estimation. The magnitude prediction functions based on the IV2 and Pd parameters are as follows:
where IV210km and Pd10km are the IV2 and Pd by correcting the distance effect (normalizing them to a reference of 10 km), respectively. Additionally, [27] used a support vector machine and transfer learning to establish the TLSVM-M model based on the strong-motion data from the Sichuan-Yunnan region. In addition, [20] used the strong-motion data of the Japan Kyoshin Network to establish the DCNN-M model (Japan) based on a CNN. In this study, we also establish a new DCNN-M model (China) using the strong-motion data (introduced in the Data section) of earthquake events that occurred in China.
We use the mean absolute error (MAE) and standard deviation (Std) to evaluate the performance of each model for magnitude estimation. The magnitude estimation error (E), MAE and Std are defined as follows:
where n is the number of samples and uE is the mean error. A smaller MAE means a smaller magnitude estimation error by the model, and a smaller Std means a smaller scatter of the magnitude estimation error by the model. For the same test dataset, at 3 s after P-wave arrival, Table 1 shows the MAE and Std of magnitude estimation errors of the TLDCNN-M model and baseline models. From Table 1, the MAE and Std of the magnitude estimation errors for the TLDCNN-M model are 0.33 and 0.45, respectively, which are less than those of the IV2 model (0.46 and 0.60, respectively), Pd model (0.46 and 0.58, respectively), TLSVM-M model (0.35 and 0.47, respectively), DCNN-M (Japan) (0.38 and 0.52, respectively) and DCNN-M (China) (0.41 and 0.70, respectively). Meanwhile, the TLDCNN-M model has better performance than the DCNN-M models (Japan and China) without using transfer learning. Table 2 shows the error percentage of each model within the absolute error (AE) range of different magnitude estimates. Table 2 shows that the error percentage of the TLDCNN-M model within AE≤0.5 is 78.62%, which is more than those of the IV2 model (63.05%), Pd model (64.07%), TLSVM-M model (77.59%), DCNN-M (Japan) (74.13%) and DCNN-M (China) (72.72%). The error percentage of the TLDCNN-M model within AE>1 is 3.85%, which is less than that of the other models. This indicates that the TLDCNN-M model has better performance than the baseline models. In addition, Supplementary Figure S1 shows a histogram of the magnitude estimation errors.
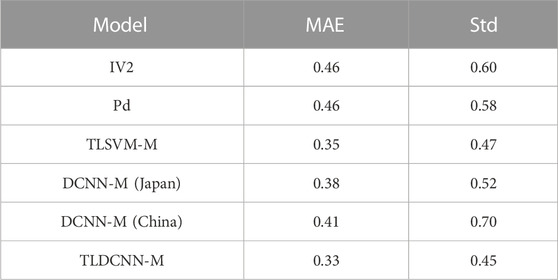
TABLE 1. The mean absolute error (MAE) and standard deviation (Std) of the magnitude estimation errors of the TLDCNN-M model and baseline models.
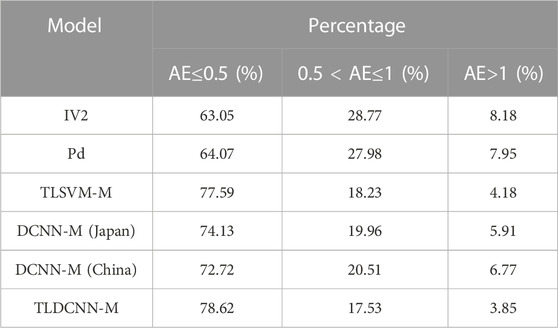
TABLE 2. The error percentage of the different absolute error (AE) ranges for the TLDCNN-M model and baseline models.
For the same test dataset, at 3 s after P-wave arrival, Figure 5A shows the relationship between the MAE and the range of different epicentral distances for the TLDCNN-M model and baseline models. Figure 5B shows the relationship between the Std and the range of different epicentral distances for the TLDCNN-M model and baseline models. Figures 5A, B show that the TLDCNN-M model has a smaller MAE and Std in different ranges of epicentral distances, which also indicates that the TLDCNN-M model has better performance in different ranges of epicentral distances than the IV2 model, Pd model, TLSVM-M model, DCNN-M model (Japan) and DCNN-M model (China). Figure 5C shows the relationship between the MAE and the range of different signal-to-noise ratios (SNRs) for the TLDCNN-M model and baseline models. Figure 5D shows the relationship between the Std and the different ranges of SNRs for the TLDCNN-M model and baseline models. Figures 5C, D show that the TLDCNN-M model has a smaller MAE and Std in different SNR ranges, which indicates that the TLDCNN-M model has better performance in different SNR ranges than the IV2 model, Pd model, TLSVM-M model, DCNN-M model (Japan) and DCNN-M model (China). Supplementary Figure S2 shows the relationship between the magnitude estimation error and epicentral distance and SNR. The magnitude estimation errors are mainly distributed in a range of ±1.
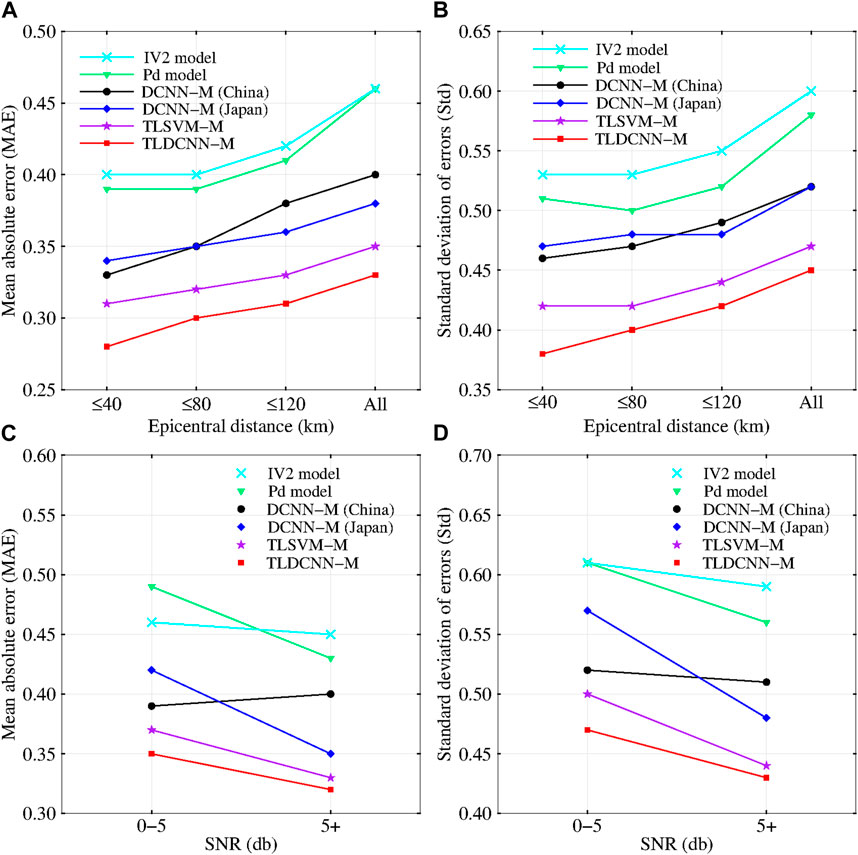
FIGURE 5. The relationship between the (A) mean absolute error (MAE) and (B) standard deviation of errors (Std) and the range of different epicentral distances for the TLDCNN-M model and baseline models. The relationship between the (C) MAE and (D) Std and the range of different SNRs for the TLDCNN-M model and baseline models.
4.2 Application to the 2022 Lushan M6.1 earthquake
At 17:00 Beijing Time on 1 June 2022, an earthquake of M6.1 occurred in Lushan County, Sichuan Province, China. The epicenter was located at 30.37° N, 102.94° E, and the focal depth was 17 km. This earthquake caused the death of 4 people, injured 14 people and was felt in many cities in Sichuan [34]. We obtained seismic data for this earthquake event recorded by 591 stations provided by the China Seismic Networks Center. Figure 6A shows the epicenter (red star) and distribution of the stations (green triangles) for this earthquake. The event was located using the real-time continuous earthquake location method from the EEW system in Fujian, China [22,35].
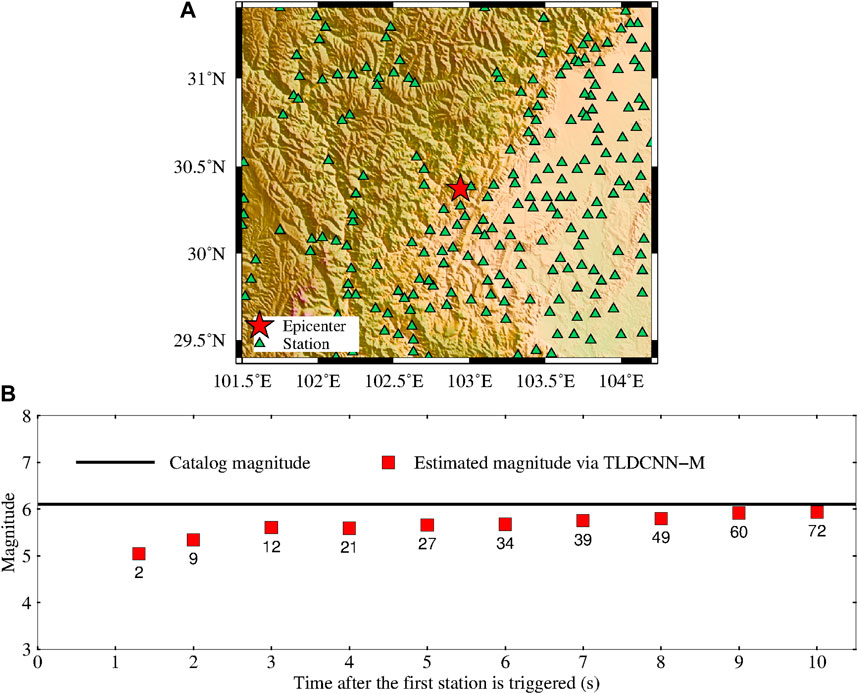
FIGURE 6. (A) The epicenter and distribution of stations for the 2022 Lushan M6.1 earthquake. (B) Evolution of the magnitude estimation with the time after the first triggered station. The black line represents the catalog magnitude, each red square represents the estimated magnitude via the TLDCNN-M model, and the number near the red square represents the number of triggered stations.
To explore the feasibility of the TLDCNN-M model in this earthquake, we apply the TLDCNN-M model to the event. Meanwhile, the event is not in the training dataset and test dataset. After the earthquake occurs, based on the triggered stations, we can obtain the real-time final magnitude estimation by calculating the average value of the magnitude estimation of the triggered stations [36–38]. The steps are as follows.
(1) When one or more stations are triggered at the same time first, we will average the estimated magnitudes obtained by the triggered stations;
(2) Then, when a new station is triggered again, the P-wave time window of the new triggered station needs to meet 3 s to participate in the average of the estimated magnitude. The purpose is to improve the stability of the average of multiple stations for calculating the final magnitude estimation.
The calculation formula for final magnitude estimation based on the multiple triggered stations is as follows:
where N is the number of triggered stations, which meet the conditions of step (1) and step (2); Mij is the estimated magnitude of the ith triggered station in the jth second, M is the final magnitude estimation based on the multiple triggered stations. Figure 6B shows the evolution of the magnitude estimation based on the TLDCNN-M model with the time after the first triggered station (i.e., the time after the earliest P phase). In Figure 6B, the number near the red square indicates the number of triggered stations at the corresponding time. As the time after the first station is triggered increases, the magnitude related seismic information obtained by triggered stations also increases gradually. We can find from Figure 6B that with the increase in time after the earliest P phase, the magnitude estimation based on the TLDCNN-M model gradually approaches the catalog magnitude. Within 10 s after the earliest P phase, there is a robust magnitude estimation. At 3 s and 10 s after the earliest P phase, the magnitude estimation error is less than 0.5 and 0.2, respectively.
5 Discussion and conclusion
To explore the feasibility of using a CNN for magnitude estimation in China, establish a magnitude estimation model suitable for China and provide more robust magnitude estimation, in this study, we propose a new method by combining a pretrained neural network [20] with transfer learning and Chinese strong-motion data to construct a TLDCNN-M model. We then apply the TLDCNN-M model to the 2022 Lushan M6.1 earthquake that occurred in Sichuan province, China.
5.1 Advantages of the method
We compare the method proposed in this study with baseline models. In terms of the MAE and Std of magnitude estimation errors, the proposed method has better performance than traditional models (such as the IV2 and Pd models), CNN models without using transfer learning (the DCNN-M (Japan) and DCNN-M (China) models), and the TLSVM-M model proposed by [27]. Meanwhile, for different ranges of epicentral distance and the SNR, the TLDCNN-M model has a smaller MAE and Std of magnitude estimation errors than those of other models. Additionally, the error percentage of the TLDCNN-M model within AE≤0.5 is also greater than that of the baseline models, and the error percentage of the TLDCNN-M model within AE>1 is less than that of the baseline models. For the 2022 Lushan M6.1 earthquake that occurred in China, at 3 s and 10 s after the earliest P phase, the magnitude estimation error based on the TLDCNN-M model is less than 0.5 and 0.2, respectively, which indicates that there is a robust magnitude estimation within 10 s after the earliest P phase.
5.2 Potential method improvements
In this work, based on the transfer learning, for the TLDCNN-M model, we finetuned the number of FCLs, the number of neurons and the position of the dropout layer of the FCL block (Figure 3). Supplementary Table S2 shows the performance of TLDCNN-M model when the dropout layer is in different positions. We find from Supplementary Table S2 that the position of the dropout layer will affect the performance of the model. Additionally, Supplementary Table S3 shows the performance of TLDCNN-M model when there are different number of FCLs. We find from Supplementary Table S3 that the number of the FCLs in the FCL block will affect the performance of the model. These also indicate that it is important to select appropriate hyperparameters (the position of the dropout layer, the number of neurons, the number of full connection layers, etc.) for the performance of the neural network model [39].
A pretrained model with good performance is very important for transfer learning, which also determines the performance of the new model established using transfer learning. With the rapid development of artificial intelligence technology in recent years, machine learning methods are also emerging [17,18,40,41]. It is possible to establish a better EEW magnitude estimation model suitable for China by combining a better pretrained model with transfer learning.
Additionally, considering the requirements of machine learning methods for data balance and the scarcity of large earthquake events (M > 7) in China, this paper only selects earthquake events of M4 to M7 as the dataset and research object. However, although the number of large earthquakes in China is very small, large earthquakes can cause very serious damage. Therefore, further research is needed to address the problem of magnitude estimation for large earthquakes in EEW using machine learning methods in the future [42].
Data availability statement
The datasets presented in this study can be found in online repositories. The names of the repository/repositories and accession number(s) can be found in the article/Supplementary Material.
Author contributions
JZ analyzed the data and wrote the manuscript. JS and YW contributed to the design of the methodology and revised the article. SL provided important suggestions on the manuscript. All authors contributed to the manuscript.
Funding
This research was financially supported by the National Natural Science Foundation of China (U2039209, U1839208, and 51408564), the Natural Science Foundation of Heilongjiang Province (LH2021E119), the National Key Research and Development Program of China (2018YFC1504003).
Acknowledgments
We thank the China Seismic Networks Center for providing us with the earthquake event data. We gratefully acknowledge the availability of the GMT software [43], which was used to plot the figures.
Conflict of interest
The authors declare that the research was conducted in the absence of any commercial or financial relationships that could be construed as a potential conflict of interest.
Publisher’s note
All claims expressed in this article are solely those of the authors and do not necessarily represent those of their affiliated organizations, or those of the publisher, the editors and the reviewers. Any product that may be evaluated in this article, or claim that may be made by its manufacturer, is not guaranteed or endorsed by the publisher.
Supplementary material
The Supplementary Material for this article can be found online at: https://www.frontiersin.org/articles/10.3389/fphy.2023.1070010/full#supplementary-material
References
1. Allen RM, Melgar D. Earthquake early warning: Advances, scientific challenges, and societal needs. Annu Rev Earth Planet Sci (2019) 47:361–88. doi:10.1146/annurev-earth-053018-060457
2. Allen RM, Brown H, Hellweg M, Khainovski O, Lombard P, Neuhauser D. Real-time earthquake detection and hazard assessment by ElarmS across California. Geophys Res Lett (2009) 36:L00B08. doi:10.1029/2008GL036766
3. Zollo A, Iannaccone G, Lancieri M, Cantore L, Convertito V, Emolo A, et al. Earthquake early warning system in southern Italy: Methodologies and performance evaluation. Geophys Res Lett (2009) 36:L00B07. doi:10.1029/2008GL036689
4. Wu YM, Mittal H, Chen DY, Hsu TY, Lin PY. Earthquake early warning systems in taiwan: Current status. J Geol Soc India (2021) 97:1525–32. doi:10.1007/s12594-021-1909-6
5. Peng C, Ma Q, Jiang P, Huang W, Yang D, Peng H, et al. Performance of a hybrid demonstration earthquake early warning system in the Sichuan–Yunnan border region. Seismol Res Lett (2020) 91:835–46. doi:10.1785/0220190101
6. Peng C, Jiang P, Ma Q, Wu P, Su J, Zheng Y, et al. Performance evaluation of an earthquake early warning system in the 2019–2020 M6.0 Changning, Sichuan, China, seismic sequence. Front Earth Sci (2021) 9:699941. doi:10.3389/feart.2021.699941
7. Zollo A, Amoroso O, Lancieri M, Wu YM, Kanamori H. A threshold-based earthquake early warning using dense accelerometer networks. Geophys J Int (2010) 183:963–74. doi:10.1111/j.1365-246X.2010.04765.x
8. Kanamori H. Real-time seismology and earthquake damage mitigation. Annu Rev Earth Planet Sci (2005) 33:195–214. doi:10.1146/annurev.earth.33.092203.122626
9. Yamada M, Mori J. Usingτcto estimate magnitude for earthquake early warning and effects of near-field terms. J Geophys Res Solid Earth (2009) 114:B05301. doi:10.1029/2008JB006080
10. Huang PL, Lin TL, Wu YM. Application of τc *P d in earthquake early warning. Geophys Res Lett (2015) 42:1403–10. doi:10.1002/2014GL063020
11. Wu YM, Zhao L. Magnitude estimation using the first three seconds P-wave amplitude in earthquake early warning. Geophys Res Lett (2006) 33:L16312. doi:10.1029/2006GL026871
12. Festa G, Zollo A, Lancieri M. Earthquake magnitude estimation from early radiated energy. Geophys Res Lett (2008) 35:L22307. doi:10.1029/2008GL035576
13. Chen M, Wang H. Explainable machine learning model for predication of ground motion parameters with uncertainty quantification. Chin J Geophys (2022) 65:3386–404. doi:10.6038/cjg2022P0428
14. Li Z, Meier MA, Hauksson E, Zhan Z, Andrews J. Machine learning seismic wave discrimination: Application to earthquake early warning. Geophys Res Lett (2018) 45:4773–9. doi:10.1029/2018GL077870
15. Perol T, Gharbi M, Denolle M. Convolutional neural network for earthquake detection and location. Sci Adv (2018) 4:e1700578. doi:10.1126/sciadv.1700578
16. Zhu W, Beroza GC. PhaseNet: A deep-neural-network-based seismic arrival-time picking method. Geophys J Int (2019) 216:261–73. doi:10.1093/gji/ggy423
17. Mousavi SM, Beroza GC. A machine-learning approach for earthquake magnitude estimation. Geophys Res Lett (2020) 47:e2019GL085976. doi:10.1029/2019GL085976
18. Van den Ende MPA, Ampuero JP. Automated seismic source characterization using deep graph neural networks. Geophys Res Lett (2020) 47:e2020GL088690. doi:10.1029/2020GL088690
19. Kuang W, Yuan C, Zhang J. Network-based earthquake magnitude determination via deep learning. Seismol Res Lett (2021) 92:2245–54. doi:10.1785/0220200317
20. Zhu J, Li S, Song J, Wang Y. Magnitude estimation for earthquake early warning using a deep convolutional neural network. Front Earth Sci (2021) 9:341. doi:10.3389/feart.2021.653226
21. Peng H, Wu Z, Wu YM, Yu S, Zhang D, Huang W. Developing a prototype earthquake early warning system in the Beijing capital region. Seismol Res Lett (2011) 82:394–403. doi:10.1785/gssrl.82.3.394
22. Zhang H, Jin X, Wei Y, Li J, Kang L, Wang S, et al. An earthquake early warning system in Fujian, China. Bull Seismol Soc Am (2016) 106:755–65. doi:10.1785/0120150143
23. Pan S, Yang Q. A survey on transfer learning. IEEE Trans Knowl Data Eng (2009) 22:1345–59. doi:10.1109/TKDE.2009.191
24. Zhuang F, Qi Z, Duan K, Xi D, Zhu Y, Zhu H, et al. A comprehensive survey on transfer learning. Proc IEEE (2021) 109:43–76. doi:10.1109/JPROC.2020.3004555
25. Chai C, Maceira M, Santos-Villalobos HJ, Venkatakrishnan SV, Schoenball M, Zhu W, et al. Using a deep neural network and transfer learning to bridge scales for seismic phase picking. Geophys Res Lett (2020) 47:e2020GL088651. doi:10.1029/2020GL088651
26. Jozinović D, Lomax A, Štajduhar I, Michelini A. Transfer learning: Improving neural network based prediction of earthquake ground shaking for an area with insufficient training data. Geophys J Int (2022) 229:704–18. doi:10.1093/gji/ggab488
27. Zhu J, Li S, Ma Q, He B, Song J. Support vector machine-based rapid magnitude estimation using transfer learning for the Sichuan–Yunnan region, China. Bull Seismol Soc Am (2022) 112:894–904. doi:10.1785/0120210232
28. Ma Q, Jin X, Li SY, Chen FW, Liao SR, Wei YX. Automatic P-arrival detection for earthquake early warning. Chin J Geophys (2013) 56:2313–21. doi:10.6038/cjg20130718
29. Peng CY, Yang JS, Zheng Y, Zhu XY, Xu ZQ, Chen Y. Newτcregression relationship derived from allPwave time windows for rapid magnitude estimation. Geophys Res Lett (2017) 44:1724–31. doi:10.1002/2016GL071672
30. Zollo A, Lancieri M, Nielsen S. Earthquake magnitude estimation from peak amplitudes of very early seismic signals on strong motion records. Geophys Res Lett (2006) 33:L23312. doi:10.1029/2006GL027795
31. Kingma DP, Ba J. Adam: A method for stochastic optimization (2014). arXiv preprint arXiv:1412.6980.
33. Prechelt L. Early stopping-but when? In: Montavon G, Orr G, and Müller K, editors. Neural networks: Tricks of the trade. Berlin, Heidelberg: Springer (2012). p. 53–67.
34. Peng C, Jiang P, Ma Q, Su J, Cai Y, Zheng Y. Chinese nationwide earthquake early warning system and its performance in the 2022 Lushan M6.1 earthquake. Remote Sens (2022) 14:4269. doi:10.3390/rs14174269
35. Jin X, Zhang HC, Li J, Wei YX, Ma Q. Research on continuous location method used in earthquake early warning system. Chin J Geophys (2012) 55:150–65. doi:10.1002/cjg2.1710
36. Park Y, Park SC, Kim KH, Park M, Lee J. Magnitude scaling relationships from the first 3 s of P-wave arrivals in South Korea. J Seismol (2010) 14:761–8. doi:10.1007/s10950-010-9198-3
37. Chen DY, Wu YM, Chin TL. An empirical evolutionary magnitude estimation for early warning of earthquakes. J Asian Earth Sci (2017) 135:190–7. doi:10.1016/j.jseaes.2016.12.028
38. Sheen DH, Park JH, Chi HC, Hwang EH, Lim IS, Seong YJ, et al. The first stage of an earthquake early warning system in South Korea. Seismol Res Lett (2017) 88:1491–8. doi:10.1785/0220170062
39. Saad OM, Hafez AG, Soliman MS. Deep learning approach for earthquake parameters classification in earthquake early warning system. IEEE Geosci Remote Sensing Lett (2020) 18:1293–7. doi:10.1109/LGRS.2020.2998580
40. Münchmeyer J, Bindi D, Leser U, Tilmann F. The transformer earthquake alerting model: A new versatile approach to earthquake early warning. Geophys J Int (2021) 225:646–56. doi:10.1093/gji/ggaa609
41. Zhang X, Zhang M, Tian X. Real-time earthquake early warning with deep learning: Application to the 2016 M 6.0 central apennines, Italy earthquake. Geophys Res Lett (2021) 48:2020GL089394. doi:10.1029/2020GL089394
42. Li Z. A generic model of global earthquake rupture characteristics revealed by machine learning. Geophys Res Lett (2022) 49:e2021GL096464. doi:10.1029/2021GL096464
Keywords: earthquake early warning, neural network, transfer learning, magnitude estimation, China, P-wave
Citation: Zhu J, Li S, Li S, Wei Y and Song J (2023) Rapid earthquake magnitude estimation combining a neural network and transfer learning in China: Application to the 2022 Lushan M6.1 earthquake. Front. Phys. 11:1070010. doi: 10.3389/fphy.2023.1070010
Received: 14 October 2022; Accepted: 17 March 2023;
Published: 24 March 2023.
Edited by:
Shaohuan Zu, Chengdu University of Technology, ChinaReviewed by:
Min Xiong, Tongji University, ChinaChao Guo, North China Electric Power University, China
Tianze Zhang, University of Calgary, Canada
Copyright © 2023 Zhu, Li, Li, Wei and Song. This is an open-access article distributed under the terms of the Creative Commons Attribution License (CC BY). The use, distribution or reproduction in other forums is permitted, provided the original author(s) and the copyright owner(s) are credited and that the original publication in this journal is cited, in accordance with accepted academic practice. No use, distribution or reproduction is permitted which does not comply with these terms.
*Correspondence: Yongxiang Wei, d3lvbmd4QGZqZHpqLmdvdi5jbg==; Jindong Song, amRzb25nQGllbS5hYy5jbg==