
94% of researchers rate our articles as excellent or good
Learn more about the work of our research integrity team to safeguard the quality of each article we publish.
Find out more
ORIGINAL RESEARCH article
Front. Phys., 24 March 2023
Sec. Social Physics
Volume 11 - 2023 | https://doi.org/10.3389/fphy.2023.1064122
This article is part of the Research TopicIntegrating Physical and Social Sciences towards the Sustainable Development GoalsView all 7 articles
 Leonardo B. L. Santos1,2*
 Giovanni G. Soares3Tanishq Garg4Aurelienne A. S. Jorge3
 Luciana R. Londe1Regina T. Reani1Roberta B. Bacelar5Carlos E. S. Oliveira6
 Vander L. S. Freitas6Igor M. Sokolov2
The measurement and mapping of transportation network vulnerability to natural hazards constitute subjects of global interest for a sustainable development agenda and as means of adaptation to climate change. During a flood, some elements of a transportation network can be affected, causing the loss of lives. Furthermore, impacts include damage to vehicles, streets/roads, and other logistics services - sometimes with severe economic consequences. The Network Science approach may offer a valuable perspective considering one type of vulnerability related to network-type critical infrastructures: the topological vulnerability. The topological vulnerability index associated with an element is defined as reducing the network’s average efficiency due to removing the set of edges related to that element. In this paper, we present the results of a systematic literature overview and a case study applying the topological vulnerability index for the highways in Santa Catarina (Brazil). We produce a map considering that index and areas susceptible to urban floods and landslides. Risk knowledge, combining hazard and vulnerability, is the first pillar of an Early Warning System and represents an important tool for stakeholders of the transportation sector in a disaster risk reduction agenda.
In a global change scenario, some climatic and extreme weather events are expected to increase in frequency and intensity and cause more social and economic impacts in several sectors, such as transportation systems and urban mobility. As presented in several papers in literature, the cost of repairing transport assets after either an urban flood or landslide represents a significant percentage of the total damage cost of several recent disasters around the world [1]; [2]; [3]; [4] and in Brazil [5]; [6]; [7].
To mitigate those impacts, evaluating the risk associated with disasters and the best ways to deal with them is necessary. Disaster risk reduction is aimed at preventing new and reducing existing disaster risks and managing residual risk, all of which contribute to strengthening resilience and achieving sustainable development [8].
For disaster risk reduction, vulnerability is a key concept. There are several types and meanings for vulnerability. According to [9], vulnerability represents “the characteristics of a person or group and their situation that influence their capacity to anticipate, cope with, resist and recover from the impact of a natural hazard (an extreme natural event or process)”. The UN Office for disaster risk reduction also includes assets and systems as subjects to vulnerability: “The conditions determined by physical, social, economic and environmental factors or processes which increase the susceptibility of an individual, a community, assets or systems to the impacts of hazards” [8].
The transportation systems’ literature also has different meanings for vulnerability [10]. For example, [11] suggested that network vulnerability should be understood as “susceptibility to incidents that can result in considerable reductions in road network serviceability”, and [12] understood network vulnerability as the extent of a failure to impact the original purpose of the system.
Vulnerability is a key idea in Network Science as well. Due to its generality in representing the system topology (relation among the elements on the system), Network Science approaches have been applied to a huge number of very different areas [13]. Section 2.3 presents a Systematic Literature Mapping of papers related to road networks, disasters, and network vulnerability. The listed works are predominantly from 2020, published in interdisciplinary and transport journals. The most frequent type of disasters and data origin are flooding/landsliding and USA/China.
This paper presents a formulation for a vulnerability index based on the efficiencies of the system of networks. It aims to locate the most vulnerable links in a transportation network and assess whether these links are susceptible to hazards and disruptions. The idea is presented as a case study on a set of highways mapped based on vulnerability index and disaster susceptibility data.
Brazil is among the ten countries most affected by weather-related disasters in the last 20 years [8]. Santa Catarina state, located in the Brazilian Southern region (Figure 1), is particularly affected by disasters - there is an annual mean of 64 damage records triggered by hydrological processes, such as floods in Santa Catarina municipalities [14]. The maximum value was achieved in 2008 when the material losses summed almost 1 billion US dollars [14].
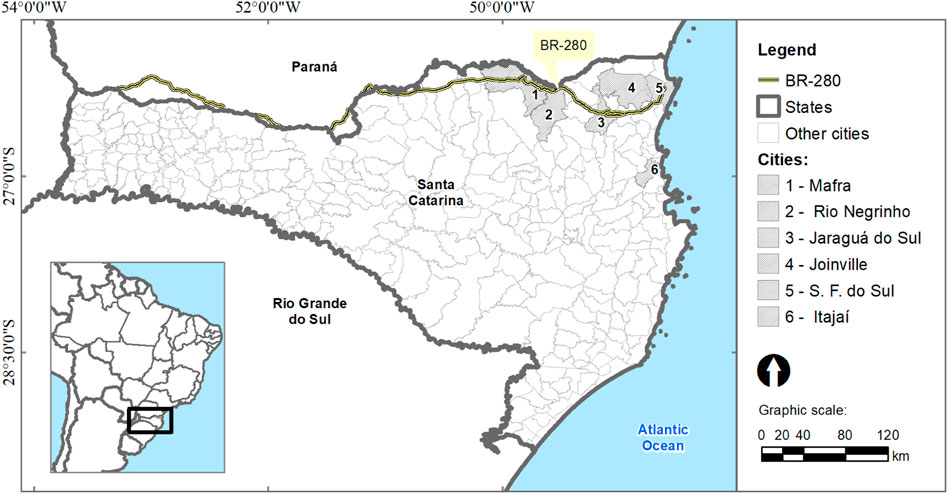
FIGURE 1. Study area, in the State of Santa Catarina, Brazil, with the highway BR 280/SC and some cities nearby: Mafra, Rio Negrinho, Jaraguá do Sol, Joinville, São Francisco do Sul (S. F. do Sul), Itajaí.
[14] pointed out that there were 1,344 records of disasters from 1980 to 2010 in Santa Catarina. High numbers of registers in summer and spring are associated with severe storms [14]. Between 1995 and 2014, the municipalities produced 2,704 official documents to report damages and/or losses due to disasters in the State. The documents are often related to rainfall, especially flash floods (907 records).
According to the last census track (2010), 295 municipalities and more than 6 million inhabitants are in the State of Santa Catarina. The State’s HDI - Human Development Index - is 0.774, the third in the Brazilian HDI ranking [15]. Despite the high socio-economic indicators for municipalities from Santa Catarina state, many communities are at risk in those places due to characteristics of land occupation [16,17]. The mountainous relief on the east side determined the human settlement in the fluvial plains, areas naturally prone to floods. Moreover, industrialization and economic growth attracted many people to the regions and induced environmental interventions, such as deforestation, landfill, and irregular constructions [16, 17].
The susceptible flood areas used in this study were mapped by the Brazilian Geological Survey (CPRM) based on a database of previous occurrences and in situ evaluation of physical characteristics [18].
Several topological measures can be extracted from a network and used to analyze the modeled phenomena or processes - see [19]. One of these simple and important indexes is the shortest path length dij between two nodes i and j, defined as the smallest number of links from i to j, among all the possible paths between i and j. On the other hand, the efficiency eij in the communication between nodes i and j can be defined as inversely proportional to the shortest path length between them. The average efficiency E of the network G is the average of all eij, considering all pairs of nodes. The topological vulnerability index of an element k in a network G, Vk, is thus given by
where
Calculating the vulnerability is illustrated in Figure 2. We start by reading our dataset, then calculate the average efficiency E) for the entire graph and disconnect each node k individually to calculate the vulnerability Vk associated with this node.
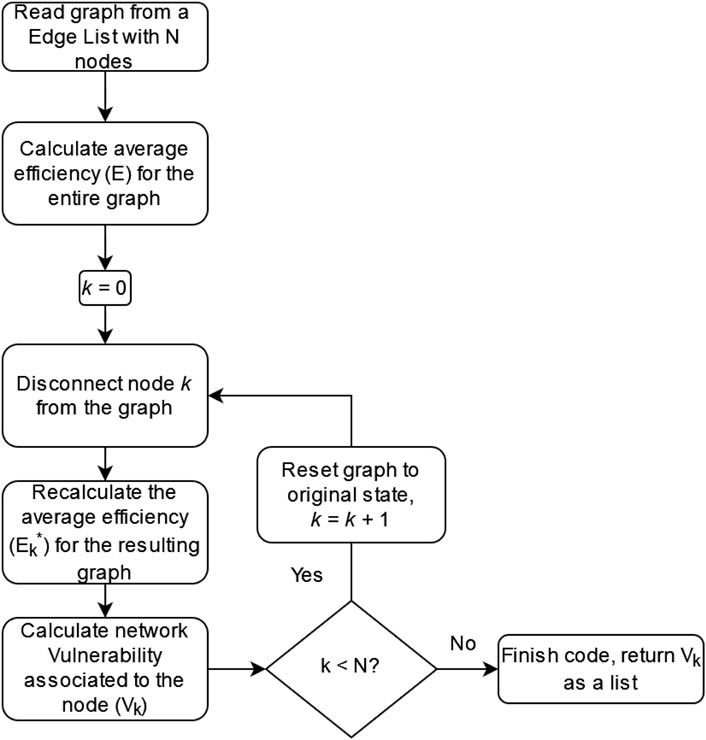
FIGURE 2. Diagram explaining the process to calculate the vulnerability index in a graph.
According to [23], network models are typically aspatial: the emphasis has been on topological interactions, not their geography. More details about space-related properties in Network Science can be found in [24]; [25].
Here, we use the concept and tools of a (geo) graph, a network in a geographical space. Recently, this approach was applied for a mobility network analysis [26] and for a rainfall network analysis [27]. In this paper, we represent a set of highways as a network, calculate the topological vulnerability index of its elements and show them on a map. We highlight the spacial location of the most vulnerable element to combine this information with the locations most susceptible to either floods or landslides.
This section presents a systematic literature mapping papers on road networks, natural hazards, and network vulnerability. We collected manuscripts from Google Scholar using the following search protocol: “(graph OR network) AND (transport OR roads OR highways OR streets) AND (disaster OR flood OR flooding OR landslide) AND (vulnerability)”. The aim is to identify gaps and trends in literature and position our contributions regarding the state-of-the-art.
We selected the first forty papers and, as a cut-off criterion, we discarded those whose abstracts and titles deviated from the subject. In chronological publication order, we ended up with twenty-three articles grouped according to Table 1.
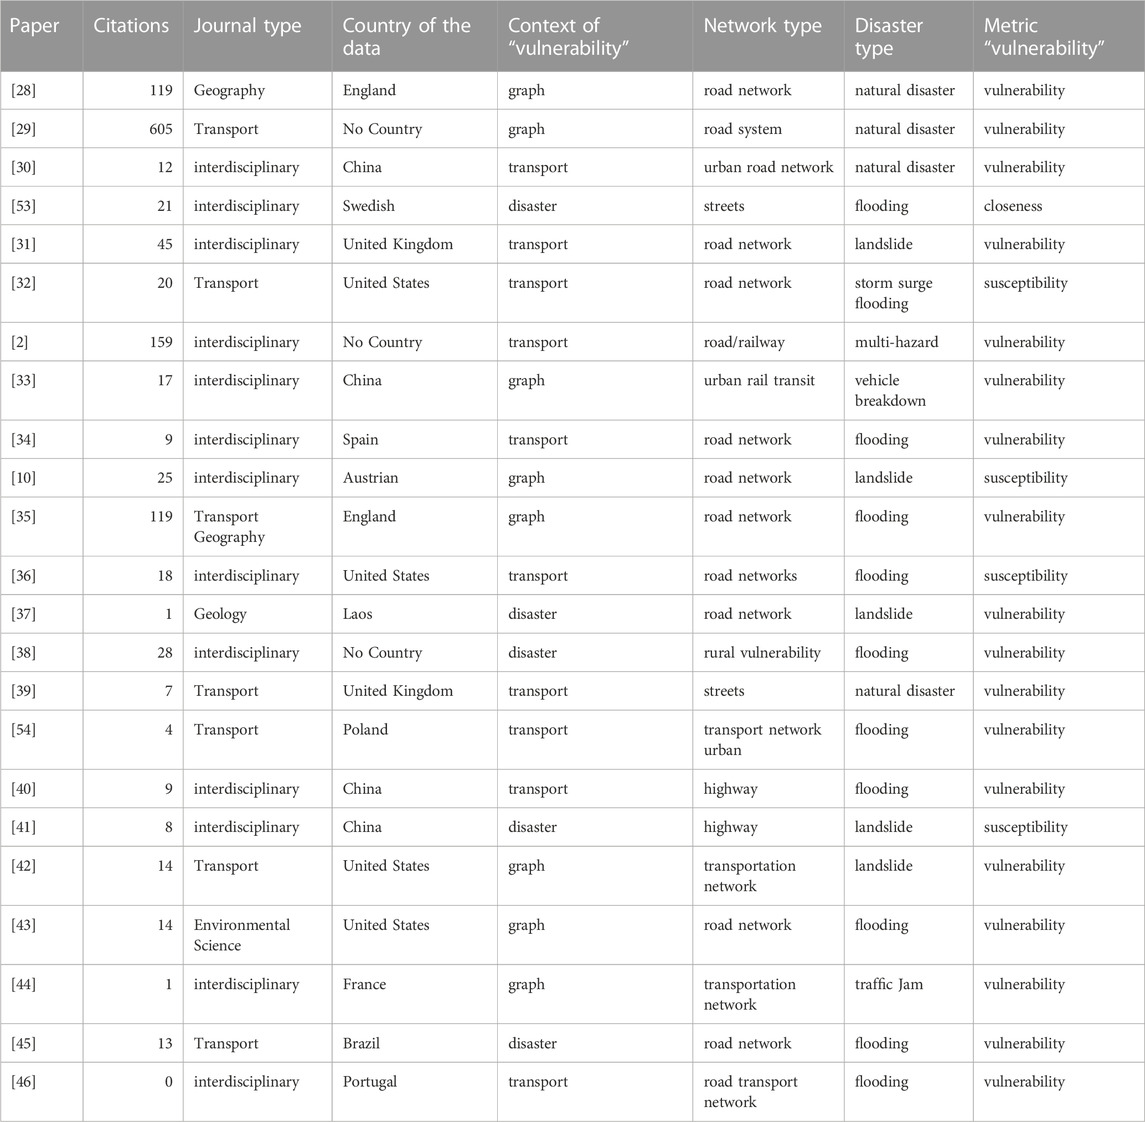
TABLE 1. Results of the systematic literature mapping.
Regarding networks, Roads (highways) are the most frequent, followed by streets (urban networks). Nearly all papers quantify vulnerability with the network metric of the same name. The context of the word “vulnerability” relates more often to transport and graphs, with only a few cases associated with disasters.
In particular, we mention the top three cited papers: [29] provide a review of problems in transport systems around the globe, [2] bring a global view of multiple disasters, and [35] investigate the vulnerability of transport networks from British data. They all explore the problem under different scales: global and country-level.
Some future research directions that the set of papers present: mapping of critical segments (roads) and the creation of susceptibility indexes to build catastrophe models in response to extreme events such as flooding and severe wind storms; mapping landslides incidence and; how severe and frequent the phenomena is becoming [31]. The literature also lacks a detailed assessment of how climate transformations impact transport systems [34].
Here, we quantify links’ vulnerability in a transportation network and susceptibility to hazards and disruptions. We showed that the most well-cited works deal with a similar problem but at a country and global level, whereas we address it from a state-level perspective. Table 1 presents only one paper with Brazilian data but with a different interpretation of the word “vulnerability” and a different scale for the network construction. It shows that our work fills a literature gap.
Using the (geo) graph approach, we represent the set of highways as a network. For the Santa Catarina State case study area, the road network presents 1,536 nodes/road segments and 2,101 directed edges/connections between road segments.
The topological vulnerability index is used to assess the potential impact of disruptions in a transportation network. In the context of the current analysis, this index’s distribution was highly inhomogeneous. It is demonstrated in Figure 3, where the distribution is shown on a double logarithmic scale. Using Clauset’s method [47], the power law fitting to the distribution resulted in an exponent of α = 2.475.
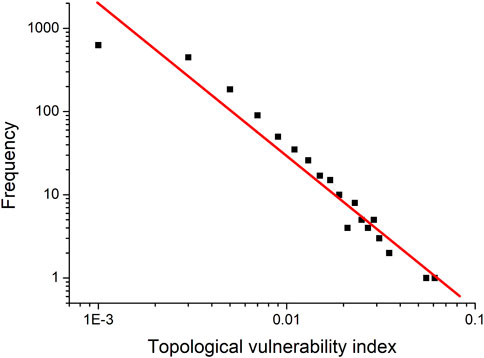
FIGURE 3. Distribution of values for the topological vulnerability index (black squares) and an auxiliary line (red segment) for a power law with an exponent of −2.475).
This finding suggests that the vulnerability of transportation networks is not evenly distributed, with some highways being significantly more vulnerable than others. Specifically, most highways have a low to moderate vulnerability (see Figure 4, segments in green and yellow), while a small subset is highly vulnerable (see Figure 4, segments in red). It indicates that efforts to enhance the resilience of transportation networks should be focused on the most vulnerable highways to ensure the most significant impact in reducing the risk of disruptions.
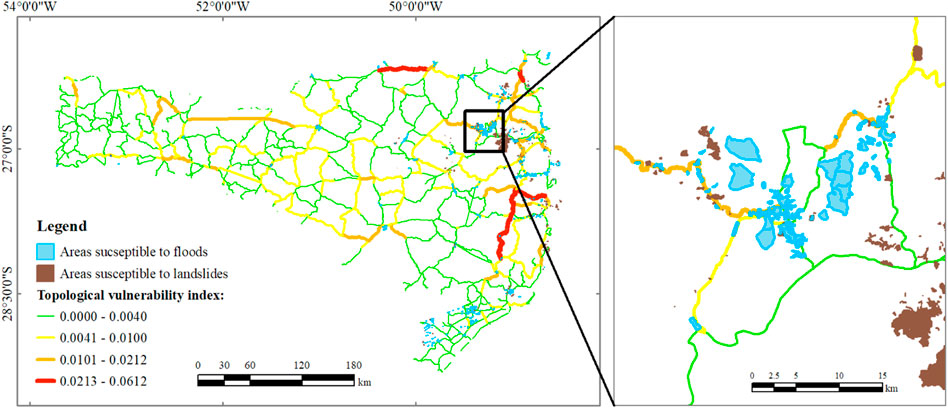
FIGURE 4. Vulnerability index map for the highways in the study area. The green color is associated with the least vulnerable segments and the red color with the most vulnerable ones, following a Jenks natural-break-color scale. The areas susceptible to flood are shown in blue, and the areas susceptible to landslides are shown in brown.
Another important question is about where the most vulnerable elements are, particularly whether they are close to the areas most susceptible to floods. Figure 4 shows the topological vulnerability index map for all highways in the study area. The four classes (colors in Figure 4) correspond to Low Vulnerability, Moderate Vulnerability, High Vulnerability, and Extremely High Vulnerability.
In the subset of the study area in Figure 4, it is possible to see some elements with a high topological vulnerability index close to urban areas susceptible to flood. In this area, in the cities of Rio Negrinho and Mafra, the BR-280 highway crosses the river. This area is marked by several records of floods in the rainy season (susceptibility component), which makes traffic in the region unfeasible (impact).
The highway BR-280 is one of the most important in Santa Catarina state, playing an important role in transporting goods to the ports of São Francisco do Sul and Itajaí (Figure 1). It also promotes the interconnection link between important regional cities, such as Joinville and Jaraguá do Sul. Thus, this highway has a large flow of people and goods.
Considering vulnerability (as a topological index) and susceptible areas, this representation is an important tool for stakeholders from the transportation sector concerning climate change, disaster risk reduction, and sustainable development agenda. Risk Knowledge, combining hazard and vulnerability, is the first pillar of an Early Warning System (EWS) [8]. Also, the transportation sector represents direct and indirect economic losses: the destruction of physical assets and the decline in economic value. In this work, the suggested representation adds knowledge about the potential losses to the disaster risk assessment.
In this paper, we represented the set of highways from our study area as a network and calculated the topological vulnerability index. Using the (geo) graphs approach [26]; [27], it was possible to represent the results in a Geographical Information System.
In our case study, in the south region of Brazil, there are some elements with a vulnerability index of approximately 5% - therefore, a flood impairing the traffic on this highway’s element can reduce the efficiency of this transportation network by approximately 5%. Also, elements with high topological vulnerability index are close to urban flood areas, for example, in Mafra and Rio Negrinho, where the BR-280 highway crosses the Negrinho River. This area is marked by several records of floods in the rainy season (susceptibility component), which makes traffic unfeasible in the region (impact). In the State of Santa Catarina, there is a heavy flow of people and goods, with important national and international ports and airports.
The topological vulnerability index associated with an element of a network (in our case, a highway segment) is a measure quantifying how the system reacts to damage on this element. Although it is a measure associated with the element, the topological vulnerability index contains information about the dynamics throughout the network [48]. The disaster triggering is local, but its impacts can be extended to a wider region. The topological vulnerability index captures this relation, and it is possibly the most important feature of this index.
According to the Sendai Framework for Disaster Risk Reduction 2015–2030, one of the most important documents in the Disaster Risk Reduction (DRR) guidelines, there is one global target related to “Substantially reduce disaster damage to critical infrastructure and disruption of basic services” [49]. Many critical infrastructures (such as roads) are of network type and can be modeled using the Network Science approach [13]. The topological vulnerability index is a network measure particularly interesting in the context of critical infrastructures. Developing a vulnerability map to disasters and their impacts on infrastructures is also aligned with the 2030 Agenda for Sustainable Development, particularly with the Sustainable Development Goals 9, 11, and 13, related to Infrastructures, Intelligent Cities, and Climate [50].
Mapping risk areas is an indispensable step to doing better urban planning and lessening the risk of disasters. This mapping can create a risk reduction plan, define priority areas for attention in the municipalities, make recommendations for works on infrastructure, and prepare municipal master plans. The mapping of risk areas for Santa Catarina follows the guidelines established by GIDES Project [51], which is a partnership between Brazil and Japan to strengthen the National Strategy for Integrated Management of Risks and Disasters. The project’s goal is to reduce the risks of disasters through non-structural preventive actions. The main results are improving assessment systems and risk mapping, warnings, and urban planning for disaster prevention.
A possible extension for this investigation is to draft risk scenarios considering other components, such as the dynamic exposure (daily traffic on each highway) and other kinds of vulnerability, for example, one based on traffic engineering parameters or the coverage of meteorological sensors [52].
The datasets presented in this study can be found in online repositories. The names of the repository/repositories and accession number(s) can be found below: https://github.com/gioguarnieri/highways-vulnerability.
LS—Conceptualization, Methodology, Project Administration, Writing GS—Methodology, Writing TG—Methodology, Writing AJ—Methodology, Writing LL—Conceptualization, Methodology, Writing RR—Methodology, Writing RB—Methodology, Writing CO—Methodology, Writing VF—Methodology, Writing IS—Conceptualization, Review Editing. All authors contributed to the article and approved the submitted version.
São Paulo Research Foundation (FAPESP), Grant Number 2015/50122-0 and DFG-IRTG Grant Number 1740/2; FAPESP Grant Number 2018/06205-7; CNPq Grant Number 420338/2018-7.
The authors declare that the research was conducted in the absence of any commercial or financial relationships that could be construed as a potential conflict of interest.
All claims expressed in this article are solely those of the authors and do not necessarily represent those of their affiliated organizations, or those of the publisher, the editors and the reviewers. Any product that may be evaluated in this article, or claim that may be made by its manufacturer, is not guaranteed or endorsed by the publisher.
1. Pregnolato M, Ford A, Wilkinson SM, Dawson RJ. The impact of flooding on road transport: A depth-disruption function. Transportation Res D: transport Environ (2017) 55:67–81. doi:10.1016/j.trd.2017.06.020
2. Koks EE, Rozenberg J, Zorn C, Tariverdi M, Vousdoukas M, Fraser SA, et al. A global multi-hazard risk analysis of road and railway infrastructure assets. Nat Commun (2019) 10:2677. doi:10.1038/s41467-019-10442-3
3. Randil C, Siriwardana C, Rathnayaka BS. A statistical method for pre-estimating impacts from a disaster: A case study of floods in kaduwela, Sri Lanka. Int J Disaster Risk Reduction (2022) 76:103010. doi:10.1016/j.ijdrr.2022.103010
4. Marulanda M, de la Llera J, Cardona O. A macroeconomic disaster risk analysis: The case study of Chile. Int J Disaster Risk Reduction (2022) 74:102875. doi:10.1016/j.ijdrr.2022.102875
5. Santos LB, Carvalho T, Anderson LO, Rudorff CM, Marchezini V, Londe LR, et al. An rs-gis-based comprehensive impact assessment of floods—A case study in madeira river, Western brazilian amazon. IEEE Geosci Remote Sensing Lett (2017) 14:1614–7. doi:10.1109/lgrs.2017.2726524
6. Parizzi MG. Panorama dos desastres climatológicos, hidrológicos, meteorológicos e geológicos durante o período de 2010–2019. Derbyana (2022) 43. doi:10.14295/derb.v43.766
7. Zákhia EMS, Alvarenga LA, Tomasella J, Martins MA, Santos ACN, Melo PA. Impactos das mudanças climáticas em uma bacia hidrográfica no sul do estado de minas gerais. Revista Brasileira de Meteorologia (2022) 36:667–81. doi:10.1590/0102-7786360002
8.UNDRR. Global assessment report on disaster risk reduction atlas: unveiling global disaster risk (2017). [Dataset]. Available at: https://www.undrr.org/we/inform/publications/53086.
9. Wisner B. At risk. In: At risk: Natural hazards, people’s vulnerability and disasters (1994). p. 23.
10. Schlögl M, Richter G, Avian M, Thaler T, Heiss G, Lenz G, et al. On the nexus between landslide susceptibility and transport infrastructure–an agent-based approach. Nat hazards earth Syst Sci (2019) 19:201–19. doi:10.5194/nhess-19-201-2019
11. Berdica K. An introduction to road vulnerability: What has been done, is done and should be done. Transport policy (2002) 9:117–27. doi:10.1016/s0967-070x(02)00011-2
12. Taylor MA, Sekhar SV, D’Este GM. Application of accessibility based methods for vulnerability analysis of strategic road networks. Networks Spat Econ (2006) 6:267–91. doi:10.1007/s11067-006-9284-9
14. Herrmann MLP. Atlas de desastres naturais do estado de santa catarina: Período de 1980 a 2010. In: IHGSC/Cadernos geográficos (2014). p. 2.
15.IBGE. Ibge – instituto brasileiro de geografia e estatística (2017). [Dataset] (Online; accessed October 11, 2019).
16. Londe Ld. R, Coutinho MP, Gregório D, Torres L, Santos LBL, Soriano É. Desastres relacionados à água no brasil: Perspectivas e recomendações. Ambiente & Sociedade (2014) 17:133–52. doi:10.1590/1809-4422asoc1082v1742014
17. Londe Ld. R, Marchezini V, Conceição RSd., Bortoletto KC, Silva AEP, Santos EVd., et al. Impactos de desastres socioambientais em saúde pública: Estudos dos casos dos estados de santa catarina em 2008 e pernambuco em 2010. Revista Brasileira de Estudos de População (2015) 32:537–62. doi:10.1590/s0102-3098201500000031
18.CPRM. Cprm - geological survey of Brazil (2017). [Dataset] (Online; accessed September 18, 2019).
19. Costa Ld. F, Rodrigues FA, Travieso G, Villas Boas PR. Characterization of complex networks: A survey of measurements. Adv Phys (2007) 56:167–242. doi:10.1080/00018730601170527
20. Gol’dshtein V, Koganov G, Surdutovich GI. Vulnerability and hierarchy of complex networks (2004). arXiv preprint cond-mat/0409298.
21. Latora V, Marchiori M. Efficient behavior of small-world networks. Phys Rev Lett (2001) 87:198701. doi:10.1103/physrevlett.87.198701
22. Latora V, Marchiori M. Vulnerability and protection of infrastructure networks. Phys Rev E (2004) 71:015103. doi:10.1103/physreve.71.015103
23. Pregnolato M, Ford A, Robson C, Glenis V, Barr S, Dawson R. Assessing urban strategies for reducing the impacts of extreme weather on infrastructure networks. R Soc open Sci (2016) 3:160023. doi:10.1098/rsos.160023
25. Daqing L, Kosmidis K, Bunde A, Havlin S. Dimension of spatially embedded networks. Nat Phys (2011) 7:481–4. doi:10.1038/nphys1932
26. Lima Santos LB, Carvalho LM, Ceron W, Coelho FC, Macau EE, Quiles MG, et al. How do urban mobility (geo) graph’s topological properties fill a map? Appl Netw Sci (2019) 4:91–14. doi:10.1007/s41109-019-0211-7
27. Ceron W, Santos LB, Neto GD, Quiles MG, Candido OA. Community detection in very high-resolution meteorological networks. IEEE Geosci Remote Sensing Lett (2019) 17:2007–10. doi:10.1109/lgrs.2019.2955508
28. Balijepalli C, Oppong O. Measuring vulnerability of road network considering the extent of serviceability of critical road links in urban areas. J Transport Geogr (2014) 39:145–55. doi:10.1016/j.jtrangeo.2014.06.025
29. Mattsson LG, Jenelius E. Vulnerability and resilience of transport systems - a discussion of recent research. Transportation Res A: Pol Pract (2015) 81:16–34. doi:10.1016/j.tra.2015.06.002
30. Lu G, Xiong Y, Ding C, Wang Y. An optimal schedule for urban road network repair based on the greedy algorithm. PLoS ONE (2016) 11:e0164780. doi:10.1371/journal.pone.0164780
31. Postance B, Hillier J, Dijkstra T, Dixon N. Extending natural hazard impacts: An assessment of landslide disruptions on a national road transportation network. Environ Res Lett (2017) 12:014010. doi:10.1088/1748-9326/aa5555
32. Helderop E, Grubesic TH. Streets, storm surge, and the frailty of urban transport systems: A grid-based approach for identifying informal street network connections to facilitate mobility. Transportation Res D: Transport Environ (2019) 77:337–51. doi:10.1016/j.trd.2018.12.024
33. Lu QC, Lin S. Vulnerability analysis of urban rail transit network within multi-modal public transport networks. Sustainability (Switzerland) (2019) 11:2109. doi:10.3390/SU11072109
34. Pérez-Morales A, Gomariz-Castillo F, Pardo-Zaragoza P. Vulnerability of transport networks to multi-scenario flooding and optimum location of emergency management centers. Water (Switzerland) (2019) 11. doi:10.3390/w11061197
35. Abdulla B, Kiaghadi A, Rifai HS, Birgisson B. Characterization of vulnerability of road networks to fluvial flooding using sis network diffusion model. J Infrastructure Preservation Resilience (2020) 1:6. doi:10.1186/s43065-020-00004-z
36. Fan C, Jiang X, Mostafavi A. A network percolation-based contagion model of flood propagation and recession in urban road networks. Scientific Rep (2020) 10:13481. doi:10.1038/s41598-020-70524-x
37. Hearn GJ, Pongpanya P. Developing a landslide vulnerability assessment for the national road network in Laos. Q J Eng Geology Hydrogeology (2020) 54. doi:10.1144/qjegh2020-110
38. Jamshed A, Birkmann J, Feldmeyer D, Rana IA. A conceptual framework to understand the dynamics of rural-urban linkages for rural flood vulnerability. Sustainability (Switzerland) (2020) 12:2894. doi:10.3390/su12072894
39. Mera AP, Balijepalli C. Towards improving resilience of cities: An optimisation approach to minimising vulnerability to disruption due to natural disasters under budgetary constraints. Transportation (2020) 47:1809–42. doi:10.1007/s11116-019-09984-8
40. Wang W, Yang S, Gao J, Hu F, Zhao W, Stanley HE. An integrated approach for assessing the impact of large-scale future floods on a highway transport system. Risk Anal (2020) 40:1780–94. doi:10.1111/risa.13507
41. Yin C, Li H, Che F, Li Y, Hu Z, Liu D. Susceptibility mapping and zoning of highway landslide disasters in China. PLoS ONE (2020) 15:e0235780. doi:10.1371/journal.pone.0235780
42. Zhang Q, Yu H, Li Z, Zhang G, Ma DT. Assessing potential likelihood and impacts of landslides on transportation network vulnerability. Transportation Res Part D: Transport Environ (2020) 82:102304. doi:10.1016/j.trd.2020.102304
43. Alabbad Y, Mount J, Campbell AM, Demir I. Assessment of transportation system disruption and accessibility to critical amenities during flooding: Iowa case study. Sci Total Environ (2021) 793:148476. doi:10.1016/j.scitotenv.2021.148476
44. Furno A, Faouzi NEE, Sharma R, Zimeo E. Graph-based ahead monitoring of vulnerabilities in large dynamic transportation networks. PLoS ONE (2021) 16:e0248764. doi:10.1371/journal.pone.0248764
45. Morelli AB, Cunha AL. Measuring urban road network vulnerability to extreme events: An application for urban floods. Transportation Res Part D: Transport Environ (2021) 93:102770. doi:10.1016/j.trd.2021.102770
46. Shahdani FJ, Santamaria-Ariza M, Sousa HS, Coelho M, Matos JC. Assessing flood indirect impacts on road transport networks applying mesoscopic traffic modelling: The case study of santarém, Portugal. Appl Sci (Switzerland) (2022) 12:3076. doi:10.3390/app12063076
47. Clauset A, Shalizi CR, Newman ME. Power-law distributions in empirical data. SIAM Rev (2009) 51:661–703. doi:10.1137/070710111
48. Santos LBL, Londe LR, Carvalho TJd., Menasché DS, Vega-Oliveros DA. About interfaces between machine learning, complex networks, survivability analysis, and disaster risk reduction. In: Towards mathematics, computers and environment: A disasters perspective. Springer (2019). p. 185–215.
49. Aitsi-Selmi A, Egawa S, Sasaki H, Wannous C, Murray V. The sendai framework for disaster risk reduction: Renewing the global commitment to people’s resilience, health, and well-being. Int J Disaster Risk Sci (2015) 6:164–76. doi:10.1007/s13753-015-0050-9
50.SDG. Sdg - sustainable development goals (2019). [Dataset] (Online; accessed September 23, 2019).
52. Carvalho T, Jorge AAS, Bernardes T, Londe LR, Soriano E, Santos LB. A computational index to expose vulnerabilities in transport infrastructure and socio-environmental disasters: From susceptibility areas analisys to monitoring coverage. IEEE LATIN AMERICA TRANSACTIONS (2018) 16:1454–9. doi:10.1109/tla.2018.8408441
53. Andersson-Sköld Y, Nyberg L. Effective and sustainable flood and landslide risk reduction measures: An investigation of two assessment frameworks. Int J Disaster Risk Sci (2016) 7 (4):374–392. doi:10.1007/s13753-016-0106-5
Keywords: disasters, transportation, vulnerability, floods, graphs, complex networks, systematic literature mapping
Citation: Santos LBL, Soares GG, Garg T, Jorge AAS, Londe LR, Reani RT, Bacelar RB, Oliveira CES, Freitas VLS and Sokolov IM (2023) Vulnerability analysis in complex networks under a flood risk reduction point of view. Front. Phys. 11:1064122. doi: 10.3389/fphy.2023.1064122
Received: 07 October 2022; Accepted: 15 March 2023;
Published: 24 March 2023.
Edited by:
Gaogao Dong, Jiangsu University, ChinaCopyright © 2023 Santos, Soares, Garg, Jorge, Londe, Reani, Bacelar, Oliveira, Freitas and Sokolov. This is an open-access article distributed under the terms of the Creative Commons Attribution License (CC BY). The use, distribution or reproduction in other forums is permitted, provided the original author(s) and the copyright owner(s) are credited and that the original publication in this journal is cited, in accordance with accepted academic practice. No use, distribution or reproduction is permitted which does not comply with these terms.
*Correspondence: Leonardo B. L. Santos, bGVvbmFyZG8uc2FudG9zQGNlbWFkZW4uZ292LmJy
Disclaimer: All claims expressed in this article are solely those of the authors and do not necessarily represent those of their affiliated organizations, or those of the publisher, the editors and the reviewers. Any product that may be evaluated in this article or claim that may be made by its manufacturer is not guaranteed or endorsed by the publisher.
Research integrity at Frontiers
Learn more about the work of our research integrity team to safeguard the quality of each article we publish.