 Matthew Stevens
 Eugeniu Balaur
 Brian Abbey
- Department of Mathematical and Physical Sciences, School of Computing Engineering and Mathematical Sciences, La Trobe Institute for Molecular Sciences, La Trobe University, Bundoora, VIC, Australia
We present simulations of a square flow focusing droplet generator device exploring its performance characteristics over a range of interfacial surface tension values and varying neck width. Droplet generators have a wide range of applications from drug delivery to X-ray diffraction experiments. Matching the droplet frequency and volume to the experimental parameters is critical for maximising the data quality and minimising sample waste. Whilst varying the interfacial surface tension we observed that the lowest frequency of droplets is generated for surface tensions matching those typically reported for water-oil mixtures (around 40 mN/M). Decreasing or increasing the interfacial surface tension, for example by adding surfactant, results in an increase in droplet frequency. We also find that under the conditions simulated here, droplets are generated with much lower capillary numbers and higher Weber numbers than have typically been reported in the literature. The high ratio of flowrate-to-cross-section used here resulted in a velocity which was larger than has previously been reported for flow focusing devices and consequently we observe particularly large associated Reynolds numbers. However, in general, the simulated flow behaviour characteristics most closely match those typically observed for the jetting and tip-streaming regimes. The highest frequency of droplets achieved in our simulated devices was 36 kHz and 56 kHz corresponding to square neck channel widths of 12.5 and 25 µm respectively, an interfacial surface tension of 118.75 mN/m. We also examined the effect of varying neck width geometry for a fixed interfacial surface tension of 52 mN/m. We observed that the highest frequency droplet generation, 61 kHz, corresponded to a neck width of 37.5 µm with a corresponding droplet diameter of 22 µm. The high frequency, high monodispersity, and small droplet size predicted to occur through modification of the interfacial surface tension will have implications for the future design and optimisation of droplet-on-demand microfluidic devices.
1 Introduction
Microfluidic devices for generating droplets have found a huge range of applications in recent years including monitoring of chemical reaction using ultra-fast mixing [1, 2], the formation of nanoparticles [3, 4], sample delivery at X-ray Free Electron Lasers (XFELs) [5–7] and single-molecule detection [8], and for drug delivery [9]. Understanding and modelling droplet generation in these devices is key to controlling droplet volume, frequency, and monodispersity [10]. For example, the application of droplet-based microfluidics for XFEL sample delivery necessitates a highly monodisperse distribution of droplets with a well-characterised and tuneable frequency [11, 12]. It is also often desirable to minimise the size of individual droplets and to be able to reliably deliver them to precise locations at high frequencies. In this paper we present a systematic simulation study exploring the upper limit of droplet generation in terms of frequency/flow rate whilst maintaining a small droplet volume—particularly relevant to XFEL sample delivery [13, 14].
Microfluidic droplet generators can be categorised as either passive or active. Passive droplet generators exploit the flow characteristics and geometry to induce breakup of the liquid stream whilst active droplet-based microfluidics external sources of energy such as acoustic waves or energy and magnetic or electric fields [15]. The simplicity and comparatively low-cost of passive microfluidic droplet generators make them highly attractive in cases where significant modifications to the droplet characteristics are not required ‘on-the-fly’. Of the wide range of passive droplet generators that have been developed, these can be further classified as cross-flow (or “T-junction”), co-flow, or flow-focusing devices [16]. To maximise control over the droplet size and monodispersity we have chosen to simulate droplet generators of the flow-focusing category [17]. Compared to T-junction and co-flow droplet generators, flow focusing devices provide a wider range of parameters to control droplet characteristics and thus create opportunities to tailor the output without, for example, modifying the wall wettability [18].
The basic elements of the microfluidic T-junction droplet generator are that a buffer/continuous phase flows within a channel and receives the droplet forming sample/continuous phase injection from a side channel intersecting at 90°. These devices have a tendency to form ‘plug-like’ droplets whose dimensions scale in proportion to the flow rate and size of the channels. The advantages of T-junction droplet generators are ease of fabrication and reliability; however, it is difficult to achieve very small droplet sizes using these devices due to the practical limits on channel size. The high resistance associated with having small channels also creates issues in terms of blockage of those channels. To address this issue it has been suggested the channel walls can be chemically modified to reduce their hydrophobicity and facilitate high-flow rates [17].
Coflowing microfluidic droplet generators meanwhile consist of two coaxial channels. The coaxial geometry within these devices is often formed by a capillary tube being placed inside of a rectangular channel. The capillary then supplies the dispersed phase/sample whilst the surrounding rectangular tube contains the continuous phase fluid. The flow rate of the surrounding sheath fluid can be adjusted to control the breakup of the dispersed phase fluid [17]. Related to this, a recent study [19] found that the capillary number of the continuous phase in coflowing droplet generators plays a key role in controlling the breakup regime for droplet formation. Whilst coflowing devices offer greater flexibility, for example, in controlling breakup versus surface tension and Rayleigh instability, the added complexity and restrictions in terms of device geometry can potentially limit their applicability in the context of sample delivery.
Flow-focusing droplet generators comprise a junction in which the dispersed phase is hydrodynamically focused by the continuous phase [17]. The geometry of these devices can be either 3-D axisymmetric, or quasi-2D planar [15]. Axisymmetric devices provide a dispersed phase through a cylindrical inlet, which is hydrodynamically focussed as both phases pass through a circular baffle. Alternatively, planar geometries consist of one dispersed phase inlet surrounded by two continuous phase inlets, contained within a maze-like structure of constant height that focuses the dispersed phase using the continuous phase fluid [20]. Flow focusing devices can be manufactured to high spatial resolution via lithography, allowing them to achieve small feature sizes. Flow-focusing droplet generation can be primarily inertial, for example, when the outer channels are directed backwards towards the fluid intersection, or geometric, as in the case of ‘geometry-controlled’ droplet generation. The combination of inertial and geometric effects are a key feature of flow-focusing devices and the mechanism for droplet generation critically depends on parameters such as the capillary number, Weber number, relative viscosity of the dispersed and continuous phase as well as the flow rate.
Flow focusing devices vary widely in design, from typical planar flow focusing with a straight neck [21–25], through variations on a simple rectangular cross motif [26, 27], to coaxial flow focusing [28], and the closely related coflowing droplet generators [29]. The channel diameters tend to vary from 10’s of µm [26] to the upper limit of microfluidics of hundreds of µm [30]. In the literature, flow rate is regularly the independent variable when studying flow regimes and mechanics. Flow rates can range from single digit µL/min [23], into the 10’s like most studies [20], or even many orders higher [29].
Previous studies have examined both the potential applications and mechanics of microfluidic flow focusing droplet generators [26, 28, 31, 32]. The high flow rates and range of surface tensions explored in the present study are rare, and even less commonly achieve comparable droplet frequencies [33]. This study shows that these conditions are conducive to highly frequent and monodisperse droplets. It is envisaged that the results from this study will translate into the design optimisation of microfluidic devices for droplet-on-demand sample delivery and rapid mixing [34, 35].
Passive microfluidic flow-focusing droplet generators can be classified in a number of different ways; most commonly, however, they are categorised according to the capillary number, Ca, of the continuous phase. This dimensionless number describes the ratio of viscous forces to interfacial tension forces that contribute to the fluid flow features
where µ is dynamic viscosity, V is velocity, and
The Weber number, We, is also used to categorise flow-focusing microfluidic devices in the literature:
where ρ is density and L is the characteristic length, or hydraulic diameter of the channel.
However, this is less commonly used then the capillary number since We describes the ratio of inertial forces to interfacial tension forces in a flow and inertia has typically been assumed to be of secondary importance in flow-focusing microfluidics [9]. The common neglect of the effects of inertia in flow-focusing devices can be attributed to the fact that the Reynolds number, Re,
which represents the ratio of inertial to viscous forces, is much less than unity in these devices. However, we will observe that under the specific conditions simulated here the effects of inertia are, in fact critical leading to higher values of Re than are typically reported for flow-focusing devices. Hence, in the present case, We was selected as the primary variable since the key characteristics of the devices e.g. droplet diameter and droplet dispersity show the most important variations when plotted as a function of We.
The features of droplet generating microfluidic devices which are typically of most interest are the jet length, droplet breakup position, droplet size, droplet frequency and droplet size uniformity (monodispersity). Experimentally, jet length, breakup position, and droplet size are typically determined from images of the device whilst in operation. Whilst jet length and breakup position are typically defined as simple distance measurements from the point of intersection of the continuous and dispersed phase, droplet size can be characterised in multiple ways, for example, droplet diameter, volume, and diameter coefficient of variation (CV). Because these parameters are normally determined from 2D images of the devices, it can often be hard in experiment to measure the precise droplet volume, however in simulation this quantity can be accurately determined to the mesh resolution of the simulation. CV is defined as: CV(%) =
Flow-focusing microfluidic devices have historically been classified as corresponding to one of three regimes: squeezing, dripping, or jetting, depending on the corresponding Ca for the device. More recently however, two additional regimes have been identified, classified as ‘tip-streaming’ and ‘tip-multi-breaking’ [36, 37]. These two additional regimes have been observed when moving to higher values of Ca and are distinguished by the relative influence of viscosity or inertia on droplet generation associated with these devices.
Within the squeezing regime droplets are generated periodically. The process is initiated by the orifice being filled by the dispersed phase. Next, the continuous phase pressure builds up and “squeezes” the dispersed phase into a droplet. The droplet is pushed out of the channel by the continuous phase, building up the pressure of the dispersed phase. Finally, the dispersed phase blocks the orifice again, and the cycle repeats. The upper Ca limit for the squeezing regime has been said to vary between 3 × 10⁻³ and one depending on the channel size, flow rate ratio, and viscosity [38], but is typically on the order of Ca ∼10–2 [15, 26, 31].
Once the viscosity is sufficiently large that it can overcome surface tension, breakup of the dispersed phase transitions to the dripping regime [15, 19, 28, 38]. In dripping, Ca is typically larger than it is for the squeezing regime, starting at 10–2 [15, 19, 38]. Within the dripping regime drag forces are often the dominant cause of droplet formation and droplet diameters are often reported as being highly monodisperse [9, 15, 19, 38].
As the capillary number is further increased, the jetting regime is reached. In this regime, droplet size grows and with it the polydispersity of the droplet distribution. The main cause of droplet generation in the jetting regime is typically described as Rayleigh-Plateau instabilities [15, 17]. The capillary number associated with the continuous phase, Cac, of jetting is limited to less than ∼0.5. The corresponding onset length of this regime is purported to be equivalent to at least three times the orifice diameter [19].
Whilst jetting was traditionally viewed as the final regime for flow-focusing droplet generation, more recently tip-streaming has been classified as a separate regime [36] occurring when a thin jet under shear or elongational flow, breaks up into extremely small (sub-micron) droplets mediated by Rayleigh-Plateau instabilities. To achieve this the capillary number should be at least 0.5 with a corresponding viscosity ratio, λ = µd/µc, of at least 0.1, where µd and µc are the viscosities of the dispersed and continuous phases respectively. To reach this regime, surfactant is typically employed, with the amount of surfactant to be added being inversely proportional to the interfacial surface tension and proportional to droplet diameter [15]. Additionally, the Re of both the dispersed and continuous phase in this regime is << 1. In this regime viscous forces dominate droplet formation, and the corresponding distribution of droplets has been reported as being highly monodisperse.
Even more recently [37] a fifth regime labelled the “tip-multi-breaking” regime has been identified. Unlike the tip-streaming regime, here Ca is normally less than for either tip-streaming or jetting but is greater than for the squeezing and dripping regimes. In the tip-multi-breaking regime, the viscosity ratio is still small, but the breakup is dominated by inertia. Cyclical oscillation of the dispersed liquid causes sequentially sized droplets to be released in this regime.
The systematic variation of surface tension variation is routinely investigated by starting with a pair of immiscible liquids, such as water and oil, which have a high interfacial surface tension, and then decreasing the tension via the addition of surfactant. The combination of the presence of surfactants combined with microfluidics can introduce dynamic variations in the local surfactant kinetics on the boundary of the droplets. The kinetics depend on the local shear forces, surfactant concentration gradients, and the difference between equilibrium surfactant distribution time and droplet breakup time [39–41]. These effects may be approximated by utilising velocity dependant and spatially dependant surface tension values for the droplets during simulation [19, 42, 43].
Largely due to the limits of computational resources most of the early simulation studies of droplet forming microfluidic devices approximated the three-dimensional fluid flow as a two-dimensional process. Continuous advancement in computing capabilities and the sophistication of simulations now provide the opportunity to explore, in a 3D simulated environment, the effect of varying parameters such as surfactant concentration and flow rate. The results of these studies can in turn provide general information allowing for the optimised fabrication and operation of droplet forming microfluidic devices. In simulation, detailed quantitative analysis can also be performed and more extreme situations explored to better understand the practical limits of empirically derived laws governing droplet formation.
Here we carry out a series of three-dimensional simulations of flow-focusing microfluidics with a continuous phase composed of oil and a dispersed phase composed of water. We explore the high-frequency droplet generation regime in the context of varying interfacial surface tension and geometry. In comparison to earlier simulation studies which have explored the effect of surface tension on droplet formation—the dimensions of our devices are small—matching current capabilities for microfluidic fabrication, the flow rates are higher, and the range of interfacial surface tensions are larger than has been looked at previously [33]. In particular, the flow rates were chosen to facilitate Gas Dynamic Virtual Nozzle (GDVN) jetting conditions [14]. It is envisaged that the results will translate into design optimisation of microfluidic devices for sample delivery and rapid mixing.
2 Materials and methods
Simulations were performed using COMSOL Multiphysics software, versions 5.6 and 6.0. The behaviour of the two-phase fluids was studied using the Two-Phase Flow Multiphysics module, which couples the Laminar Flow module responsible for the fluid flow conditions and Level Set module describing the moving interface. The Laminar Flow module was selected to model the constraints present in thin microfluidic systems, which often have low Reynolds numbers due to their small characteristic length scales [17].
The COMSOL Multiphysics FEM software package provides for both adaptive and static mesh simulation approaches. The former yields infinitesimal liquid-liquid interface thickness results by placing mesh element points at the interface. This interface calculation is then repeated for each time point. To allow for dispersed phase separation, a static mesh model, such as ‘Level Set’ or ‘Phase Field’, is required. Considering that the “Level Set” model is the more computationally efficient of the two, it is the more commonly employed in order to minimise calculation time.
The governing equations used by the Level Set model to represent a two fluid water and oil system are the incompressible Navier-Stokes equations. Eq. 4 is called the continuity equation and it ensures fluid incompressibility by requiring that fluid cannot converge to, or diverge from, any single point according to conservation of mass,
where u is the velocity vector. Eq. 5 is the momentum equation, which fulfills the requirement for changes in fluid flow to result from pressure and other forces whilst maintaining conservation of momentum,
where ρ, t, p, I, μ, Fg, Fst, Fext, and F are density, time, pressure, the identity matrix, dynamic viscosity, the force of gravity, the surface tension force, the external force, and any applicable additional forces, respectively. Note that only the Phase Field model uses Fext. Fg is equal to ρg where g is the gravity vector. Since there are no additional forces, F is not applicable here. Fst is defined by Eq. 6:
where σ is surface tension, δ is the Dirac-delta function at the interface, ∇s is the surface gradient operator, 𝜅 is the curvature of the interface, and n is the vector orthonormal to the interface. It can be seen from Eq. 6 that Fst comprises contributions from the continuum method (57), derived from the Young-Laplace equation, and the single-phase Marangoni force. Eq. 7 is added into the self-consistent equations by the Level Set model for the purpose of tracking the fluid interface:
where γ is the reinitialization parameter and ε is the “parameter controlling interface thickness”. The interface controlling parameter is not definitively equal to the thickness of the interface, it only controls a function that determines the thickness. The default value for the parameter is half of the maximum element size within the region intersecting the interface.
Simulations were performed using COMSOL Multiphysics software, versions 5.6 and 6.0. A square channel was simulated with symmetry constraints applied along the y and z axes. This reduced the simulation time by 75% whilst maintaining all essential features of the device. Typical simulation times were around 30 h for some of the devices simulated within this study which comprised around 420,000 elements. Some simulations, e.g., those with especially small neck widths below 25 µm could take up to 5 days to complete due to the increase in the density of mesh elements. The computer used for simulations is equipped with two intel Xeon e5-2687w v2, 8 core, 3.40 GHz CPUs, 128 GB RAM and the simulations each occupied approximately 20 GB of storage space.
All of the results presented here are from simulations which converged to a stable solution for droplet generation. The mesh resolution was optimised and validated to confirm that using a finer mesh did not result in variations in the output of the simulation model. Simulations were carried out assuming a constant slip length. Some studies reported in the literature apply a ‘no slip’ condition, whilst this results in a computationally more efficient model, it comes at the cost of accuracy and therefore was not adopted in the present case. A schematic illustrating the representative geometry used for this study is shown in Figure 1. The channels used throughout the device were square in order to mimic the two most common fabrication geometries encountered for flow-focusing devices, axisymmetric, and planar. A key feature of the flow-focusing devices simulated here are that they include a flow baffle in which the thin neck restricts the flow of the water/oil mixture. The incorporation of a comparatively long outlet channel allowed for the study of a wide range of breakup lengths.
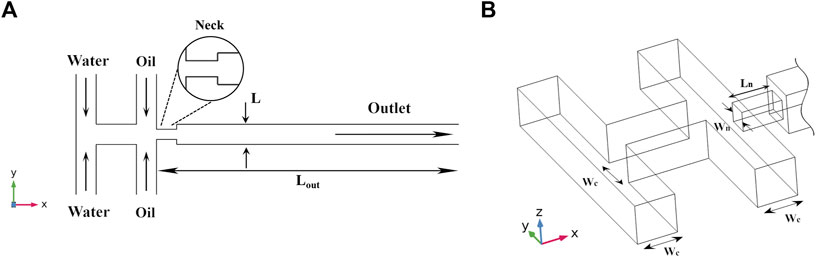
FIGURE 1. (A) Top-down view of simulation geometry, note that schematic is not to scale. Water is the dispersed phase whilst oil corresponds to the continuous phase. Lout = 2 mm. L is the characteristic length, or hydraulic diameter of the channel. An enlarged top-down view of just the neck region is shown in the circle. (B) Enlarged isometric view of inlets, Wc = 50 μm, Wn corresponds to the neck width which was varied between 12.5 µm and 50 µm. The neck length, Ln = 50 µm. All channels were square.
Figure 1A shows the water and oil inlets; water was injected at a volumetric flow rate of Qd = 20 μL/min whilst oil was injected at a volumetric flow rate of Qc = 100 μL/min. The resulting flow rate ratio was thus: φ = Qd/Qc = 1/5. All simulations were carried out under standard temperature and pressure (STP). For water the viscosity and density were µd = 1.0 mPa•s and ρd = 1.0 g/cm3 respectively, for oil they were µc = 4.1 mPa•s and 1.78 g/cm3, yielding a constant viscosity ratio of λ = 0.24. The main parameters using in the simulation are shown in Table 1.
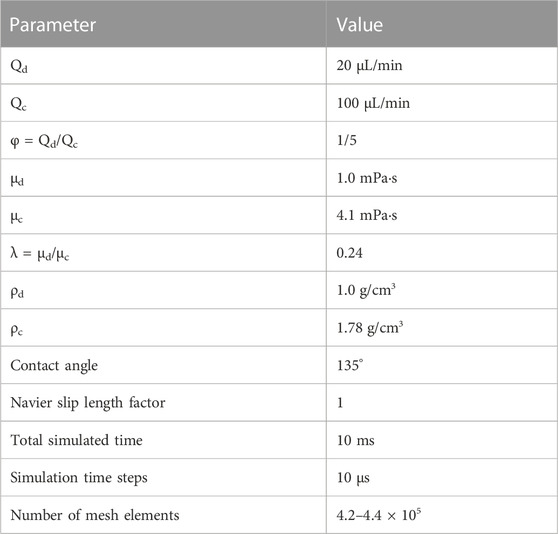
TABLE 1. Parameters used for simulations.
Solid-liquid interfaces are subject to flow restrictions from friction, approximated by the slip condition, and capillary forces which can be determined from the contact angle. The contact angle used here is 135, corresponding to most common materials used in microfluidics (e.g., SU-8) and the slip condition is Navier Slip, or partial slip, with a slip length factor of 1. It is also worth noting that the distance from the channel wall to the point of zero velocity, defined as the “slip distance,” in COMSOL is set as a constant equal to the constant “slip length factor” multiplied by the smallest mesh element in the simulation. Time-dependant simulations under these conditions were carried out with a time-increment of 10 µs. The total simulation time was 10 ms, during which the droplet generation was observed to have stabilised. Here, a constant viscosity is used whilst the interfacial surface tension, σ, is varied and evaluated dynamically during the simulation as a function of position in the x-direction:
where
The rationale behind this selection is three-fold. First, the surface tension is a variable, and the systems being simulated match the criteria for surfactant laden droplet generation, in which surfactant, and hence surface tension, vary both spatially and temporally along the length of the neck. Secondly, the specific function used was selected for its computational simplicity, it can be readily interpreted as a spatial approximation of normal dynamic surface tension [43]. Finally, because the function describing varying surface tension doesn’t involve any feedback from the fluid flow results, it can be evaluated and updated at each and every cycle without significantly impacting calculation speed.
3 Results
Figure 2 shows representative isosurface renderings of droplet generation for a range of different initial surface tensions and neck sizes. These results were used to quantify the droplet onset length and volume.
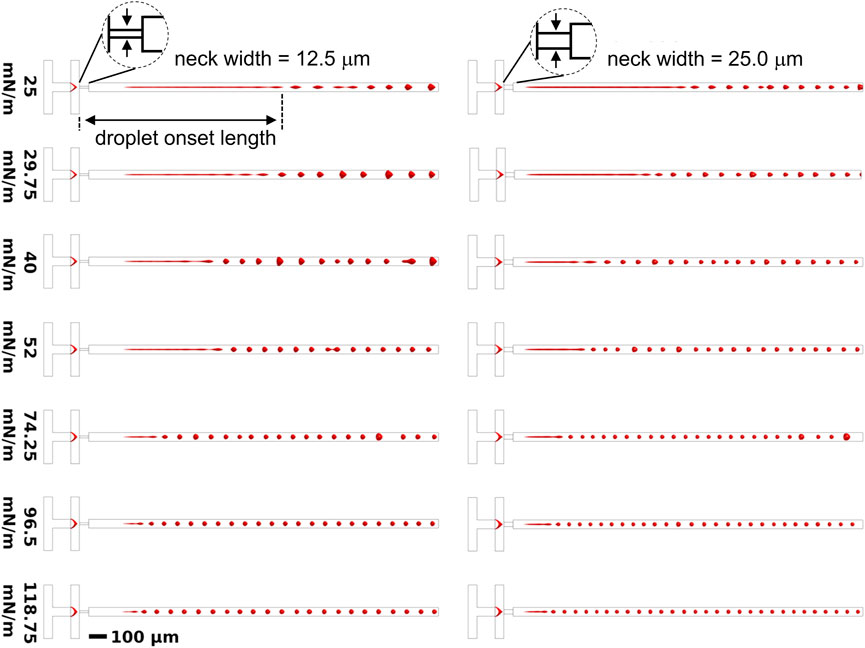
FIGURE 2. Top-down view of an isosurface render of stable droplet generation after 10 ms corresponding to a neck width of 12.5 μm and 25 µm as a function of the initial surface tension,
3.1 Breakup onset
Figure 3A shows the droplet onset length as a function of the initial surface tension (
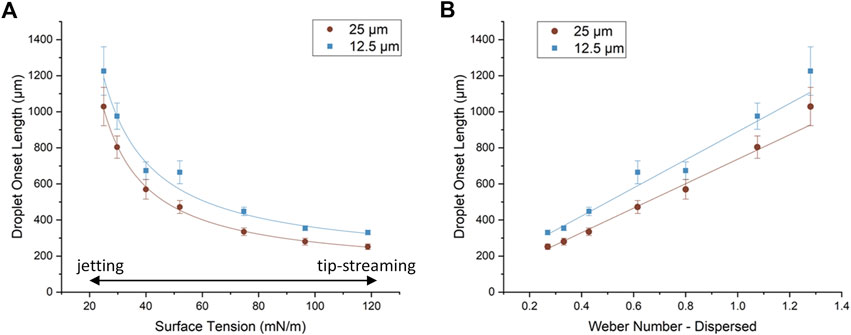
FIGURE 3. Droplet breakup length as a function of (A)
3.2 Pressure
Figure 4 shows that, as expected, the smaller the neck width, the higher the corresponding maximum pressure, characteristic of a higher resistance within the channel given an identical flow rate. Also of note, the total flow rate
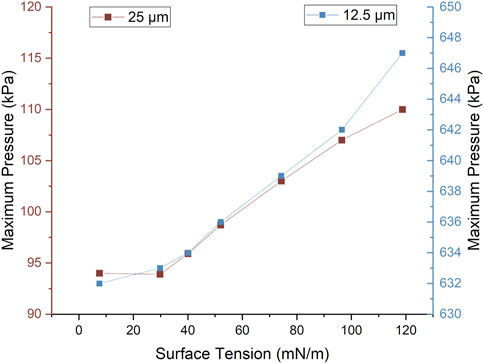
FIGURE 4. Maximum pressure recorded versus
The pressure change (ΔP) trends within Figure 4, which are also present in Figure 8B, correspond rationally to restriction. Features that are known to influence resistance, perceived as ΔP, are length, cross-section, and traversing flow rate [45]. With constant flow rate and length, the reduction of cross-sectional area induces a higher fluidic resistance and displays a higher ΔP.
3.3 Droplet Diameter
The effective droplet diameters as a function of initial surface tension and Weber number are plotted in Figure 5A, B respectively. It should be noted that diameters are derived under the assumption that the measured volume forms a perfectly spherical droplet. As can clearly be seen from Figure 2, for low values of σ0 there is substantial shearing deformation which means that the droplet shape is no longer spherical. However, for ease of comparison to the literature, where droplet diameters (and not volumes) are typically reported, the results here have been analysed under the assumption of spherical symmetry in order to derive an effective diameter using the actual droplet volume determined from simulation.
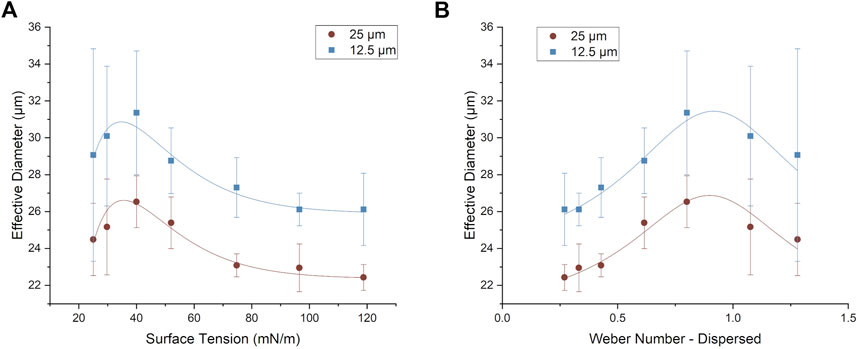
FIGURE 5. Effective droplet diameter as a function of (A) σ0 and (B) Weber number of the dispersed phase (Wed) for the 12.5 and 25 µm neck widths. The effective diameter was calculated based on the assumption of a perfectly spherical droplet whose volume was set to be equivalent to the actual average droplet volume measured from the simulations. The error bars are the standard deviation.
3.4 Dispersity
The degree of polydispersity of the droplets is often characterised in terms of the distribution of the CV. CVs ranging from 3% to 20% were observed for initial surface tensions ranging from 25 to 118.8 mN/m and Weber numbers between 0.25 and 1.26 (Figure 6). The droplet diameter CV appears to follow an approximately linear positive correlation with Weber number. The results also suggest that the variation of polydispersity as a function of Weber number depends on the neck size, i.e. it appears as though polydispersity increases more rapidly with Weber number for the 12.5 μm neck compared to the 25 μm one. This could be due to the presence of stronger breakup forces in the 12.5 μm neck device due to more restricted fluid flow and a lower surface tension limit for droplet formation leading to a larger distribution of droplet sizes.
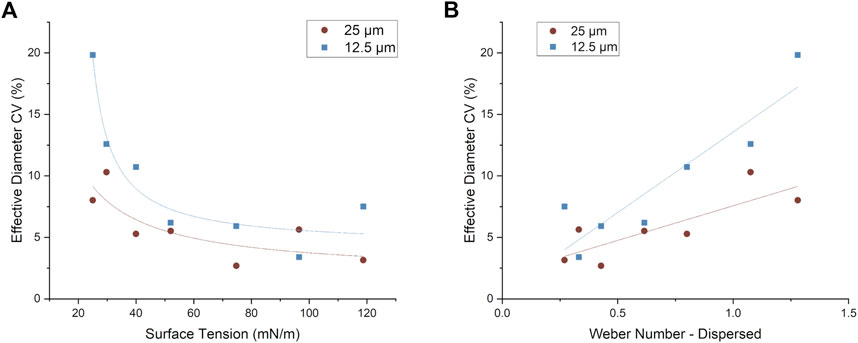
FIGURE 6. Droplet diameter CV plotted as a function of (A) surface tension and (B) Weber number of the dispersed phase (Wed) for the 12.5 and 25 µm neck widths.
For low values of the surface tension and high Wed some instances of groups of droplets undergoing simultaneous breakup were observed. We attribute this to the fact that droplets with a very low initial interfacial surface tension are more prone to destabilisation, particularly by the harmonics associated with the dynamically evolving surface tension (Eq. 8). This observation helps to explain the larger CV values for the diameter at low surface tensions which is particularly obvious for the 12.5 µm neck device.
3.5 Droplet frequency
Figure 7 uses the constant input flow rate of dispersed phase, Qd, divided by the measured droplet volume to obtain the average frequency of droplets. The highest droplet frequency generation (56 kHz) occurs for σ = 118.75 mN/m after which the frequency appears to plateau. In addition, the 25 µm neck geometry appears to consistently result in higher frequency droplet generation compared to the 12.5 µm neck geometry. At a droplet generation frequency of 56 kHz the average droplet size was
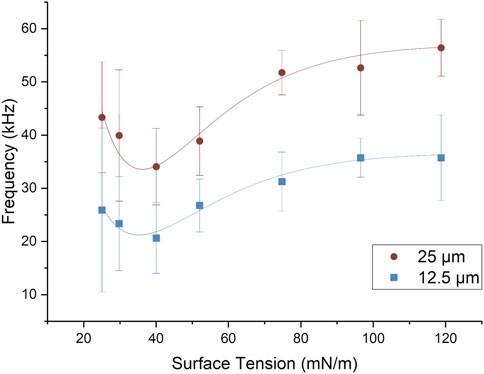
FIGURE 7. Droplet generation as a function of surface tension for both 12.5 and 25 µm neck width models. As expected, for a constant flow rate, the frequency shows an inverse trend to the droplet diameter shown in Figure 5. The error bars are the standard deviation.
We note that it appears from Figure 7 as though a minimum exists in the frequency of droplet generation at around 40 mN/M. This minimum, if confirmed experimentally, may validate the use of novel fluid combinations for achieving high frequency droplet generation, particularly as this value of the surface tension corresponds closely to that of an oil-water interface.
3.6 Influence of neck width
Figure 8 shows the onset length and maximum pressure plotted as a function of the neck width. Note that in the case of the 50 µm neck width, this is equal to the channel width and so effectively the baffle is removed. Additionally, in Figure 8A the standard deviation is abnormally large for the neck width of 31.75 μm in comparison to the other datapoints. The values for the onset length in this case were independently verified via a manual visual inspection of the simulation results and found to be correct. We attribute the much larger spread in onset lengths for this neck width potentially being due to a transition in fluid flow behaviour between the 25 and 37.5 μm neck widths.
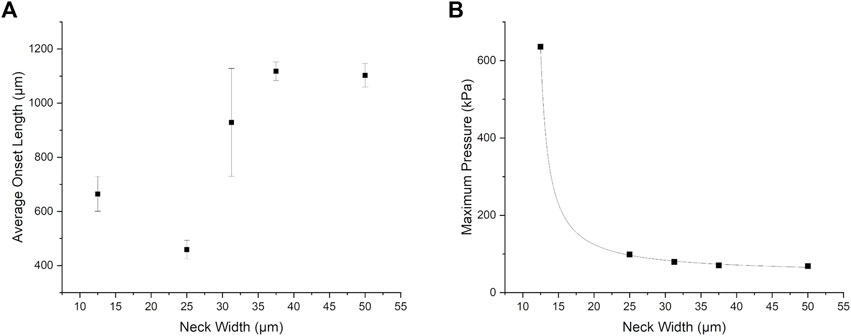
FIGURE 8. (A) Onset length and (B) maximum pressure as a function of neck width corresponding to a surface tension of 52 mN/m. Note that due to the large scatter in the datapoints for onset length no trendline is included. The error bars are the standard deviation.
For Figure 8B there is a dramatic reduction in the maximum pressure associated with droplet formation as a function of increasing neck width and below a neck width of 15 μm the pressure trends rapidly towards infinity, indicating that there may be a blockage of the channels (e.g. as neck width tends to zero). The extreme sensitivity of pressure to the neck width reinforces the inclusion of the baffle as being a critical factor in determining fluid resistance and thus droplet generation.
Figure 9 shows the effective diameter and polydispersity, characterised via the CV, as a function of neck width. Figure 9A shows a steady decrease in the effective droplet diameter as the neck width increases. In terms of polydispersity (Figure 9B) there is a corresponding small decrease, from 6.2% down to around 4.7% in effective diameter CV with increasing neck width. This correlates with an increased ratio of flow rate to neck cross-section increasing the inertial contribution to droplet breakup, which may act to destabilise the droplets. Interestingly, comparing Figure 6A and Figure 9B it appears as though, for the range of neck widths studies that the initial surface tension has a far larger influence on polydispersity then the neck width.
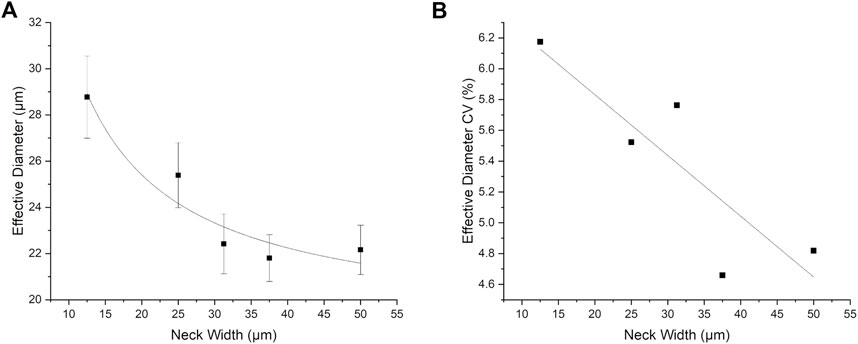
FIGURE 9. (A) Effective droplet diameter and (B) diameter CV plotted as a function of neck width.
As described in the introduction, Figure 8 and Figure 9 are consistent with a transition from a jetting to a tip-streaming regime. For example, as neck width increases, onset length also increases, and droplet size and polydispersity decrease. Overall, Figure 9 suggests that a neck width of around 37 μm may be optimal, under the conditions simulated here, to achieving high frequency droplet generation of small, monodisperse, droplets.
4 Discussion
Using finite element simulation, a range of interfacial surface tensions and geometries have been explored for flow-focusing droplet forming microfluidic devices. In general, the breakup onset lengths observed here are typically longer than previously observed for flow-focusing droplet generators [21, 26, 27] which normally use wider channels. In addition, particularly when using low surface tension values and small neck widths, the droplets formed had a range of non-spherical shapes. The confinement of droplets in in the long, very narrow, outlet channel used here acts to inhibit capillary instabilities [46] such as Rayleigh-Plateau (RP) instabilities which have their growth suppressed with respect to distance but typically cause breakup in open channels. Thus, compared to previous studies using open, or at least, much wider outlet channels than are used here, the breakup length may be expected to be longer. Confinement within a narrow channel also influences the droplet shape. When the surface of the droplets is near a wall, the droplet surface velocity is lowered compared to the bulk of the droplet due to friction. This in turn can lead to the droplet shape becoming non-spherical and would be expected to be particularly apparent in droplets with low surface tension and for very narrow channels—consistent with our observations from simulation.
A further general result from the analysis was that the breakup onset lengths increase, and the maximum pressure decreases as the neck width increases. This is accompanied by an increase in the monodispersity and droplet frequency. Observations of droplets from the simulation suggest that the sudden increase in onset length which occurs for a neck width of 31.25 µm (corresponding to a large CV) appears to occur because of a transition between a shear-dominated jetting mode and a surface tension-dominated jetting mode. This sudden jump may also be influenced by the Re since it seems probable that Re would decrease at the neck section as neck widths increase, and the overall fluid behaviour of the device becomes more like that expected for tip streaming—associated with a larger onset length. Future work will examine this interesting transition between the different regimes in more detail via a finer sampling of channel widths.
Whilst there have been previous studies of droplet generation in flow-focusing devices [9, 21, 42, 47, 48], these have generally used a much lower flow rate to channel cross-section ratio. This results in much lower droplet velocities, which in turn, would make them unsuitable for many sample delivery applications where material needs to be replenished quickly. As a result, the Weber numbers and Reynolds numbers reported here are substantially higher than are typically reported in the literature for flow-focusing microfluidic devices.
4.1 Regimes
Categorising the regime of fluid flow is often a two-step process. Step one is to match the observed flow behaviour with the qualitative flow pattern description of a regime. Step two is to quantitatively verify that match, where possible, by fitting specific parameter values into the same regime. The parameters describing fluid flow are metrics which include capillary number, Weber number, velocity profile, flow rate ratio, and viscosity ratio. Here, we systematically examine the key features of each regime and examine the similarities and differences compared to the observations for our simulated microfluidic devices. Through this systematic process of elimination, we reach the conclusion that only two of the possible regimes (jetting and tip-streaming) provide a reasonable description of our simulated results.
4.1.1 Squeezing
A key feature of the squeezing regime is periodic blockage of the orifice; this was not observed in any of the simulations presented in this paper. In addition, the breakup onset length is far away from the neck, which is another key difference with the squeezing regime. However, the capillary numbers in our simulation for the continuous phase extend down as low as 0.0276 which just overlaps the upper limit reported for the squeezing regime (∼10–2). Overall, while some of the other metrics, do occasionally overlap with the ranges typically associated with the squeezing regime, the lack of any correspondence with the onset features of squeezing indicate that the simulations presented here are not a good match to this regime.
4.1.2 Dripping
The capillary number range for dripping is typically above 10–2 and below jetting which is consistent with our simulations, however the Wed range observed here is only consistent with the dripping regime for initial surface tensions >29.75 mN/m. Similar to squeezing, the breakup onset length for the dripping regime should be very short, comparable to or less than the neck diameter [19], which is far less than the minimum onset length of 252 µm observed in our simulations. In addition, within the dripping regime the droplet diameter should be smaller than the neck [28]. Here, for example, for a neck width of 12.5 µm, depending on the initial surface tension the droplet diameters ranged from 26 to around 31 µm. Another paper describing the characteristics of the dripping regime [49], state that, for a constant inlet width, the droplet diameter corresponds to the inverse of the capillary number. In the present case the two lowest initial surface tension simulations do yield droplet diameters inversely correlated to Cac in the right range for dripping. However, their breakup onset lengths are least matched to the dripping regime and their corresponding Weber numbers are outside of the reported range for dripping. Therefore, we conclude the dripping regime is also not a good model for the present case.
4.1.3 Jetting
In terms of the jetting regime, there are some reports [47] stating that to be within this regime the droplet diameter should be comparable to, or more than twice the diameter of the jet. In our simulations, for the 25 µm neck model the maximum jet diameters are 3 μm, 10 μm, and 3 µm for σ0 = 118.75, 40, and 25 mN/m. This corresponds to effective droplet diameters of 22, 27, and 25 µm. For the same initial surface tension values in the 12.5 µm neck model, the effective droplet diameters were 26, 32, and 29 µm for a constant 3 µm jet diameter. This analysis indicates that the simulations have droplets that are at least twice as large as the jet, meeting this criterion for jetting. Cac is expected to be between 10–2 and 0.5, which is true here. The jetting regime is also associated with comparatively large polydispersity. In the present case, all CV values are below 20%, with the majority <10%. However a trend in CV growth with Cac is also observed here, which might suggest the simulations are in a regime where there is a transition from the dripping regime into the jetting regime. Features which are clearly not consistent with jetting in our simulations include the fact that the droplet diameter to onset breakup length in this regime is expected to be constant whereas in the current simulations it varies from 4% at low capillary numbers to 11% at high capillary numbers.
4.1.4 Tip-streaming
The tip-streaming regime has been associated with a conically shaped interface forming at the junction between the continuous and dispersed phase. In our simulations the junctions are consistent with these observations as they are all cone like. In addition, another qualitative feature of tip-streaming is that the jets should be “slim” and round in cross-section; again, this is consistent with the observations from the simulation data. Acceptable values of Cac for tip-streaming are above 0.5 which is not consistent with the present simulations. It is also expected that in the tip-streaming regime the droplets generated are monodisperse, microscopic in size, and spherical. In terms of droplet diameter, the rage of droplet diameters observed here which are all <32 µm clearly qualify as microscopic. In the majority of cases as well CV values are <10% which, by comparison with the literature, meets the criteria for being monodisperse (although a few simulation conditions did produce CV values closer to 20%). The model simulations associated with a lower Wed also produce highly spherical droplets. So a significant number of our simulations meet all three qualitative criteria for tip-streaming.
In terms of quantitative metrics, however, the Reynolds numbers here are significantly higher than have typically been reported for tip-streaming. Here, the Reynolds numbers are approximately constant in our simulations at around Red = 40.0 and Rec = 17.4 for the dispersed and continuous phases respectively. Normally, for tip-streaming it is reported that both Red and Rec are less than 1 and so this is a significant departure from what would be expected for this regime. The tip-steaming regime also bounds itself to the condition that the velocity difference across the interface between the phases, ΔV, is negligible. In our simulations a visual comparison of the velocity profiles shown in Figure 10 indicates that ΔV is negligible for σ0 = 25 mN/m model and a 25 µm neck width, but when σ0 = 118.75 mN/m, ΔV ∼ 15–30%, which may not meet the criteria of being “negligible”. Overall, if one neglects the unusually high Re, the regime simulated here thus seems to match quite closely the tip-streaming regime in the majority of cases simulated.
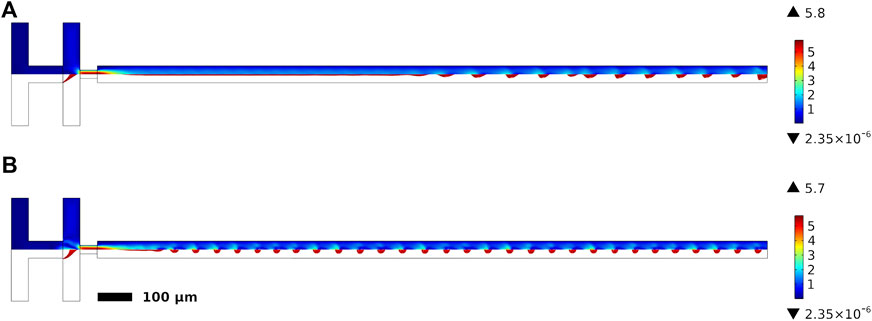
FIGURE 10. Velocity profiles for two simulations, the colour scale indicates the velocity in m/s. The bottom half of each profile is an isosurface render showing the droplets generated. Velocity profile of the (A) σ0 = 25 mN/m simulation and (B) σ0 = 118.75 mN/m with a 25 µm neck width.
4.1.5 Tip-multi-breaking
Tip-multi-breaking is associated with a viscosity ratio, λ, that is much less than 1. Here λ is 0.24, so it may be at the limit of this regime, depending on the exact switching value. Another qualitative feature of tip-multi-breaking is that periodic variations in droplet size are typically reported which was not present in this study.
Quantitatively, either the capillary number must be lower than a critical value (reported as being between 0.2 and 0.8) or the ratio of dispersed fluid to continuous fluid flow rate, Qd/Qc, must be much less than unity. These two conditions are not intended to apply simultaneously. For our simulations, Cac varies from 0.027 to 0.13, and so these values satisfy the reported range of tip-multi-breaking. However, the ratio Qd/Qc used here of 0.2 is not much less that unity. Therefore, from both a qualitative and quantitative standpoint it is unlikely that the simulations reported on here lie within this regime.
4.2 Summary
Classifying the observed fluid flow behaviour for our flow focusing microfluidic droplet generators is useful, both from the standpoint of predicting their properties for situations that extend beyond those simulated in the present paper, but also because they facilitate a direct comparison with the published literature. In the present case, the majority of analysis points to the fact that the microfluidic devices we have simulated here lie at the interesting interface of two (or potentially more) different regimes. Broadly speaking, the regimes most closely aligned with the fluid flow behaviour of our simulations are the jetting regime and the tip-streaming regime. Although, as discussed, the Reynolds numbers in the present case are larger than is typically observed for these two modes of fluid flow. Since the geometry and conditions investigated here have not been previously simulated in detail over the range of surface tensions included in this study it appears that these characteristics have not been reported on previously.
5 Conclusion
The interfacial surface tension was varied in a simulated flow-focusing geometry with a square cross-section and analysis of the key features of the simulation was performed. Comparing the model characteristics with those reported in the literature for the different fluid flow regimes, it was determined that jetting and tip streaming, best describe the model behaviour. The focus of the present study was on high-frequency formation of small droplets with low polydispersity. This resulted in an unusually high ratio for the total flow rate to channel width. By probing the effects of interfacial surface tension over a much larger range then previously reported we found that, surprisingly, a standard water/oil mixture is the least suited to high frequency droplet generation. The highest frequency of droplets was found to be 56 kHz observed for a surface tension of 118.75 mN/m. This had low polydispersity (CV was just 3.1%) and a comparatively small droplet diameter of 22 µm. The geometrical effect of varying the neck width was also examined. By optimising the neck width, a value of 37.5 µm for the neck was observed to result in a droplet generation frequency of 61 kHz and a surface tension of 52 mN/m.
Having completed a comprehensive suite of simulations, the results of this study will now be used to guide future work confirming these observations in experiment. Previous studies investigating the influence of surfactants in inkjet printing have revealed that the distribution of surfactant at the droplet interface may be inhomogeneous [39]. Although the range of surface tensions investigated in this earlier study was different to the present study, changes in surfactant concentration before, during, and after droplet formation could potentially have a significant influence on droplet behaviour in the present case. An extrapolation of the results between the 37.6 and 25 µm necks for surface tension values between 52 and 118.75 mN/m, indicates that droplet frequencies approaching 90 kHz whilst maintaining small droplet size and low polydispersity, should be readily achievable, although it remains to be tested whether this could be replicated in experiment.
Data availability statement
The original contributions presented in the study are included in the article/Supplementary material, further inquiries can be directed to the corresponding authors.
Author contributions
All authors contributed to the manuscript. MS developed the simulations and performed the data analysis. BA and EB conceived the initial idea and supervised the project.
Funding
The funding was provided by Australian Research Council (Grant No. CE140100011).
Conflict of interest
The authors declare that the research was conducted in the absence of any commercial or financial relationships that could be construed as a potential conflict of interest.
Publisher’s note
All claims expressed in this article are solely those of the authors and do not necessarily represent those of their affiliated organizations, or those of the publisher, the editors and the reviewers. Any product that may be evaluated in this article, or claim that may be made by its manufacturer, is not guaranteed or endorsed by the publisher.
References
1. Hejazian M, Darmanin C, Balaur E, Abbey B. Mixing and jetting analysis using continuous flow microfluidic sample delivery devices. RSC Adv (2020) 10(27): 15694–15701.
2. Hejazian M, Balaur E, Abbey B. Recent advances and future perspectives on microfluidic mix-and-jet sample delivery devices. Micromachines (2021) 12(5):531. doi:10.3390/mi12050531
3. Niculescu AG, Chircov C, Bîrcă AC, Grumezescu AM. Fabrication and applications of microfluidic devices: A review. Int J Mol Sci (2021) 22(4):2011. doi:10.3390/ijms22042011
4. Amoyav B, Benny O. Controlled and tunable polymer particles’ production using a single microfluidic device. Appl Nanosci (2018) 8(4):905–14. doi:10.1007/s13204-018-0790-0
5. Clabbers MTB, Holmes S, Muusse TW. MyD88 TIR domain higher-order assembly interactions revealed by microcrystal electron diffraction and serial femtosecond crystallography. Nat Commun. (2021) 12:2578.
6. Nelson G, Kirian RA, Weierstall U, Zatsepin NA, Faragó T, Baumbach T, et al. Three-dimensional-printed gas dynamic virtual nozzles for x-ray laser sample delivery. Opt Express, OE (2016) 24(11):11515–30. doi:10.1364/oe.24.011515
7. Monteiro DCF, Vakili M, Harich J, Sztucki M, Meier SM, Horrell S, et al. A microfluidic flow-focusing device for low sample consumption serial synchrotron crystallography experiments in liquid flow. J Synchrotron Rad (2019) 26(2):406–12. doi:10.1107/s1600577519000304
8. Shim J, Ranasinghe RT, Smith CA, Ibrahim SM, Hollfelder F, Huck WTS, et al. Ultrarapid generation of femtoliter microfluidic droplets for single-molecule-counting immunoassays [internet]. ACS Publications. American Chemical Society (2013). [cited 2022 Mar 22]. Available from: https://pubs.acs.org/doi/pdf/10.1021/nn401661d (Accessed May 31, 2022).
9. Paiboon N, Surassmo S, Ruktanonchai UR, Soottitantawat A. Hydrodynamic control of droplet formation in narrowing jet and tip streaming regime using microfluidic flow-focusing. Int J Multiphase Flow (2022) 150:104013. doi:10.1016/j.ijmultiphaseflow.2022.104013
10. Echelmeier A, Sonker M, Ros A. Microfluidic sample delivery for serial crystallography using XFELs. Anal Bioanal Chem (2019) 411(25):6535–47. doi:10.1007/s00216-019-01977-x
11. Oleksandr Y, Dominik O, Richard B, Max OW Juraj K, Gisel P. Evaluation of serial crystallographic structure determination within megahertz pulse trains. Struct Dyn (2019) 6(25):064702.
12. Holmes S, Kirkwood HJ, Bean R. Megahertz pulse trains enable multi-hit serial femtosecond crystallography experiments at X-ray free electron lasers. Nat Commun (2022) 13:4708.
13. Darmanin C, Strachan J, Adda C. crystal screening and characterization for serial femtosecond nanocrystallography. Sci Rep (2016) 6:25345.
14. Hejazian M, Balaur E, Abbey B. A numerical study of sub-millisecond integrated mix-and-inject microfluidic devices for sample delivery at synchrotron and XFELs. Appl Sci (2021) 11(8):3404. doi:10.3390/app11083404
15. Zhu P, Wang L. Passive and active droplet generation with microfluidics: A review. Lab Chip (2016) 17(1):34–75. doi:10.1039/c6lc01018k
16. Srikanth S, Raut S, Dubey SK, Ishii I, Javed A, Goel S. Experimental studies on droplet characteristics in a microfluidic flow focusing droplet generator: Effect of continuous phase on droplet encapsulation. Eur Phys J E (2021) 44(8):108. doi:10.1140/epje/s10189-021-00115-9
17. Srikanth S, Dubey SK, Javed A, Goel S. Droplet based microfluidics integrated with machine learning. Sensors Actuators A: Phys (2021) 332:113096. doi:10.1016/j.sna.2021.113096
18. Han W, Chen X. A review on microdroplet generation in microfluidics. J Braz Soc Mech Sci Eng (2021) 43(5):247. doi:10.1007/s40430-021-02971-0
19. Guerrero J, Chang YW, Fragkopoulos AA, Fernandez-Nieves A. Capillary-based microfluidics—coflow, flow-focusing, electro-coflow, drops, jets, and instabilities. Small (2020) 16(9):1904344. doi:10.1002/smll.201904344
20. Lee W, Walker LM, Anna SL. Role of geometry and fluid properties in droplet and thread formation processes in planar flow focusing. Phys Fluids (2009) 21(3):032103. doi:10.1063/1.3081407
21. Soroor M, Zabetian Targhi M, Tabatabaei SA. Numerical and experimental investigation of a flow focusing droplet-based microfluidic device. Eur J Mech - B/Fluids (2021) 89:289–300. doi:10.1016/j.euromechflu.2021.06.013
22. Du J, Ibaseta N, Guichardon P. Generation of an O/W emulsion in a flow-focusing microchip: Importance of wetting conditions and of dynamic interfacial tension. Chem Eng Res Des (2020) 159:615–27. doi:10.1016/j.cherd.2020.04.012
23. Bai F, He X, Yang X, Zhou R, Wang C. Three dimensional phase-field investigation of droplet formation in microfluidic flow focusing devices with experimental validation. Int J Multiphase Flow (2017) 93:130–41. doi:10.1016/j.ijmultiphaseflow.2017.04.008
24. Mastiani M, Seo S, Riou B, Kim M. High inertial microfluidics for droplet generation in a flow-focusing geometry. Biomed Microdevices (2019) 21(3):50. doi:10.1007/s10544-019-0405-x
25. Peng L, Yang M, Guo S, Liu W, Zhao XZ. The effect of interfacial tension on droplet formation in flow-focusing microfluidic device. Biomed Microdevices (2011) 13(3):559–64. doi:10.1007/s10544-011-9526-6
26. Sartipzadeh O, Naghib SM, Seyfoori A, Rahmanian M, Fateminia FS. Controllable size and form of droplets in microfluidic-assisted devices: Effects of channel geometry and fluid velocity on droplet size. Mater Sci Eng C (2020) 109:110606. doi:10.1016/j.msec.2019.110606
27. Gyimah N, Scheler O, Rang T, Pardy T. Digital twin for controlled generation of water-in-oil microdroplets with required size. In: Proceeding of the 2022 23rd International Conference on Thermal, Mechanical and Multi-Physics Simulation and Experiments in Microelectronics and Microsystems (EuroSimE); April 2022; St Julian, Malta. IEEE (2022). p. 1–7.
28. Rahimi M, Shams Khorrami A, Rezai P. Effect of device geometry on droplet size in co-axial flow-focusing microfluidic droplet generation devices. Colloids Surf A: Physicochemical Eng Aspects (2019) 570:510–7. doi:10.1016/j.colsurfa.2019.03.067
29. Zhang F, Erriguible A, Gavoille T, Timko MT, Marre S. Inertia-driven jetting regimes in microfluidic coflows. Phys Rev Fluids (2018) 3(9):092201. doi:10.1103/physrevfluids.3.092201
30. Anna SL, Bontoux N, Stone HA. Formation of dispersions using “flow focusing” in microchannels. Appl Phys Lett (2003) 82(3):364–6. doi:10.1063/1.1537519
31. Sontti SG, Atta A. Numerical insights on controlled droplet formation in a microfluidic flow-focusing device. Ind Eng Chem Res (2020) 59(9):3702–16. doi:10.1021/acs.iecr.9b02137
32. Chen Q, Li J, Song Y, Chen B, Christopher DM, Li X. Pressure-driven microfluidic droplet formation in Newtonian and shear-thinning fluids in glass flow-focusing microchannels. Int J Multiphase Flow (2021) 140:103648. doi:10.1016/j.ijmultiphaseflow.2021.103648
33. Ong WL, Hua J, Zhang B, Teo TY, Zhuo J, Nguyen NT, et al. Experimental and computational analysis of droplet formation in a high-performance flow-focusing geometry. Sensors Actuators A: Phys (2007) 138(1):203–12. doi:10.1016/j.sna.2007.04.053
34. Majid H, Eugeniu B, Leonie F, Lilian H, Connie D, Brian A. “Microfluidic mixing and jetting devices based on SU8 and glass for time-resolved molecular imaging experiments, ” in Proc. SPIE 10875, microfluidics, bioMEMS, and medical microsystems XVII. (2019) 108750D.
35. Daniel L, Brian A. “Rapid microfluidic mixing and liquid jets for studying biomolecular chemical dynamics,” Proc. SPIE 10456, nanophotonics Australasia 2017 (2018) 1045648.
36. Anna SL, Mayer HC. Microscale tipstreaming in a microfluidic flow focusing device. Phys Fluids (2006) 18(12):121512. doi:10.1063/1.2397023
37. Zhu P, Kong T, Kang Z, Tian X, Wang L. Tip-multi-breaking in capillary microfluidic devices. Scientific Rep (Nature Publ Group) (2015) 5:11102. doi:10.1038/srep11102
38. Liu Y, Li Y, Hensel A, Brandner JJ, Zhang K, Du X, et al. A review on emulsification via microfluidic processes. Front Chem Sci Eng (2020) 14(3):350–64. doi:10.1007/s11705-019-1894-0
39. Antonopoulou E, Harlen OG, Rump M, Segers T, Walkley MA. Effect of surfactants on jet break-up in drop-on-demand inkjet printing. Phys Fluids (2021) 33(7):072112. doi:10.1063/5.0056803
40. Xu JH, Dong PF, Zhao H, Tostado CP, Luo GS. The dynamic effects of surfactants on droplet formation in coaxial microfluidic devices. Langmuir (2012) 28(25):9250–8. doi:10.1021/la301363d
41. Baret JC, Kleinschmidt F, El Harrak A, Griffiths AD. Kinetic aspects of emulsion stabilization by surfactants: A microfluidic analysis. Langmuir (2009) 25(11):6088–93. doi:10.1021/la9000472
42. Kalli M, Angeli P. Effect of surfactants on drop formation flow patterns in a flow-focusing microchannel. Chem Eng Sci (2022) 253:117517. doi:10.1016/j.ces.2022.117517
43. Furlani EP. Temporal instability of viscous liquid microjets with spatially varying surface tension. J Phys A: Math Gen (2004) 38(1):263–76. doi:10.1088/0305-4470/38/1/020
44. Shinbrot T. Biomedical fluid dynamics: Flow and form. Oxford, UNITED KINGDOMIncorporated: Oxford University Press (2019). [Internet][cited 2022 Sep 19]. Available from: http://ebookcentral.proquest.com/lib/latrobe/detail.action?docID=5742035 (Accessed Oct 19, 2022).
45. Panigrahi PK. Transport phenomena in microfluidic systems. Singapore, SINGAPOREIncorporated: John Wiley & Sons (2016). [Internet][cited 2022 Sep 25]. Available from: http://ebookcentral.proquest.com/lib/latrobe/detail.action?docID=4179320 (Accessed Oct 25, 2022).
46. Montanero JM, Gañán-Calvo AM. Dripping, jetting and tip streaming. Rep Prog Phys (2020) 83(9):097001. doi:10.1088/1361-6633/aba482
47. Wu T, Luo Z, Ding W, Cheng Z, He L. Monodisperse droplets by impinging flow-focusing. Microfluid Nanofluid (2017) 21(8):129. doi:10.1007/s10404-017-1966-8
48. Deng C, Wang H, Huang W, Cheng S. Numerical and experimental study of oil-in-water (O/W) droplet formation in a co-flowing capillary device. Colloids Surf A: Physicochemical Eng Aspects (2017) 533:1–8. doi:10.1016/j.colsurfa.2017.05.041
Keywords: microfluidics, flow focusing, droplet breakup, interfacial tension, finite element, sample delivery
Citation: Stevens M, Balaur E and Abbey B (2023) Computational simulation of the effects of interfacial tension in microfluidic flow focusing droplet generators. Front. Phys. 11:1060780. doi: 10.3389/fphy.2023.1060780
Received: 04 October 2022; Accepted: 27 January 2023;
Published: 09 February 2023.
Edited by:
Alexander Alexeev, Georgia Institute of Technology, United StatesReviewed by:
Anton Bukatin, Saint Petersburg Academic University (RAS), RussiaWenbin Mao, University of South Florida, United States
Copyright © 2023 Stevens, Balaur and Abbey. This is an open-access article distributed under the terms of the Creative Commons Attribution License (CC BY). The use, distribution or reproduction in other forums is permitted, provided the original author(s) and the copyright owner(s) are credited and that the original publication in this journal is cited, in accordance with accepted academic practice. No use, distribution or reproduction is permitted which does not comply with these terms.
*Correspondence: Eugeniu Balaur, ZS5iYWxhdXJAbGF0cm9iZS5lZHUuYXU=; Brian Abbey, Yi5hYmJleUBsYXRyb2JlLmVkdS5hdQ==