- 1School of Information and Communication Engineering, Beijing Information Science & Technology University, Beijing, China
- 2Key Laboratory of Modern Measurement & Control Technology, Ministry of Education, Beijing Information Science & Technology University, Beijing, China
- 3State Key Laboratory of Networking and Switching Technology (Beijing University of Posts and Telecommunications), Beijing, China
- 4Key Laboratory of Information and Communication Systems, Ministry of Information Industry, Beijing Information Science and Technology University, Beijing, China
In the field of complex network research, complex network information transmission models based on infectious disease models are often used to study the mechanism of information transmission. This is helpful for the prediction of information transmission trends and the formulation of control strategies. However, the classification of node types in traditional information transmission models is too simple and cannot reflect the characteristics of each node. To solve the above problems, this study proposes a layered SITR complex network information transmission model. The model is layered according to the influence of nodes, and rational propagator nodes are added to optimize it. The propagation threshold of the model is deduced theoretically and the stability of the model is proved. To reduce the dissemination scale of the network’s public opinion information, an optimal control strategy is proposed based on the Pontryagin maximum principle to optimize the information dissemination process. Finally, combined with real events from social network platform, the simulation results show that the layered SITR model can describe the process of network information dissemination more accurately, and the optimal control strategy can effectively reduce the dissemination scale of the network’s public opinion information.
1 Introduction
With the development and progress of Internet technology, a variety of online social platforms has enriched the ways people use to exchange information, but they have also accelerated the spread of online rumors. When false and malicious information spreads on a large scale, it triggers heated discussions among netizens, thus resulting in many online public opinions, which will have a negative impact on social stability and economic development. Because of the high similarity between network information and virus transmissions, researchers have begun to combine the structural characteristics of information networks to apply complex networks and infectious disease models to the field of information transmission and simulate the process of information transmission in social networks based on mathematical models [1]. Therefore, it is of great practical significance to establish an information transmission model for realistic scenarios based on infectious disease models and complex networks, analyze and study the mechanism of information transmission, and formulate specific prevention and control strategies.
At present, numerous achievements have been accomplished in the research of infectious disease models in the field of information transmission. Among them, Kermack and McKendrick proposed the most classic infectious disease model in 1927, that is, the susceptible-infected-recovered (SIR) model [2]. Subsequently, scholars proposed various optimized models of infectious diseases on this basis and studied the mechanism of information transmission [3–6]. Based on a simple susceptible-infected-susceptible (SIS) model, Wang et al. innovatively established an ESIS information transmission model based on emotion weighting, which weighted different links according to user emotions, effectively improving the accuracy of the model [7]. Based on the traditional SIRS model, Wang et al. proposed the SPIRS model with potential propagation nodes and applied it to different real networks, thus indicating that the number of potential nodes can predict the peak of information propagation [8]. After the introduction of the time-varying rate of immune loss in the SIRS model, Shaji et al. proposed a new SIRS model and conducted simulation verification on an artificial network [9]. Zhao et al. proposed the SIHR social network information transmission model and added hibernation nodes to the model to study the mechanism of forgetting and memory associated with the process of information transmission. The results showed that nodes with a hibernation state can reduce the overall impact of rumors [10].
Owing to the continuous progress of communication technology, the abilities associated with the reception and spreading of information are not identical and the individual network user nodes are influenced by many factors that lead to a complicated propagation behavior mechanism. Thus, single information propagation models cannot accurately describe the information in the network transmission process. Accordingly, scholars have established a complex network of multilayer information dissemination model to solve these problems effectively. These efforts have rendered the multilayer information transmission model the hot spot of current research. In a multilingual environment, Li et al. stratified the infectious disease model based on whether people transmitted information through their first or second languages, improved the information exchange mechanism between layers, and established a stratified ISR model [11]. Yagan et al. improved the information transmission mechanism based on the characteristics of the SIR virus transmission model and established a social–physical, two-layer network information diffusion model to explore the occurrence of the seepage effect in multilayer networks [12]. Scholars divide the model into consciousness layer and propagation layer and study the influence of consciousness on propagation dynamics. Wang et al. stratified the transmission channels of viruses in the network into consciousness and viral transmission layers, so as to establish the hierarchical transmission model of virus and information, and studied the impact of information on viral transmission [13]. Wu et al. proposed an aware-susceptible-infected model (ASI) to explore the effect of awareness on the spreading process in multiplex networks. Experiment found that epidemic information can help to suppress the epidemic diffusion only when individuals’ abilities of transforming awareness into actual protective behaviors attain a threshold [14]. Li et al. built a dynamic model to describe the transmission of two competing complex information, in which individuals in the network can only accept one of the two messages. The results show that the heterogeneity of the distribution of multiple network degrees has no qualitative influence on the results [15]. Although scholars have conducted in-depth studies on the multilayer information transmission model in recent years, the node types are very limited and cannot accurately describe the influence of various nodes in the network on information transmission.
To make the model reflect the process of information transmission more accurately, scholars have enriched the nodal types in the network according to the characteristics of information transmission. Jiang et al. added the truth disseminator node in the model, established a two-stage SPNR rumor propagation model, and studied the influence of official information on online rumor propagation [16]. Wang et al. established the 2SI2R model by considering the simultaneous spread of two types of rumors in the population [17]. Sang et al. proposed a SFTRD information transmission model based on heterogeneous network, added controlled nodes into the model, and studied the information transmission process combined with optimal control theory [18]. Zhu considered the influence of the user’s psychological state on information dissemination when facing major public opinions, classified nodes according to different attitudes associated with believing and resisting public opinions, and established the SBD (Susceptible–Believed–Denied) public opinion dissemination model [19]. Li et al. proposed a UAU-SIS information transmission model and conducted simulations in a network composed of a static information transmission network and temporal physical network to study the influence of spatiotemporal characteristics on information transmission [20]. Zhao et al. improved the SEIV information transmission model by introducing vigilance nodes to improve the SEIR model and solved the information transmission control problem by using a group-based stochastic optimization strategy, effectively improving the accuracy of the model [21].
The traditional model has two major limitations: The division of the SIRS model of node state is relatively simple, all the nodes in the model have the same properties, part of the connection among the nodes are ignored, and the network users in the situation differ markedly with reality. Especially in the process of public opinion communication, different communicators have different groups of people in contact, and the influence of communicator groups is also different. Therefore, the model needs to be considered stratified according to node influence. In addition, in the traditional SIRS model, only communicators can influence susceptible people. However, in practice, communicators have different attitudes toward public opinion events. Thus, they also influence each other. Therefore, we propose the layered SITR (L-SITR) model to solve the above problems.
This paper discusses the emergency in the Sina Weibo information dissemination process and proposes the L-SITR model. According to the different number of neighbors of nodes, information propagators are divided into influential propagator node and normal propagator node, and the rational propagator node is added to represent the information dissemination of rational thinking to spread the correct information of nodes. The mechanism of influential propagators and rational guidance are established to make the model more appropriate to the actual situation. Through the dynamic analysis of the L-SITR model, the propagation threshold of the model is theoretically solved, and the stability of the equilibrium point is proved [22–25], and the optimal control problem of information propagation is solved using Pontryagin’s maximum principle. Our main contributions of this work can be listed as follows:
(1) Considering the differences between nodes in the network, the complexity of node behaviors and the different attitudes of communicators toward public opinion information, rational propagator nodes were added to the study and a new L-SITR information dissemination model was proposed in accordance with optimization of the traditional SIRS model.
(2) The propagation threshold of the L-SITR model was calculated using the reproduction matrix method, and the stability of the model was proved according to the Routh–Hurwitz criterion and Lyapunov methods.
(3) The traditional SIRS and proposed L-SITR models were simulated using the data obtained from Sina Weibo and the performances of the different models were compared and evaluated using the least-squares criterion.
(4) The information transmission process of the L-SITR model was optimized and an optimal control strategy was proposed for the information transmission process according to the maximum principle of Pontryagin.
The organization of this paper is as follows. Section 2 is the L-SITR model formulation and preliminaries. In Section 3, the information propagation threshold of L-SITR model was determined by dynamic analysis, and the stability of equilibrium point was proved. In Section 4, the optimal control strategy for network information is introduced and analyzed theoretically. In Section 5, the simulation results are given and discussed. Finally, conclusions are presented in Section 6.
2 L-SITR information propagation model
We proposed the L-SITR model to study the dissemination process of emergency information on the network platform under the scenario of government intervention. The L-SITR model is shown in Figure 1. This model divides network nodes in five categories: uninformed persons
On the basis of the original transmission mechanism of traditional SIRS model, this paper adds the transmission mechanism of influential propagators and rational guidance mechanism. The mechanism of influential propagators refers to that the uninformed person
L-SITR model can be expressed by the following dynamic equation,
where N is the total number of nodes,
To simplify the analysis process, this study assumes that the total population remains constant, that is,
3 The basic reproduction number and stability analysis
In this section, the next generation matrix method was used to calculate the basic reproduction number of the L-SITR model, namely the propagation threshold and to prove the global stability of the no information equilibrium and information equilibrium of the model, respectively.
The basic reproduction number refers to the expected number of secondary infections caused by an infected in an environment full of susceptible people during the disease cycle. For information propagation model, the basic regeneration number is the threshold of information propagation. Firstly, we study the basic reproduction number of model 1) through the next generation matrix method.
Because the actual number of nodes in the information transmission model cannot be negative, so the number of nodes in the model presented in this study is as follows,
Let
Where
At the no information equilibrium point
Thus, we can calculate the basic regeneration number of the regeneration matrix
The stability of the no information equilibrium point is detailed in Theorem 2. According to the expression of the propagation threshold
Theorem 1
The no information equilibrium
By substituting
In order to simplify the calculation process, we set:
As
The characteristic polynomial of matrix 12) is,
where
Because
According to the Routh–Hurwitz stability criterion [29], when
Theorem 2
If
The full differential equation of
When
In the next theorem, we will prove the stability of the information equilibrium point.
Theorem 3
If
Substituting Eq. 19 into Eq. 11, we obtain,
According to the Routh–Hurwitz stability criterion, when
Theorem 4
If
Because we assumes that the total population remains constant, that is,
The derivative of
When
4 Optimal control strategy
This section discusses the influence of optimal control on the L-SITR model with control measures, as shown in Eq. 23. As the government continues to report the truth, it will effectively increase the probability of the uninformed becoming the recovered person, assuming that the probability of the uninformed becoming the recovered person increases by
The purpose of public opinion control is to reduce the number of propagators and the cost of public opinion management as much as possible during public opinion propagation. Let the cost of public resource consumption caused by the propagator be proportional to the number of propagators with the proportional coefficients being equal to
The objective function is set as [31]:
Using Pontryagin’s maximum principle, we attempted to find the optimal control for
The Hamiltonian function for the control problem can be described as,
where
According to the results obtained by Panja [32] and the Pontryagin’s maximum principle, the following theorem applies.
Theorem 5
There is an optimal control strategy
.It can be obtained with calculations that
From the characteristics of the control variable that
We can obtain optimal control variable
5 Numerical example
MATLAB was used to conduct the simulations. In this section, the accuracy of the L-SITR model is verified by an example simulation and the influence of the interference strategy on each node in the model was studied. The “backward–forward sweep method” was used to solve the optimal control problem, and the fourth-order Runge-Kutta method was used to calculate the numerical solution of L-SITR [33–35]. In this method, the equation of state of the model was solved forward in time, the equation was solved backward in time, the value of the control variable was constantly updated, and the process was repeated until convergence.
5.2 Propagation threshold and stability verification
5.2.1 Stability of no information equilibrium (
We set the parameters of the L-SITR model as
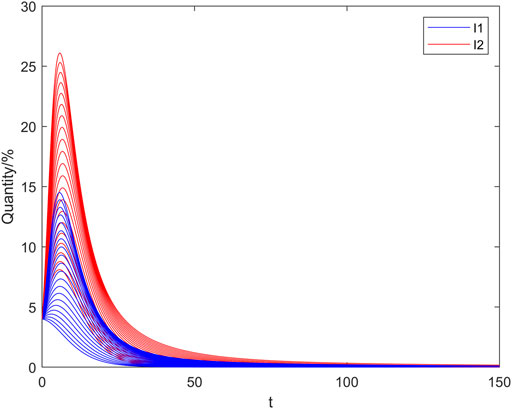
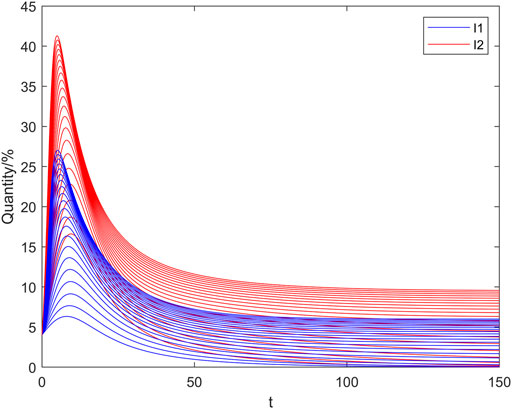
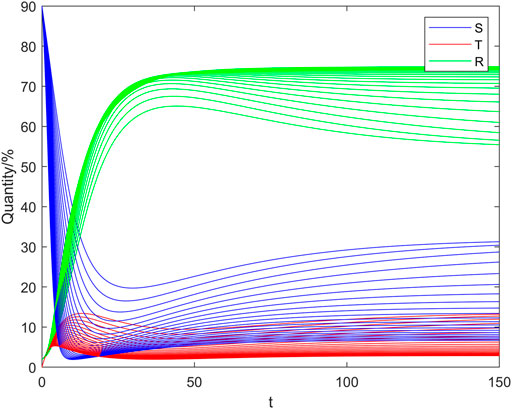
In Figure 2 and Figure 3 the horizontal and vertical coordinates represent the time step and the quantity of nodes, respectively. From Figure 2 we observe that when
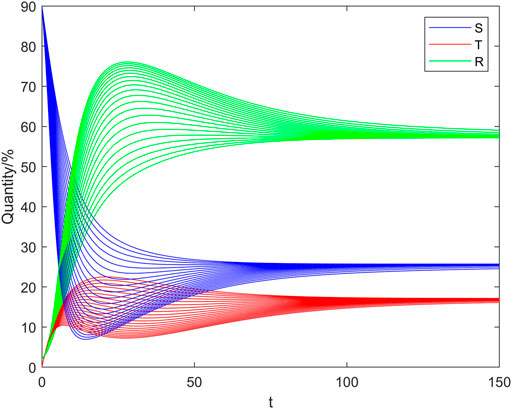
From Figure 3 we observe that when
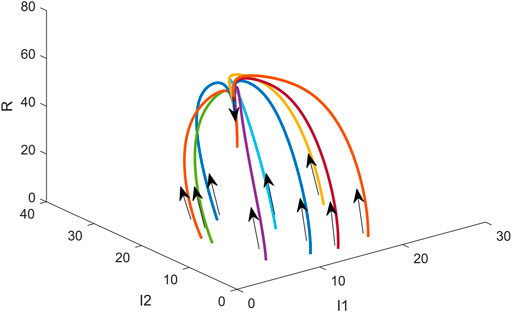
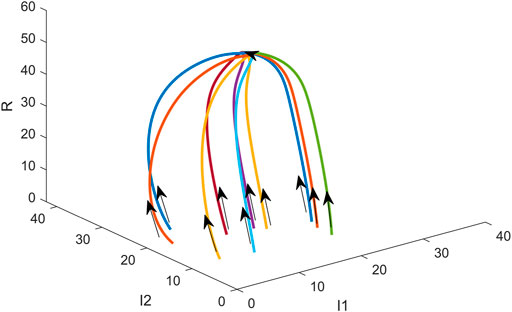
In Figure 4, the x-axis represents the proportion of normal propagator nodes (%), the y-axis represents the proportion of influential propagator nodes (%), and the z-axis represents the proportion of immune nodes (%). We randomly generated ten groups of different initial node proportions and conducted ten simulations respectively. Curves of different colors in the figure represent the changes in the number of nodes of the normal propagator, influential propagator, and temporal variation of immunity at different initial proportions of different types of nodes. Irrespective of how different the initial proportions of nodes of different types are in the case in which
5.2.2 Stability of information equilibrium (
We set the parameters of the L-SITR model as
In Figure 5 and Figure 6 the horizontal and vertical coordinates represent the time step and the quantity of nodes, respectively. Figure 5 shows that when
From Figure 6 we observe that when
In Figure 7, the x-axis represents the proportion of normal propagator nodes (%), the y-axis represents the proportion of influential propagator nodes (%), and the z-axis represents the proportion of immune nodes (%). We randomly generated ten groups of different initial node proportions and conducted ten simulations respectively. Curves of different colors in the figure represent the changes in the number of nodes of the normal propagators, influential propagators and temporal variation of immunity at different initial proportions of different types of nodes. In the case in which
5.3 Real case verification
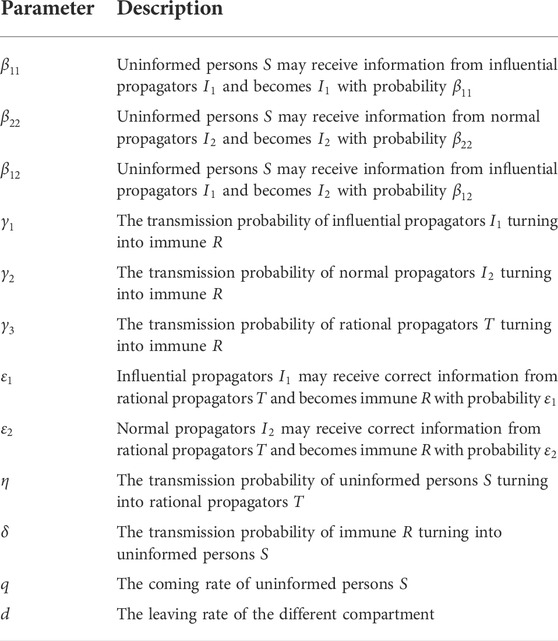
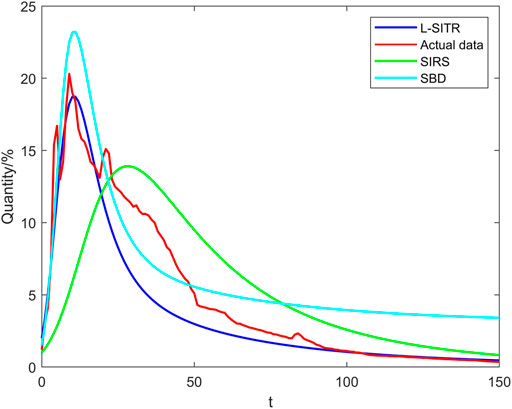
We mainly selected some real data of “old man died by falling over a dog leash” on the official platform of Sina Weibo for the experiment. The earliest information about the incident began to spread on the Internet platform at 9:00 on 18 August 2020, which aroused wide attention and a large number of comments and forwarding on the topic of dog management and the safety of the elderly. The number of forwarding reached the peak at 22:00 in the evening, and then the number of comments and forwarding gradually decreased. The discussion on the event ended at 8:00 on August 24. It is worth noting that in this event, some articles published by official media discussed the legal issues behind the accident, guided netizens to think rationally, provided ideas for improving relevant laws and regulations, promoted the rapid end of public opinion caused by the emergency, and reduced the negative impact caused by public opinion. According to the real data of “Jiang Yi Yan” event, we have established a network with 72,000 nodes, among which the nodes are users who pay attention to that event. The average degree of the nodes in the network is about 24.76. MATLAB was used in the cases of the L-SITR simulation model, SBD model [18] and the traditional SIRS model, and outcomes were compared with real data, as shown in Figure 8. The proportions of uninformed persons, influential propagator and normal propagators, rational propagator, and immunity were set to 0.95, 0.01, 0.03, 0, and 0.01. Table 2 lists the parameters used in the experiments.
In Figure 8, the horizontal and vertical coordinates represent the time step in hours and the quantity of nodes, respectively. Curves in different colors represent the prediction results of the event by different models. Among them, blue, green and cyan are the prediction results of L-SIRS model, traditional SIRS model and SBD model respectively. The red curve is fitted with the real data obtained from Sina Weibo.
In the initial stage of information transmission, the uninformed nodes
5.4 Information propagation subject to optimal control
The information transmission process subject to optimal control was simulated by using the real data of the event “An old man fell over the dog’s leash and died,” the weighting coefficients were set according to
5.4.1 Optimal control of uninformed person
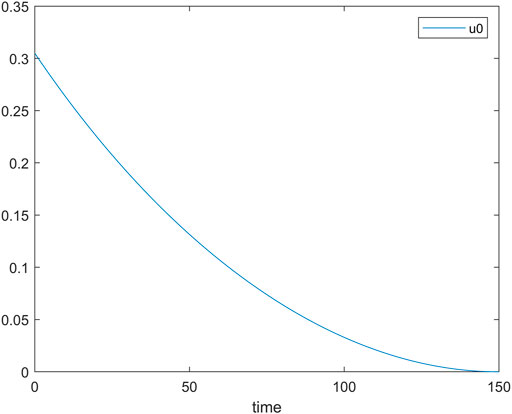
Figure 9 shows the change in
Figure 10 shows the changes in the number of nodes of an uninformed person
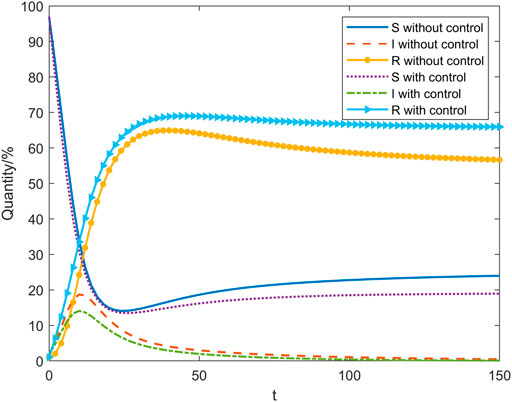
FIGURE 10. Comparison of the changes in the number of nodes without control and subject to the control of an uninformed person.
5.4.2 Optimal control of propagator
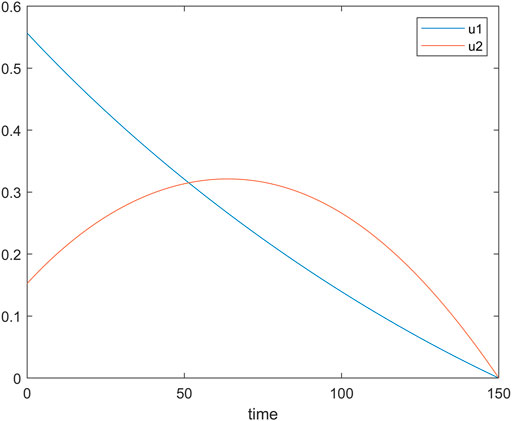
Figure 11 shows the variations of
Figure 12 shows the changes in the number of nodes of the uninformed person
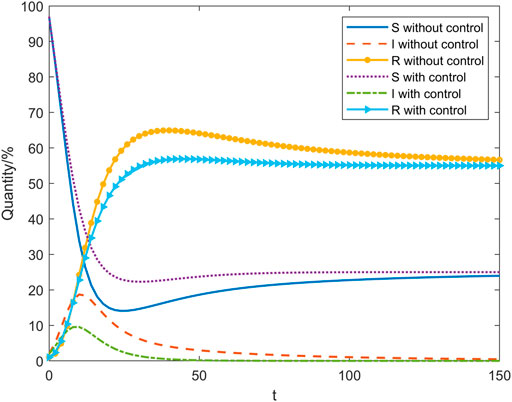
FIGURE 12. Comparison of the changes in the number of nodes without and with control of the propagator.
6 Conclusion
This study proposed a novel L-SITR model that stratified information propagators based on nodal influences and improved the traditional SIRS model by adding rational propagators. Through the study of the theory analysis of dynamics equations, we determine the spread of L-SITR model threshold, and combined with numerical simulation proved that the stability of the equilibrium point. To suppress the large-scale spread of online public opinion information, optimal control was applied to the L-SITR model and the real data obtained from Sina Weibo were used to conduct simulation experiments. Simulation results show that the proposed L-SITR model has higher accuracy than the traditional SIRS model, and is more suitable for information propagation prediction in the presence of rational communicators. Moreover, the optimal control method proposed in this paper can effectively reduce the influence of public opinion propagation.
Because of the complexity of the network information dissemination, our work is not perfect; it also needs to work in the future through the use of more accurate data collection, analysis, and information dissemination mechanism between the nodes to develop a more complete information propagation model. Among them, exploring the information transmission mechanism in line with the real scene is the basis for establishing the propagator model, and the conscious and social attributes of nodes should be taken into account in future work. Additionally, many more methods are needed to simulate and analyze the methods of the intervention process, further improving the accuracy of the models and practicality.
Data availability statement
The original contributions presented in the study are included in the article/supplementary material, further inquiries can be directed to the corresponding author.
Author contributions
All authors participated in the design of the models, methodology, and experiments, and assessment of their relevance. DP and YZ contributed the computer coding and testing. All authors participated in the writing of the article.
Funding
The work was supported in part by Sub Project of National Key Research and Development plan in 2020. (NO. 2020YFC1511704). Beijing Information Science & Technology University (NO.2020KYNH212 and NO. 2021CGZH302). Beijing Science and Technology Project (Grant No. Z211100004421009), and in part by the National Natural Science Foundation of China (Grant No. 61971048). Open Foundation of State key Laboratory of Networking and Switching Technology (Beijing University of Posts and Telecommunications) (SKLNST-2022-1-16).
Conflict of interest
The handling editor declared a past co-authorship with one of the authors YZ.
The remaining author declares that the research was conducted in the absence of any commercial or financial relationships that could be construed as a potential conflict of interest.
Publisher’s note
All claims expressed in this article are solely those of the authors and do not necessarily represent those of their affiliated organizations, or those of the publisher, the editors and the reviewers. Any product that may be evaluated in this article, or claim that may be made by its manufacturer, is not guaranteed or endorsed by the publisher.
References
1. Wang W, Liu Q, Liang J, Hu Y, Zhou T. Coevolution spreading in complex networks. Phys Rep (2019) 820:1–51. doi:10.1016/j.physrep.2019.07.001
2. Mckendrick W. Contributions to the mathematical theory of epidemics. III. Further studies of the problem of endemicity. Proc R Soc Lond (1933) 141:94–122.
3. Wang Y. The spreading of information in online social networks through cellular automata. Complexity (2018) 2018. doi:10.1155/2018/1890643
4. Kabir KMA, Tanimoto J. Analysis of epidemic outbreaks in two-layer networks with different structures for information spreading and disease diffusion. Commun Nonlinear Sci Numer Simul (2019) 72:565–74. doi:10.1016/j.cnsns.2019.01.020
5. Lu Y, Liu J. The impact of information dissemination strategies to epidemic spreading on complex networks. Physica A: Stat Mech its Appl (2019) 536:120920. doi:10.1016/j.physa.2019.04.156
6. Huang H, Chen Y, Ma Y. Modeling the competitive diffusions of rumor and knowledge and the impacts on epidemic spreading. Appl Math Comput (2021) 388:125536. doi:10.1016/j.amc.2020.125536
7. Wang Q, Lin Z, Jin Y, Cheng S, Yang T. Esis : Emotion-based spreader – ignorant – stifler model for information diffusion. Knowl Based Syst (2015) 81:46–55. doi:10.1016/j.knosys.2015.02.006
8. Wang Z, Rui X, Yuan G, Cui J, Hadzibeganovic T. Endemic information-contagion outbreaks in complex networks with potential spreaders based recurrent-state transmission dynamics. Physica A: Stat Mech its Appl (2021) 573:125907. doi:10.1016/j.physa.2021.125907
9. Shaji A, V Belfin R, Kanaga EGM. An innovated SIRS model for information spreading. Int Conf Bigdata Cloud Comput (2017) 2017:1–8.
10. Zhao L, Wang J, Chen Y, Wang Q, Cheng J, Cui H. SIHR rumor spreading model in social networks. Physica A: Stat Mech its Appl (2012) 391:2444–53. doi:10.1016/j.physa.2011.12.008
11. Li J, Jiang H, Mei X, Hu C, Zhang G. Dynamical analysis of rumor spreading model in multi-lingual environment and heterogeneous complex networks. Inf Sci (N Y) (2020) 536:391–408. doi:10.1016/j.ins.2020.05.037
12. Yagan O, Qian D, Zhang J, Cochran D. Conjoining speeds up information diffusion in overlaying social-physical networks. IEEE J Sel Areas Commun (2013) 31:1038–48. doi:10.1109/JSAC.2013.130606
13. Wang Z, Guo Q, Sun S, Xia C. The impact of awareness diffusion on SIR-like epidemics in multiplex networks. Appl Math Comput (2019) 349:134–47. doi:10.1016/j.amc.2018.12.045
14. Wu J, Zuo R, He C, Xiong H, Zhao K, Hu Z. The effect of information literacy heterogeneity on epidemic spreading in information and epidemic coupled multiplex networks. Physica A: Stat Mech its Appl (2022) 596:127119. doi:10.1016/j.physa.2022.127119
15. Li X, Hou B. Competing complex information spreading in multiplex. Complexity (2021) 2021. doi:10.1155/2021/9923837
16. Jiang G, Li S, Li M. Dynamic rumor spreading of public opinion reversal on Weibo based on a two-stage SPNR model. Physica A: Stat Mech its Appl (2020) 558:125005. doi:10.1016/j.physa.2020.125005
17. Wang Z, Liang J, Nie H, Zhao H. A 3SI3R model for the propagation of two rumors with mutual promotion. Adv Differ Equ (2020) 109. doi:10.1186/s13662-020-02552-w
18. Sang C, Li T, Tian S, Xiao Y, Xu G. Sftrd: A novel information propagation model in heterogeneous networks: Modeling and restraining strategy. Physica A: Stat Mech its Appl (2019) 524:475–90. doi:10.1016/j.physa.2019.04.213
19. Zhu L, Guan G. Dynamical analysis of a rumor spreading model with self-discrimination and time delay in complex networks. Physica A: Stat Mech its Appl (2019) 533:121953. doi:10.1016/j.physa.2019.121953
20. Wang Y, Yuan G, Fan C, Hu Y, Yang Y. Disease spreading model considering the activity of individuals on complex networks. Physica A: Stat Mech its Appl (2019) 530:121393. doi:10.1016/j.physa.2019.121393
21. Zhao T, Member S, Chen W, Member S, Liew AW, Member S, et al. A binary particle swarm optimizer with priority planning and hierarchical learning for networked epidemic control. IEEE Trans Syst Man, Cybern Syst (2019) 2019:1–15.
22. Huo HF, Yang P, Xiang H. Dynamics for an SIRS epidemic model with infection age and relapse on a scale-free network. J Franklin Inst (2019) 356:7411–43. doi:10.1016/j.jfranklin.2019.03.034
23. Liu L, Wei X, Zhang N. Global stability of a network-based SIRS epidemic model with nonmonotone incidence rate. Physica A: Stat Mech its Appl (2019) 515:587–99. doi:10.1016/j.physa.2018.09.152
24. Yuan X, Wang F, Xue Y, Liu M. Global stability of an SIR model with differential infectivity on complex networks. Physica A: Stat Mech its Appl (2018) 499:443–56. doi:10.1016/j.physa.2018.02.065
25. Huo J, Zhao H. Dynamical analysis of a fractional SIR model with birth and death on heterogeneous complex networks. Physica A: Stat Mech its Appl (2016) 448:41–56. doi:10.1016/j.physa.2015.12.078
26. Van Den Driessche P, Watmough J. Reproduction numbers and sub-threshold endemic equilibria for compartmental models of disease transmission. Math Biosci (2002) 180:29–48. doi:10.1016/s0025-5564(02)00108-6
27. Huo L, Cheng Y, Liu C, Ding F. Dynamic analysis of rumor spreading model for considering active network nodes and nonlinear spreading rate. Physica A: Stat Mech its Appl (2018) 506:24–35. doi:10.1016/j.physa.2018.03.063
28. Nekovee M, Moreno Y, Bianconi G, Marsili M. Theory of rumour spreading in complex social networks. Physica A (2008) 2008:1–23.
29. Li J, Jiang H, Yu Z, Hu C. Dynamical analysis of rumor spreading model in homogeneous complex networks. Appl Math Comput (2019) 359:374–85. doi:10.1016/j.amc.2019.04.076
30. O’Regan SM, Kelly TC, Korobeinikov A, O’Callaghan MJA, Pokrovskii AV. Lyapunov functions for SIR and SIRS epidemic models. Appl Math Lett (2010) 23:446–8. doi:10.1016/j.aml.2009.11.014
31. Wang X, Peng H, Shi B, Jiang D, Zhang S, Chen B. Optimal vaccination strategy of a constrained time-varying SEIR epidemic model. Commun Nonlinear Sci Numer Simul (2019) 67:37–48. doi:10.1016/j.cnsns.2018.07.003
32. Reviews B, Panja P. Optimal control analysis of a cholera epidemic model. Biophys Rev Lett (2019) 14:27–48. doi:10.1142/S1793048019500024
33. Bakare EA, Nwagwo A, Danso-Addo E. Optimal control analysis of an SIR epidemic model with constant recruitment. Int J Appl Math Res (2014) 3:273–85. doi:10.14419/ijamr.v3i3.2872
34. Li K, Zhu G, Ma Z, Chen L. Dynamic stability of an SIQS epidemic network and its optimal control. Commun Nonlinear Sci Numer Simul (2019) 66:84–95. doi:10.1016/j.cnsns.2018.06.020
Keywords: complex networks, infectious disease model, propagation dynamics, stability analysis, optimal control
Citation: Pan D and Zhang Y (2022) Analysis of information propagation and control of a layered SITR model in complex networks. Front. Phys. 10:985517. doi: 10.3389/fphy.2022.985517
Received: 04 July 2022; Accepted: 22 July 2022;
Published: 23 August 2022.
Edited by:
Xuzhen Zhu, Beijing University of Posts and Telecommunications (BUPT), ChinaReviewed by:
Guanghui Song, Xidian University, ChinaYilun Shang, Northumbria University, United Kingdom
Qisheng Zhang, China University of Geosciences, China
Wang Fengli, Institute of Computing Technology (CAS), China
Copyright © 2022 Pan and Zhang. This is an open-access article distributed under the terms of the Creative Commons Attribution License (CC BY). The use, distribution or reproduction in other forums is permitted, provided the original author(s) and the copyright owner(s) are credited and that the original publication in this journal is cited, in accordance with accepted academic practice. No use, distribution or reproduction is permitted which does not comply with these terms.
*Correspondence: Yuexia Zhang, emhhbmd5dWV4aWFAYmlzdHUuZWR1LmNu
 Dawei Pan
 Yuexia Zhang
