 Hua Luo
 Ke Zhang
 Ruifeng Li
 Yu Xia3
- 1School of Astronautics, Northwestern Polytechnical University, Xi’an, China
- 2Xi’an Aerospace Precision Electromechanical Institute, Xi’an, China
- 3Aerospace System Engineering Shanghai, Shanghai, China
- 4Fujian (Quanzhou)-HIT Research Institute of Engineering and Technology, Quanzhou, China
The evaluation of casting allowance currently relies on manual operation, which is time-consuming and unstable. The structured-light three-dimensional (3D) sensor-based 3D shape measurement technology is characterized by non-contact, high accuracy, and fast measuring speed, which provides the complete 3D shape of casting for accurate allowance evaluation. However, measuring a complex shape casting still requires numerous manual operations, including attaching marks, planning the measurement process, and data processing. To solve these problems, a robot-driven structured-light 3D sensor-based measurement method is proposed, with a six-degree of freedom (6-DOF) industrial robot and a turntable to control the structured-light 3D measurement sensor, to transform the 3D results from different measuring viewpoints into a coherent coordinate system, and to form a complete 3D shape of the casting. Then, the mechanical processing allowance will be calculated by comparing the 3D measurement result and the standard CAD model automatically. The experiment results show that the proposed method is accurate and efficient, and the casting allowance evaluation time is about ten times faster than that of manual operation. Moreover, the proposed method would provide valuable experience for other industrial applications.
1 Introduction
Whether casting possesses enough machining allowance is a crucial criterion to determine whether it meets the processing requirements. The current method of judging the machining allowance of casting is mainly by manual operation, but this method is inefficient and has poor repeatability. Therefore, there is a need to develop a better method for evaluating the machining allowance of castings. Li et al. [1] proposed a method based on a two-step, rough–precise point cloud to extract plane features to estimate the gradual machining allowance, and such a method has higher accuracy and efficiency than traditional methods. However, this method of extracting surface features from point clouds is still insufficient in automation and requires the plane to possess the main plane features. Furthermore, the surface structured-light 3D measurement technology can be applied for gathering surface features of castings. The structured-light 3D shape measurement technology refers to a non-contact optical measurement technology that adopts the principle of binocular stereo vision combined with structured light to obtain 3D data on the surface of an object [2]. It has the advantages of non-contact, fast speed, high precision, etc. [3], and has been used in a broad range of applications, including industrial design, reverse engineering and prototyping, quality control/inspection, documentation of cultural artifacts, casting, and forging [4–8]. However, this technology requires pasting irregular marking points on the surface of the measured object and using the topological relationship between marking points to complete the splicing of the measurement data from different angles, which restricts the accuracy and efficiency of the measurement [9].
In this case, many research institutes have studied and explored the combination of surface-scanning 3D measurement technology and motion platform, such as the ATOS series of 3D scanners launched by the German GOM company, which are fixed on the robotic arm and are applied for surface inspection of giant and complex workpieces. Furthermore, the METRASCAN-R automatic 3D measurement sensor launched by CREAFORM Company, Canada installs portable laser-measuring heads on a 6-DOF robot arm to realize the automatic measurement of parts [10]. However, neither of them directly uses the coordination of the robot terminal to realize the automatic merging of multiple measurement data. The former still needs to paste circular marking points on the measured object or its periphery; the latter requires the utilization of an optical tracking device to track the circular mark points pasted on the measuring head to achieve data integration.
To fill the gaps in the research, this study proposed an automatic measurement system for casting machining allowance based on surface structured-light 3D measurement technology. This system utilizes a 6-DOF robot, a structured-light 3D sensor, and a high-precision electric turntable to realize the automatic allowance evaluation function of the entire workpiece with only five or six mark points maximum for castings and does not require any other auxiliary optical tracking device. Specifically, 3D measurements from different viewpoints are converted into a coherent coordinate to form the complete 3D shape of the casting. Then, the mechanical processing allowance will be calculated by comparing the 3D measurement result and the standard CAD model automatically. The experiments verify that the repetition accuracy is 0.065 mm and the measurement accuracy is 0.085 mm.
2 Surface structured light three-dimensional measurement technology
A typical surface-scanning 3D measurement system consists of a digital raster projection profilometry device and two industrial cameras [11]; the structure of the system is shown in Figure 1. During the measurement, the projecting device projects the coded sinusoidal raster image to the measured object, and the two industrial cameras simultaneously shoot the raster image modulated and deformed by the object surface and then the 3D point cloud data of the object surface is calculated through the computer software [12].
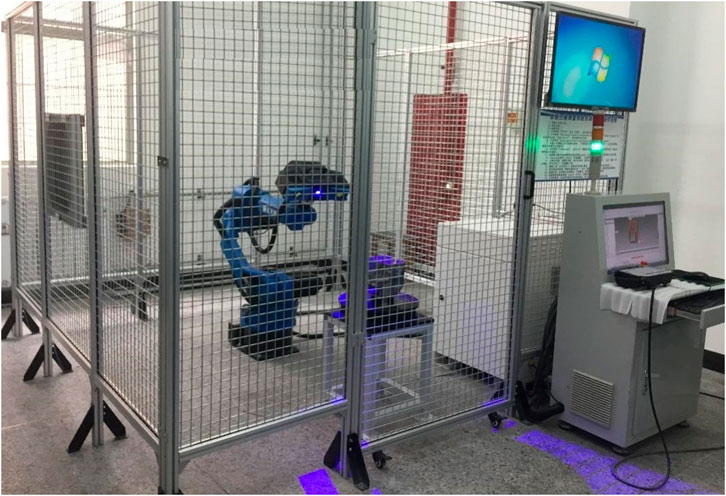
FIGURE 1. Composition of the automated measurement system.
The light intensity function of the projected sinusoidal raster image is [13]:
where I′(x, y) is the average grayscale of the image;I″(x, y) is the grayscale modulation of the image; δi is the phase shift of the image; and ϕ(x, y) is the relative phase value to be calculated (also known as the principal-phase value). In this case, I′(x, y), I″(x, y), and ϕ(x, y) are three unknown quantities; hence, at least three images are required to calculate ϕ(x, y) [14]. Among fringe projection techniques, Fourier-transform profilometry [15]and phase-shifting algorithm [16] have been widely used. This study utilizes the standard four-step phase-shift algorithm to calculate the principal–phase value. The phase shifts of the four raster images are 0, π/2, π and 3π/2, and the light intensity function of these four raster images are [17]
Then, the principal–phase value of the raster image can be calculated as follows [17]:
The ϕ(x, y) obtained by the standard four-step phase-shift algorithm is unique within a phase period; nevertheless, since there are multiple raster fringes in the entire measurement space, the principal–phase value of the space point must be phase-unwrapped to obtain a continuous absolute phase value [18]. The absolute phase map can be used for determining correspondences between cameras in a multi-camera stereo vision system [19] or between a camera and a projector in a structured light system [20, 21]. In this study, the multi-frequency heterodyne method is adopted for phase-unwrapping to obtain the absolute phase value of each pixel [22]. Then, based on the epipolar constraints between the cameras to establish the matching relationship between the images, the triangulation principle is used to calculate the 3D coordinate W of the measuring point.
3 Automated measuring system
3.1 Automated measuring system
The automated measurement system is mainly composed of hardware devices such as structured-light 3D measurement equipment, 6-DOF robots, and high-precision electric turntables, as shown in Figure 1, and the performance parameters of each device are shown in Table 1. The 6-DOF robot carries the measuring equipment for multi-directional scanning, and the high-precision turntable carries the castings for multi-angle rotation to realize the 3D measurement of the castings from different angles. The three key dimensions of a system structure are one each in the x-direction, y-direction, and z-direction.
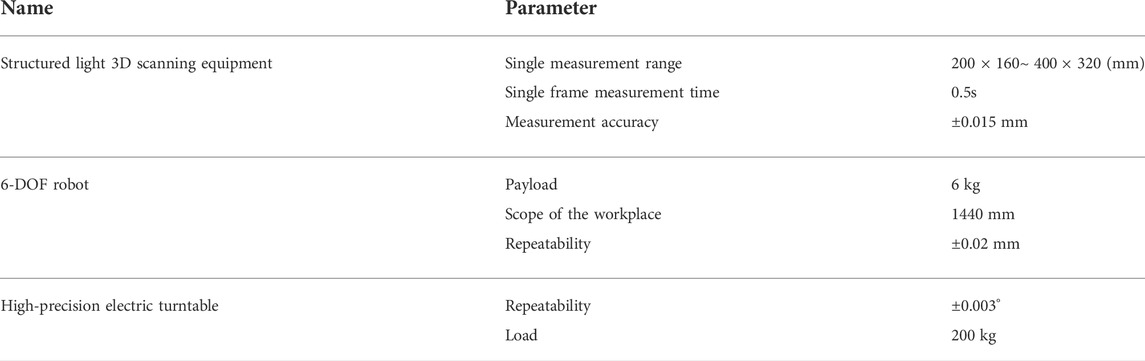
TABLE 1. Hardware device parameters.
3.2 3D measurement software
The 3D measurement software system is divided into the teaching module and the measurement module to realize the input of the original design diagram of the casting to be tested, the input of the corresponding position of the robot and the turntable, and controls of the robot to carry the surface of the structured-light three-dimensional measuring equipment and cooperate with the turntable to scan the castings, process and calculate the point cloud data of the casting, and compare it with the original design diagram to determine whether the workpiece has sufficient machining allowance. The workflow of the software is shown in Figure 2. Before the measurement, the division of crucial dimensions and point-of-view-planning according to the appearance feature of the measured object, the movement path of the teaching robot, and the rotation position of the turntable must be carried out. When measuring, the robot traverses all viewpoints according to the pre-planned path. When the robot reaches a viewpoint, the surface structured light 3D measuring device is triggered and projects a series of raster patterns on the object to be measured; in the meantime, the left and right cameras simultaneously acquire the passing image information reflected by the measured object. After the image is collected, the 3D data of the part of the measured object are rapidly reconstructed through data processing; the robot moves to the next measurement viewpoint measuring the 3D data of other parts of the measured object and aligns the coordinates with the measured data until the measurement obtains the complete 3D data on the surface of the measured object.
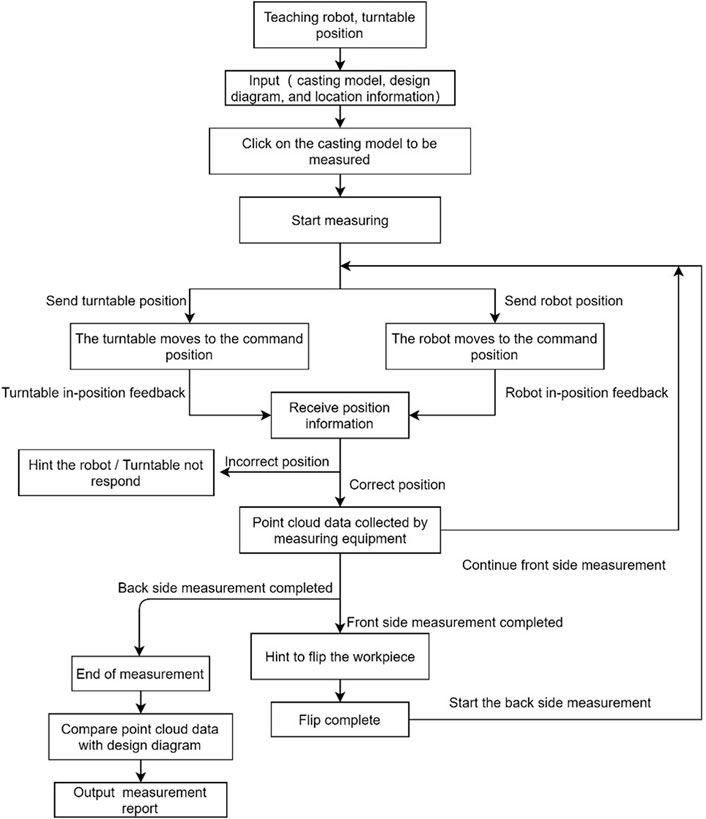
FIGURE 2. Workflow of the software.
3.3 Principle of the system
During the measurement, the 3D measurement software sends instructions to the robot control system and drives the surface structured light 3D measurement sensor to proceed with the 3D measurement for the measured object according to the pre-planned path by controlling the end effector. During each measurement, the control system returns the pose of the robot end-effector to the 3D measurement software. Finally, the software automatically splices the point cloud data obtained from each measurement into the same coordinate system according to the conversion relationship between the pose of the robot end-effector, the robot coordinate system, and the coordinate system of the surface structured-light 3D measuring equipment during each measurement and then obtains the complete 3D data on the surface of the measured object.
The robot and turntable configured in this system possess extremely high repetitive positioning accuracy; hence, each scanning position can be uniquely determined and has extremely high-precision repeatability. In this case, each scanning position can uniquely determine the coordinates in a world coordinate system so that the measurement data of different sides of the casting can be unified under the same coordinate system and mark-free stitching can be realized.
Due to the limited field of view of the camera, the contact surface between the casting and the turntable is a blind zone. Therefore, it is necessary to scan the casting again after scanning the front side to ensure that the complete point cloud data of the casting can be obtained. Since the position of the workpiece is not repeatable and automatic assembly cannot be realized after flipping the workpiece, this study pastes 5–6 mark points on one surface of the casting and completes the automatic merging of the front side and back side data by calculating the coordinate conversion relationship of the mark points.
Above all, under the premise that only 5–6 marking points are required to be posted, the scanned data of the entire casting can be automatically combined to obtain the complete point cloud data of the casting. Eventually, the point cloud data are compared with those of the design diagram of the casting, and then the allowance inspection report can be obtained to realize the automatic measurement of the machining allowance of the casting and determine whether it is qualified.
4 Experimental verifications
The current way of casting allowance detection is mainly manual measurement. First, it determines a data line in the x, y, and z directions (take x direction as an example), levels the workpiece according to the x data direction, combines with the dimensions on the design drawing, and then uses the height ruler to mark the dimensional position of the workpiece after machining on the casting, and the excess casting part is the machining allowance. Hence, it completes the marking of all dimensions in the y and z directions, and if the machining allowance of all dimensions meets the process requirements, the casting is judged to be qualified. The tools and the specific process are shown in Figure 3.
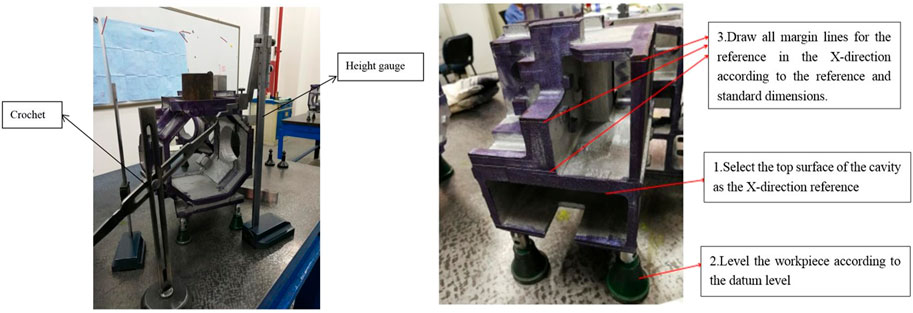
FIGURE 3. Tools and process of manual measurement.
The advantages of manual measurement are simple equipment and low cost. The main disadvantage is low efficiency. According to the field investigation, the manual inspection process is tedious, and all dimensions of x, y, and z need to be calculated and marked. It takes at least 2 days for a skilled fitter to process a batch (six pieces) of parts, with an average of 2.5 h for each piece. Furthermore, the accuracy of manual measurement is not guaranteed, and the range of accuracy is 0.25 ∼ 0.5 mm [23]. The detection result depends entirely on the skill of the worker, and a slight negligence can easily lead to misjudgment.
The 3D measuring equipment proposed in this study realizes automatic measurement of the machining allowance of castings, which takes only 15 min for one piece on average, and can replace the manual measurement of the allowance detection work.
4.1 Equipment accuracy test
The size of the casting is difficult to accurately measure due to its rough and uneven surface, and it is impossible to accurately measure the system measurement accuracy. Therefore, high-precision ball bar and workpieces are selected to test the accuracy and repeatability of the equipment, respectively, and the maximum value is selected as the accuracy of the system eventually.
4.1.1 High-precision ball bar test
The high-precision ball bar is selected to test the equipment in the sphere space as shown in Figure 4. First, a high-precision three-coordinate measuring machine is adopted to measure the sphere’s center distance of the ball bar as the true value of the measurement. The measurement results are shown in Table 2. Then, the automatic measuring system is utilized to measure the ball bar eight times to obtain its point cloud data, calculate the distance between the fitting sphere centers of the two balls, and compare it with the measured true value. The results are shown in Table 3. In Table 3, the deviation is the difference between the actual value and the measured value, and the maximum value of the deviation in the eight measurements is regarded as the system measurement accuracy; the measurement value range is the difference between the maximum value and the minimum value of the eight measurement results, which is regarded as the system repeatability accuracy. It can be seen from Table 3 that the system measurement accuracy reaches 0.084559 mm, and the repeatability accuracy reaches 0.009533 mm.
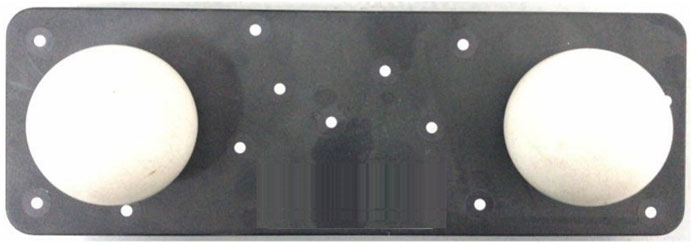
FIGURE 4. High-precision ball bar.
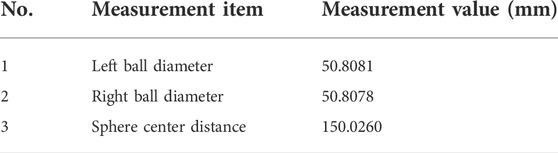
TABLE 2. Results of the sphere center distance of the high-precision three-coordinate measuring machine.
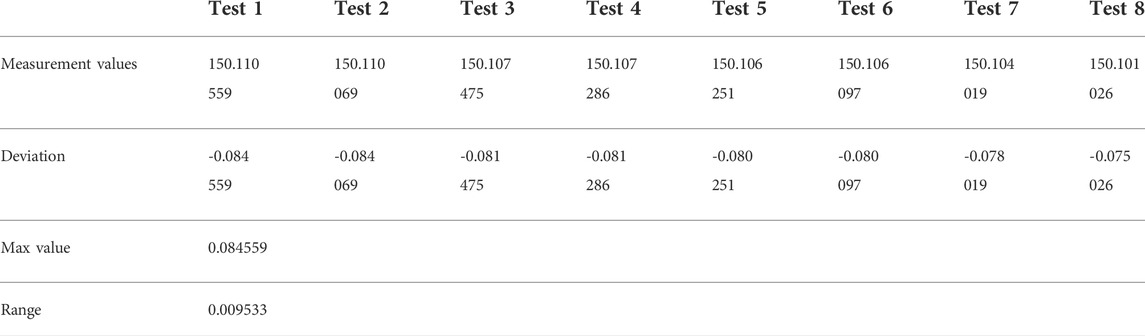
TABLE 3. Comparative results (mm).
Table 4 compares the 3D measurement results of the two methods. The 3D measurement precision of the manual measurement method is less than 0.5 mm, and the measurement time is 150 min. It is evident that, compared with the manual measurement method, the proposed method exhibits a higher 3D measurement precision: the measurement maximum error is less than 0.084559 mm, the range is 0.009533 mm, corresponding to a measurement time of 15 min, which is one-tenth of that using manual work. These results meet the actual application requirements of casting allowance evaluation accuracy. The experimental results proved that the proposed method is effective for improving the casting allowance evaluation efficiency, and it can replace traditional manual methods for the automatic casting allowance evaluation.

TABLE 4. Measurement precision.
4.1.2 Testing of a precision machined workpiece
The precision-machined workpiece shown in Figure 5 is selected and the system measurement accuracy is measured from two aspects, which are plane fit and crucial dimension measurement. Then, the repeatability accuracy of the system is calculated for ten repeated measurements.
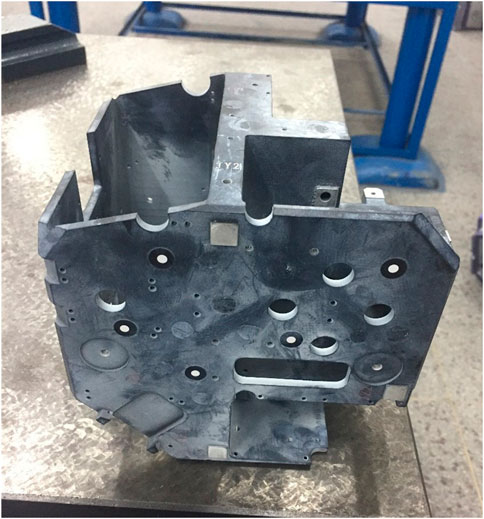
FIGURE 5. Schematic diagram of the precision machined workpiece and pasting mark points.
4.1.2.1 Experimental process
Pasting 5 marks points on one side of the workpiece; the side of the sticker is placed facing toward the robot and in the middle of the turntable, as shown in Figure 6. The automated measurement system is run, the robot and the turntable each automatically run to position 1, and the measurement equipment takes a photo measurement to obtain the first scan of the workpiece, and so on, until the result of the front side is scanned. The casting is manually flipped over and proceeds with the back side until the point cloud data of the entire workpiece is obtained. The entire scanning and calculation process takes 8 min.
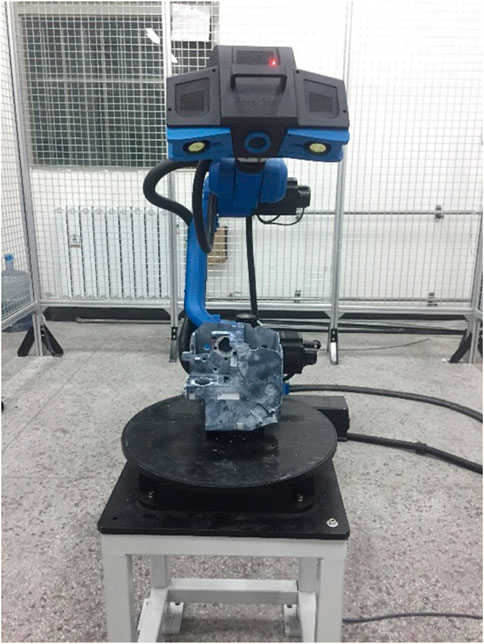
FIGURE 6. Schematic diagram of the placement of castings.
4.1.2.2 Plane fit test
The acquired point cloud data are three-dimensionally aligned with the design diagram of the workpiece. The alignment data are utilized to select the three outermost precision-machined surfaces. The alignment result is shown in Figure 7. The differences between the point cloud data and the design diagram are displayed in different colors. Warm tones indicate areas of allowance, and cool colors indicate areas of deficiency. The darker the color, the greater the value of allowance or deficiency. Then, randomly selecting 12 points from the results, the deviation of this point from the design diagram is measured and the average value of the deviation is used as the plane-fitting accuracy of the system. The results are shown in Table 5, where the average deviation is 0.00912 mm.
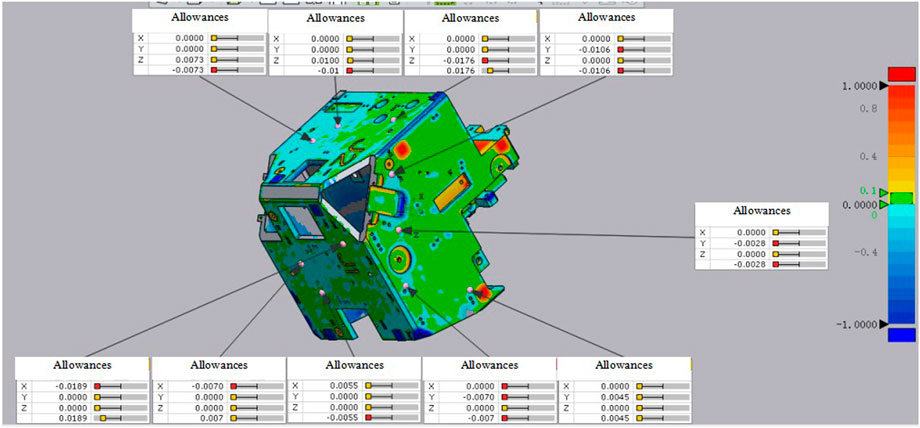
FIGURE 7. Alignment results.
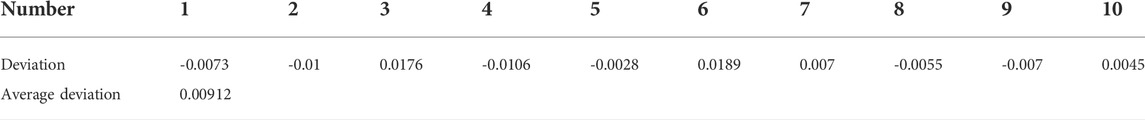
TABLE 5. Plane fit test result (mm).
4.1.2.3 Repeatability accuracy test
Scanning the casting is repeated ten times, three key dimensions are re-selected on the casting, the difference between the maximum value and the minimum value of the ten measurements of each key dimension is regarded as the range, and the maximum value of the three ranges is regarded as the system repeatability accuracy. The measurement results are shown in Table 6.
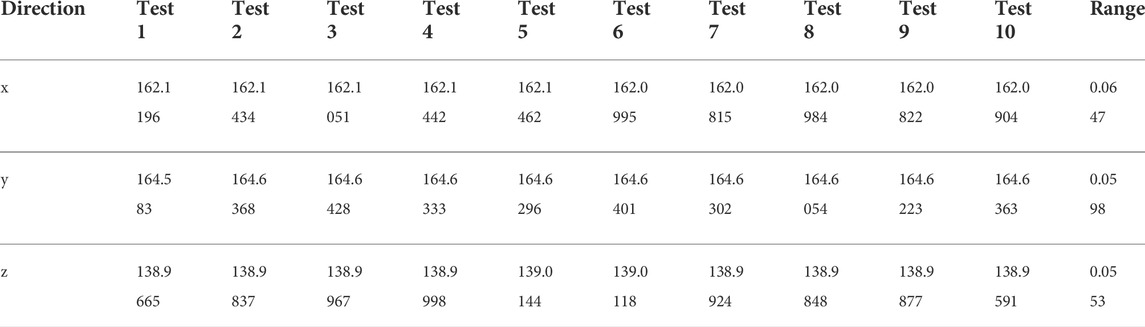
TABLE 6. The tested casting.
4.2 Experimental summary
The result of the experiment verifies that the scanning time of this system is 8–15 min according to the size of the tested casting. During the equipment accuracy measurement, the measurement accuracy of the high-precision ball bar was 0.08456mm, and the repeatability accuracy was 0.0095mm; the plane fitting accuracy of the precision machined casting was 0.00912mm, and the repeatability accuracy was 0.0647 mm. In summary, the system measurement accuracy was 0.08456mm, and the repeatability accuracy was 0.0647 mm. In addition to improving the efficiency of casting machining allowance detection, it also improves its repeatability accuracy to meet the requirements of casting machining allowance detection. Tested casting is shown in Figure 8. Figure 9 shows the distribution results of casting allowance obtained by using the aforementioned technology and system. The allowance in the red area exceeds 1 mm, meeting the requirements of subsequent machining.
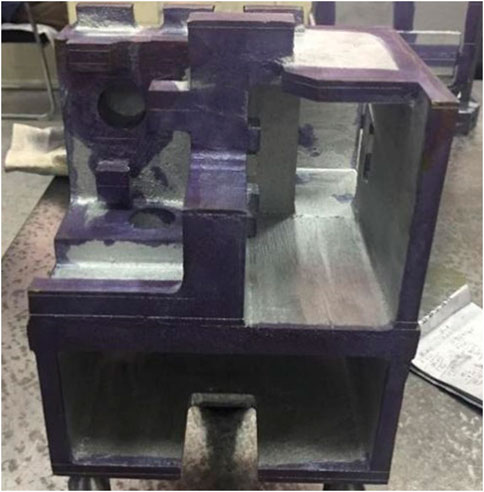
FIGURE 8. Tested casting.
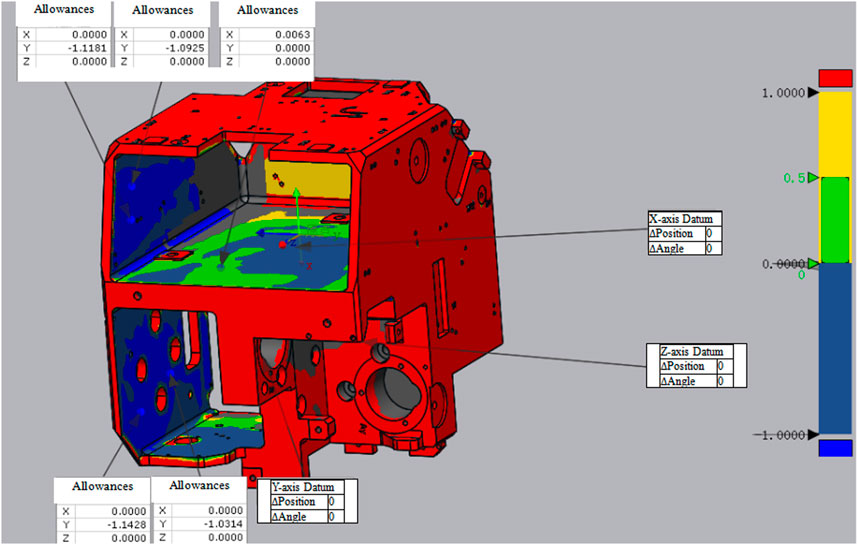
FIGURE 9. Distribution results of casting allowance. The material used in simulation settings is aluminum alloy.
The main sources of error are 1) repeat positioning accuracy of the robot. This study does not need to paste too many marker points on the surface of the workpiece, while we focus on the use of the robot’s repeat positioning accuracy. The robot used in this study has a repeat positioning accuracy of 0.03mm, which is the main source of error in this system. 2) Since the bottom surface of the casting (the surface in contact with the rotary table) cannot be scanned at one time, the part needs to be manually flipped 90° to sweep the bottom surface. This requires resplicing the data after the flip and the data before the flip, introducing a splicing error.
5 Conclusion
This study proposes a 3D vision measurement system for castings for industrial robots, which adopts surface structured light 3D measurement technology to obtain casting point cloud data and automatically merge the measurement data of different orientations to achieve the machining allowance of the castings based on the high repeatability accuracy of the robot and the high-precision turntable. The system overcomes the disadvantages of instablility and time-consumption in the manual operation, and the result of the experiment shows that the repeatability accuracy of the system is 0.065mm, the measurement accuracy is 0.07mm, and the measurement time is 8 min, which fully improves the efficiency, accuracy, and repeatability of the casting machining allowance measurement. Moreover, it can be widely used in casting machining allowance detection. Due to the limited field of view of the camera, the contact surface of the casting with the turntable is a blind spot, which is our limitation. We currently overcame it by scanning the casting again after scanning the front side to obtain the complete point cloud data of the casting, which is a future research direction.
Data availability statement
The original contributions presented in the study are included in the article/Supplementary Material; further inquiries can be directed to the corresponding author.
Author contributions
HL, KZ, and RL contributed to the conception and design of the study. HL and KZ organized the database. PL and RL performed the statistical analysis. HL and PL contributed to project administration and funding acquisition. RL wrote the first draft of the manuscript. HL, PL, and YX wrote sections of the manuscript. All authors contributed to manuscript revision, read, and approved the submitted version.
Funding
This research is supported by the National Key Research and Development Program of China (No. 2018YFB1305700).
Conflict of interest
The authors declare that the research was conducted in the absence of any commercial or financial relationships that could be construed as a potential conflict of interest.
Publisher’s note
All claims expressed in this article are solely those of the authors and do not necessarily represent those of their affiliated organizations, or those of the publisher, the editors, and the reviewers. Any product that may be evaluated in this article, or claim that may be made by its manufacturer, is not guaranteed or endorsed by the publisher.
References
1. Li X, Li W, Jiang H, Zhao H. Automatic evaluation of machining allowance of precision castings based on plane features from 3d point cloud. Comput Indspecial Issue 3d Imaging Industry (2013) 64:1129–37. doi:10.1016/j.compind.2013.06.003
2. Li Z. Research on 3D measurement technology and system of structured light based on fringe projection profilometry. [Ph.D. thesis]. Wuhan (China): Huazhong University of science and technology (2009).
3. Gorthi SS, Rastogi P. Fringe projection techniques: Whither we are? Opt Lasers Eng (2010) 48:133–40. doi:10.1016/j.optlaseng.2009.09.001
4. Chen F, Brown GM, Song M. Overview of three-dimensional shape measurement using optical methods. Opt Eng (2000) 39:10–22. doi:10.1117/1.602438
5. Salvi J, Pagès J, Batlle J. Pattern codification strategies in structured light systems. Pattern Recognit DAGMAgent Based Comput Vis (2004) 37:827–49. doi:10.1016/j.patcog.2003.10.002
6. Guang Y, Zhou M, Han L, Li Z, Xia J. Automatic three-dimensional precision measurement technology and its application in forging field. Forg Stamp Technol (2016) 41:109–14.
7. Nwaogu U, Tiedje N, Hansen H. A non-contact 3d method to characterize the surface roughness of castings. J Mater Process Technol (2013) 213:59–68. doi:10.1016/j.jmatprotec.2012.08.008
8. Huang H, Liu G, Duan K, Yuan J. 3d reconstruction of structured light based on infrared mems. J Laser Appl (2021) 33:042035. doi:10.2351/7.0000469
9. Dang N. Application of automatic optical inspection technology in industrial quality inspection. Auto Instrum (2015) 31–2.
10. Zhang J. Application of optical inspection technology in automobile stamping die manufacturing process. Auto Technol Mater (2011) 16–20.
11. Huang J. Research on 3D laser scanning measurement system based on industrial robot. [Ph.D. thesis]. Tianjin (China): Tianjin University (2012).
12. Liang Y, Deng W, Lou X, Lv N. Automatic stitching method of multi view 3d data based on marker points. J Beijing Inf Sci Technol Univ (2010) 25:30–3.
14. Zhu H, Wu M, Li Z. Blue light surface scanning three-dimensional measurement technology and its application in casting field. Foundry Technol (2015) 36:251–4.
15. Su X, Chen W. Fourier transform profilometry:. Opt Lasers Eng (2001) 35:263–84. doi:10.1016/S0143-8166(01)00023-9
16. Salvi J, Fernandez S, Pribanic T, Llado X. A state of the art in structured light patterns for surface profilometry. Pattern Recognition (2010) 43:2666–80. doi:10.1016/j.patcog.2010.03.004
17. Surrel Y. Design of algorithms for phase measurements by the use of phase stepping. Appl Opt (1996) 35:51–60. doi:10.1364/ao.35.000051
18. Zhong K, Li Z, Shi Y, Wang C, Lei Y. Fast phase measurement profilometry for arbitrary shape objects without phase unwrapping. Opt Lasers Eng (2013) 51:1213–22. doi:10.1016/j.optlaseng.2013.04.016
19. Han X, Huang P. Combined stereovision and phase shifting method: A new approach for 3D shape measurement. In: PH Lehmann, editor. Optical measurement systems for industrial inspection VI, 7389. Bellingham, WA: International Society for Optics and Photonics SPIE (2009). p. 1038–45. doi:10.1117/12.828223
20. Li Z, Shi Y, Wang C, Wang Y. Accurate calibration method for a structured light system. Opt Eng (2008) 47:053604. doi:10.1117/1.2931517
21. Zhang S, Huang PS. Novel method for structured light system calibration. Opt Eng (2006) 45:083601–8. doi:10.1117/1.2336196
22. Reich C, Ritter R, Thesing J. White light heterodyne principle for 3D-measurement. In: O Loffeld, editor. Sensors, sensor systems, and sensor data processing, 3100. Bellingham, WA: International Society for Optics and Photonics SPIE (1997). p. 236–44. doi:10.1117/12.287750
Keywords: structured-light 3D sensor, automatic 3D measurements, allowance evaluation, digital image processing, multiple view scanning
Citation: Luo H, Zhang K, Li R, Xia Y and Liang P (2022) A structured-light 3D sensor-based shape measurement method for casting allowance evaluation. Front. Phys. 10:979450. doi: 10.3389/fphy.2022.979450
Received: 27 June 2022; Accepted: 14 September 2022;
Published: 05 October 2022.
Edited by:
Santosh Kumar, Liaocheng University, ChinaReviewed by:
Mandeep Singh, National Institute of Technology, Karnataka, IndiaAkhilesh Kumar Pathak, Chulalongkorn University, Thailand
Copyright © 2022 Luo, Zhang, Li, Xia and Liang. This is an open-access article distributed under the terms of the Creative Commons Attribution License (CC BY). The use, distribution or reproduction in other forums is permitted, provided the original author(s) and the copyright owner(s) are credited and that the original publication in this journal is cited, in accordance with accepted academic practice. No use, distribution or reproduction is permitted which does not comply with these terms.
*Correspondence: Hua Luo, bG91aGVhdGhlckAxNjMuY29t