- 1Center for Transformative Science, ShanghaiTech University, Shanghai, China
- 2Shanghai Synchrotron Radiation Facility, Shanghai Advanced Research Institute, Chinese Academy of Sciences, Shanghai, China
- 3School of Physical Science and Technology, ShanghaiTech University, Shanghai, China
Shanghai Soft X-ray Free-Electron Laser (SXFEL) is the first X-ray free-electron laser facility in China. The initial commissioning of the beamline was carried out in May 2021. Herein, we present a status report and the first experimental results obtained during the early commissioning of Kirkpatrick-Baez (KB) mirrors for the Coherent Scattering and Imaging (CSI) endstation, including three types of diagnostics. A bright X-ray focal spot of less than 3 μm was achieved by using edge-scan and silicon ablation imprint measurements. In order to confirm the spot size, the attenuated beam and full beam are used respectively for the two measurement methods.
Introduction
Shanghai Soft X-ray Free-Electron Laser (SXFEL) [1, 2], as the first XFEL in China, consists of two established beamlines. One is a self-amplified spontaneous emission (SASE) beamline, and the other is echo enabled harmonic generation (EEHG) beamline. So far, there are five constructed endstations, focusing on dynamic and radiation damage-free imaging, ultrafast physical phenomena, surface and ultrafast chemical processes, and atomic and molecular physics. Among the five endstations, the Coherent Scattering and Imaging (CSI) endstation is designed for high temporal and spatial imaging with coherent diffraction imaging (CDI) and Fourier transform holography (FTH). Furthermore, other methods based on forward scattering geometry can also be available, such as time-resolved small-angle X-ray scattering (Tr-SAXS). To achieve high spatial resolution at the CSI endstaiton, a high flux density at sample position is required. A Kirkpatrick-Baez (KB) system was installed at the upstream of the CSI endstation to focus the beam down to a few micrometers [3]. The KB mirrors for CSI endstation were commissioned, and the first coherent diffraction imaging experiment of samples was successfully demonstrated.
Various appropriate diagnostics at the focusing position are required to obtain good focusing in the shortest time during the commissioning process. The pioneers of FEL have shown different diagnostics, such as a YAG screen with a microscope, PMMA ablation imprints, wire (or edge) scan, wavefront sensor, etc. The YAG screen method [4, 5] is a convenient way to characterize the focus spot. But to obtain a high spatial resolution, such as sub-micrometer, an in-vacuum high numerical aperture (NA) objective is essential and more space is needed. A low-resolution microscope is also very useful for rough alignment as it has a large field of view (FOV). Beam attenuation is required to avoid radiation damage to the YAG screen. The PMMA ablation imprints are usually used to obtain the actual beam shape. It has been widely used to determine the focus spot size and the focus position at FLASH, FERMI, LCLS and SACLA ([4, 6–10]). However, it can not give a fast online determination, as it takes time to remove the PMMA from vacuum and image it with a microscope or scan it with a AFM. The wire (edge) scan [9, 11–14] is a common method used to measure the beam size. Similar to YAG screen imaging, the XFEL pulse energy needs to be attenuated to avoid radiation damage to wire (edge). On the other hand, the wire (edge) scan is an accumulation of multi-shot, thus, the stability of the beam is convoluted to the beam size. It can not identify the tilt of the spot, but it is suitable for the final measurements. The wavefront sensor [6, 13, 15–19] is a very useful method, especially for bendable mirrors. A bendable KB system with a wavefront sensor was developed at FERMI [5, 7]. It is an ideal method, as the wavefront error can be decomposed into Zernike coefficients which represent the possible source of errors. It can give the direction of the alignment. However, the FOV of the wavefront sensor is limited, and a rough commissioning is still necessary beforehand. In summary, although each method has its own advantages and limitations, combining various characterization methods can accelerate the commissioning process and get optimized focus results during the KB mirrors commissioning.
In this paper the KB system alignment process and focusing result at the CSI endstation of SXFEL are reported. The different characterization methods for rough commissioning, fine commissioning, and final characterization are presented.
Beamline and focus diagnostics
Figure 1 shows the beamline layout of the CSI endstation. The first and second plane mirrors are offset mirrors, which are located at 59 and 65 m downstream of the source respectively, and generate a horizontal offset of 314 mm to block the high energy radiations easily. A plane mirror PM3 located at 117.5 m, is parallel with the vertical focusing mirror ECM1, so it can make the exit beam in the horizontal plane. The last mirror is the horizontal focusing mirror ECM2. The image distances of ECM1 and ECM2 are 2 and 1.5 m, respectively. These three mirrors are in the same chamber. A gas attenuator is positioned in front of PM1 to adjust the pulse energy. Two gas monitors are installed in front and back of the gas attenuator to monitor the pulse energy. A solid attenuator is located in front of PM3 to supply further attenuation abilities. The grazing angles of all mirrors are 1.5°, and all mirrors are coated with B4C for the energy range of 100–1,000 eV (except for the carbon K edge and boron K edge). The mirrors were made by Jtec. According to the Maréchal criterion, the height errors were calculated with Eq. 1, where h is height error, λ is the wavelength, θ is the grazing angle, and N is the number of optics. It should be smaller than 0.76 nm RMS for 5 mirrors at 1,000 eV, and 1.46 nm RMS at 520 eV. Table 1 shows the requirements of the mirrors. The theoretical beam size is about 1.8 μm (H) × 2.4 μm (V) from the simulation.
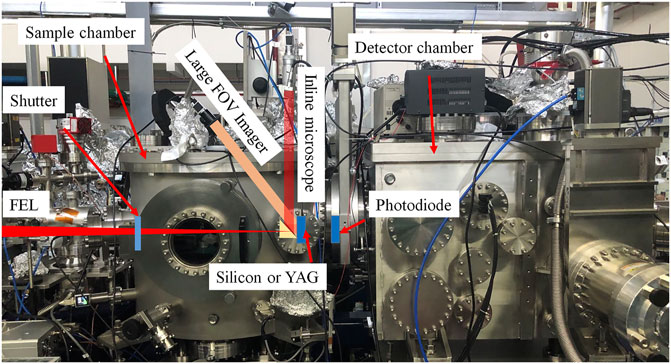
The CSI endstation is shown in Figure 2. The main components are sample chamber and detector chamber. To characterize the KB focusing properties, various diagnostic tools were installed inside and on the sample chamber. First, a large FOV imaging system was mounted on the sample chamber cover as shown in Figure 2. It includes a camera (Basler a2A5328-15 um BAS, 2.74 μm pixel size) and a 75 mm focal length lens (Computar V7531-MPZ). Through a 45° view window which points to the focusing position, a YAG screen mounted on the sample stage could be imaged by the large FOV imaging system. Such a configuration can offer a pixel resolution of about 15 μm with a FOV of about 78 mm × 67 mm. Because the YAG screen is not perpendicular to the optical axis of the lens, the image out of focal depth is blurred. The second is an inline microscope, which is designed for locating the fixed target sample and XFEL beam position. It consists of a long working distance (LWD) microscope (UWZ400F), a view window, and a 45° mirror. The LWD microscope has a fixed working distance of 400 mm and allows samples to be viewed through an observation window with the help of a 45° lens. On the 45° mirror, a 2 mm hole was drilled to enable it to work online. It has inline illumination, its spatial resolution is 6.71 μm, and its pixel resolution is about 1 μm. Due to the numerical aperture (NA) limitation, it is difficult to catch the focusing spot with enough signal-to-noise ratio (SNR). The edge scan system includes a knife-edge (silicon edge) and an X-ray sensitive photodiode (XUV100), which is achieved by scanning the knife-edge mounted on the sample stages and recording the signal of the photodiode behind the frame step by step. The signal is recorded by an oscilloscope. The X-ray detector was used to confirm the full beam entering to the sample chamber. A shutter was installed at the beam entrance of the chamber to select single pulses. All of the devices are controlled with the EPICS and triggered by the White Rabbit based timing system. The data acquisition is realized with PyEpics. The commissioning of the KB system was performed at 520 eV with a repetition of 2 Hz.
The commissioning of KB system
Before commissioning, all the components of the beamline were aligned with a laser tracker. A number of apertures were mounted in front of important components to avoid damage. Especially, there are two 8 mm apertures in the differential pumping system between the KB mirror chamber and the sample chamber. These apertures make the online alignment complicated. Therefore, an X-ray detector was used initially to ensure that the entire beam entered to the sample chamber.
Rough alignment
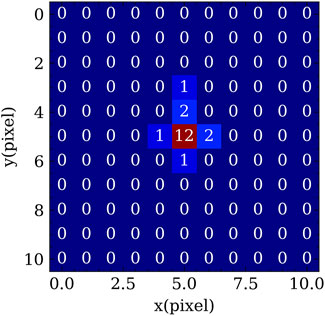
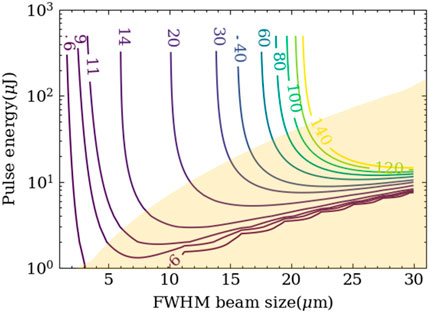
The main purpose of rough alignment is to focus the beam to a size that can easily damage the silicon. It was performed with the large FOV imaging system. A 10 mm × 10 mm YAG screen mounted on the sample stages was placed at the theoretical focusing position. From the large FOV imaging system, a bright spot of hundreds of micrometers was observed. The beam was focused from hundreds of micrometers to tens of micrometers by tuning the KB mirrors. In order to avoid radiation damage of the YAG screen, the pressure of the gas attenuator was increased as the spot size diminishing. A Python script was used to track and display the spot area for convenience. It can display the spots in an image with pixel values as shown in Figure 3. When the spot size is big, the image can show the special shape of the beam, such as tilt and tails. When the beam size is small and only few pixels are bright, the pixel value is very useful. Figure 4 shows the ratio of the maximum pixel value of the Gaussian beam to neighbor pixel value changed with the full width at half height (FWHM) beam size. For example, the maximum pixel value is 12, and the maximum neighbor pixel value is 2 in Figure 3, the ratio is 6. According to Figure 4, the FWHM beam size is about 1 pixel. This is a rough estimation, as the beam is not an ideal Gaussian shape, especially during commissioning. After this step, the beam size was about 15 μm.
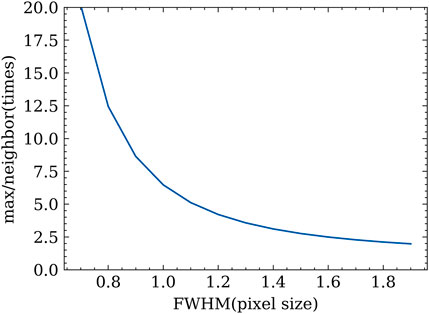
FIGURE 4. The ratio of the max pixel value to the neighbor pixel value changed with the FWHM beam size.
Micrometers focusing with silicon ablation imprint
The silicon ablation imprint imaged by the inline microscope was used for further tuning of the KB system. The aim of this step was to decrease the coupling of the horizontal and vertical beam sizes caused by the spot tilt and to focus to less than 10 μm. The silicon ablation imprint is not as sensitive as PMMA, but it can also be used as an indicator of beam shape and size. The silicon frame of the sample holder was used as the ablation target. It was well polished, with good reflectivity. When the silicon surface is perpendicular to the optical axis of the inline microscope, the image is very bright. Because the inline illumination directly reflects back to the microscope. Any defect larger than the pixel resolution of the microscope can be imaged as a dark spot under this condition. When the silicon surface is not perpendicular to the optical axis of the inline microscope, the image is dark, and the defects on the silicon can be imaged as a bright spot. This phenomenon was used to adjust the contrast of the image.
After the rough alignment, the spot was small enough for ablating the silicon. Here, the damage threshold of silicon is about 0.88 eV/atom [20], corresponding to an energy density 0.007 μJ/μm2 at 520 eV and 90° incidence. Assuming a Gaussian distribution of focus spot, Figure 5 shows that the ablation area diameter changed with the pulse energy and FWHM beam size in theory. For the yellow area, the pulse energy is relatively low, and the beam size is big. The ablation area diameter is sensitive to the pulse energy. In the other area, the ablation area diameter is not sensitive to the pulse energy.
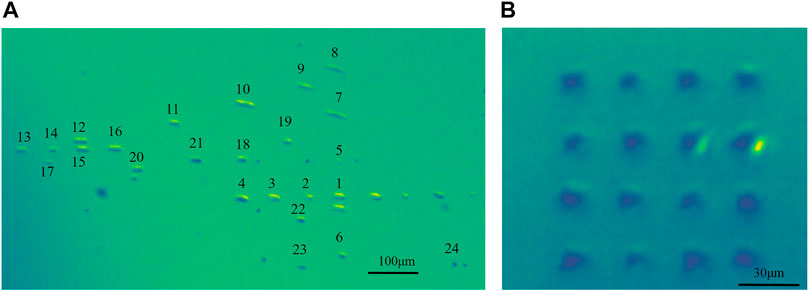
The silicon ablation imprint was performed with the full beam of about 10–100 μJ. The shutter at the entrance of the sample chamber was used to select a single pulse to shoot the silicon frame for each scan step. During tuning of the KB mirrors, the focus profile was detected by imaging the silicon ablation imprint. Figure 6A shows a typical commissioning process. The tilt of the spot or the coupling of the horizontal and vertical beam size was decreased during the process. The silicon was moved after index 21, so the index is not continuous. Figure 6B shows the silicon ablation imprint after adjusting KB mirrors. Finally, the shape looks round and small. But it is not the real beam shape because the spatial resolution of the inline microscope is 6.71 μm. The shape is the convolution of the beam shape and the point spread function of the microscope. The diameter of the damage area is about 10 pixels. With the silicon ablation imprint, the beam size was focused down to 10 μm.
Edge scan and final silicon ablation imprint
To further optimize the KB system and check the focus spot size, the edge scan was used for finer alignment. The pulse energy was attenuated 3–4 orders of magnitude with the gas attenuator to avoid radiation damage to silicon. A photodiode was mounted downstream of the silicon edge to record the transmitted pulse energy. The X-ray beam was cut step by step by moving the silicon edge, the transmitted pulse energy was recorded by the oscilloscope. For the rough edge scan, 10 pulses were recorded per step. The averaged photodiode signals were normalized to the averaged pulse energy. Figure 7 shows the edge scan result after silicon ablation imprint. Due to the poor SNR, it was difficult to differentiate and fit. To solve this problem, one way is to record more pulses and then average them. It is effective, but it will take a long time to record enough pulses considering the repetition rate of 2 Hz. Alternatively, the edge scan results were fitted with the integral of the Gaussian function. Although it cannot distinguish the side peak, it can give an estimation of beam size and trend without requiring a high SNR. Figure 7 shows the fitting results with a beam size of about 7.2 μm in the horizontal direction and about 6.4 μm in the vertical direction. Then, we adjusted the mirror and performed the edge scan each time. Finally, to accurately measure the beam size, 20 pulses per step were recorded and averaged to improve the SNR. Figure 8 shows the final result by fitting the differentiation of edge scan result with the Gaussian function. The beam size is about 2.2 μm × 2.5 μm (FWHM). Compared to the theoretical beam size, the horizontal beam size is slightly larger. The stability and figure errors of PM1, PM2 and horizontal focusing mirror ECM2 are the main factors to the horizontal beam size. The spot tilt is also a possible reason, which requires more experiments and analysis.
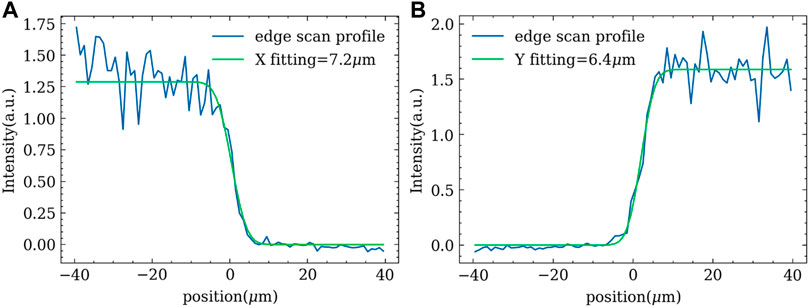
FIGURE 7. The edge scan result after silicon ablation imprint. (A) The horizontal beam size is 7.2 μm. (B) The vertical beam size is 6.4 μm.
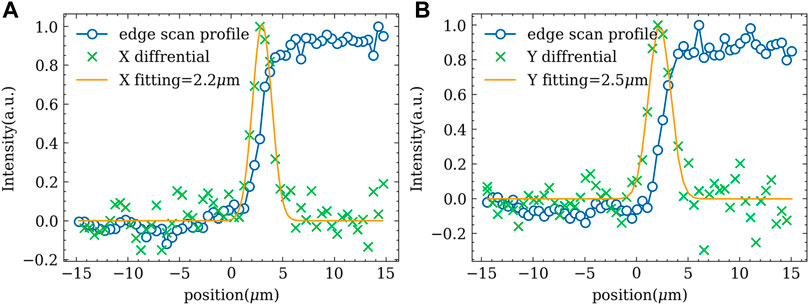
FIGURE 8. The final edge scan result. (A) The horizontal beam size is 2.2 μm. (B) The vertical beam size is 2.5 μm.
After the edge scan, the silicon ablation imprint was performed again. To examine the detailed profile and measure the accurate size of the crater, the silicon was removed from the vacuum chamber and imaged with a high NA microscope. Figure 9A shows a representative 4 by 4 silicon ablation imprint image. Figures 9B,C are the enlarged view of the red and blue rectangular area. The FEL pulse not only ablated the central region, but also destroyed the surrounding region. Spallation and cracks could be found around the crater. The size of the craters ranges from 6 to 10 μm, which is consistent with Figure 5. When the focus spot size is 2–3 μm, and the pulse energy is 10–100 μJ, the central ablation diameter is about 6–10 μm.
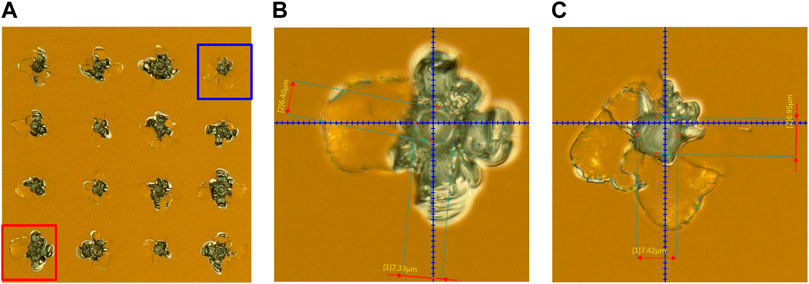
FIGURE 9. Image of the final silicon ablation imprint. (A) 4 by 4 silicon ablation imprint image. (B) Enlarged view of the red rectangular area. (C) Enlarged view of the blue rectangular area.
Conclusion
In this paper, the first commissioning results of the KB system at SXFEL were reported. A focused X-ray spot of 2.2 μm × 2.5 μm was achieved, which was characterized by edge scan and silicon ablation imprint. To obtain better focusing performance, three methods were used for the commissioning of the KB system at different stages. A large FOV camera was used for rough alignment in the first stage, and a rough estimation method of beam size was described. When the ratio of the maximum value to the neighbor value is 6, the FWHM beam size is about 1 pixel. Then the inline microscope was used to characterize the silicon ablation imprint. With the help of this method, the beam tilt was corrected. The beam was focused to about 8 μm. Finally, the method of edge scan was used for fine alignment. By adjusting the KB mirrors, the focal spot size of less than 3 μm was achieved. The final result was confirmed with the silicon ablation imprint. In the future, the wavefront sensor at the CSI endstation, which is being commissioned, will be optional for further alignment of KB mirrors and better focusing performance.
Data availability statement
The raw data supporting the conclusion of this article will be made available by the authors, without undue reservation.
Author contributions
ZL and HJ directed the project. HJ, JF, YT, and YN designed and installed the CSI endstation. ZG and JC designed and ran the beamline. CF, TL, HD, and BL designed and ran the accelerator parts. JF, YT, YN, ZG, XY, JZ, BH, DZ, HL, DL, MX, and PC performed the commissioning process. JF, XY, BH, and YT contributed to the sample preparation and sample measurement. YT, JF, ZG, and XY contributed to the data analysis. YT, JF, and HJ wrote the manuscript. All authors discussed the results and commented on the manuscript.
Funding
This work was supported by the Shanghai soft X-ray free-electron laser Beamline Projection. The research was funded by the Strategic Priority Research Program of Chinese Academy of Sciences (Grant No. XDB 37040303), the National Natural Science Foundation of China (Grant No. 21727817), and the major state basic research development program of China (2017YFA0504802).
Acknowledgments
The authors would like to acknowledge all the SXFEL engineering team for their enormous assistance and cooperation.
Conflict of interest
The authors declare that the research was conducted in the absence of any commercial or financial relationships that could be construed as a potential conflict of interest.
Publisher’s note
All claims expressed in this article are solely those of the authors and do not necessarily represent those of their affiliated organizations, or those of the publisher, the editors and the reviewers. Any product that may be evaluated in this article, or claim that may be made by its manufacturer, is not guaranteed or endorsed by the publisher.
References
1. Liu B, Feng C, Gu D, Gao F, Deng HX, Zhang M, et al. The sxfel upgrade: From test facility to user facility. Appl Sci (Basel) (2022) 12(1):176. ARTN 176. doi:10.3390/app12010176
2. Zhao ZT, Wang D, Gu Q, Yin LX, Gu M, Leng YB, et al. Status of the sxfel facility. Appl Sci (Basel) (2017) 7(6):607. ARTN 607. doi:10.3390/app7060607
3. Zhang X, Xiangyu M, Zhang X, Jin Z, Wang Y. Research on the influence of slope error on free-electron laser focusing spot. Nucl Tech (2020) 43(6):60101–060101. doi:10.11889/j.0253-3219.2020.hjs.43.060101
4. Raimondi L, Svetina C, Mahne N, Cocco D, Abrami A, De Marco M, et al. Microfocusing of the Fermi@Elettra fel beam with a K–B active optics system: Spot size predictions by application of the wise code. Nucl Instr Methods Phys Res Section A: Acc Spectrometers, Detectors Associated Equipment (2013) 710:131–8. doi:10.1016/j.nima.2012.11.039
5. Raimondi L, Svetina C, Mahne N, Cocco D, Capotondi F, Pedersoli E, et al. “Status of the K-B bendable optics at Fermi@Elettra fel,” in Proc. SPIE 9208, Adaptive X-Ray Optics III, 920804, San Diego, CA, September 17, 2014. doi:10.1117/12.2062326
6. Flöter B, Juranić P, Kapitzki S, Keitel B, Mann K, Plönjes E, et al. Euv hartmann sensor for wavefront measurements at the free-electron laser in hamburg. New J Phys (2010) 12(8):083015. doi:10.1088/1367-2630/12/8/083015
7. Khounsary A, Raimondi L, Svetina C, Mahne N, Cocco D, Capotondi F, et al. K-B bendable system optimization at Fermi@Elettra fel: Impact of different spatial wavelengths on the spot size. Adv X-Ray/EUV Opt Components (2013) 8848. doi:10.1117/12.2023024
8. Gerasimova N, Dziarzhytski S, Weigelt H, Chalupsky J, Hajkova V, Vysin L, et al. In situ focus characterization by ablation technique to enable optics alignment at an XUV FEL source. Rev Scientific Instr (2013) 84(6):065104. doi:10.1063/1.4807896
9. Yumoto H, Mimura H, Koyama T, Matsuyama S, Tono K, Togashi T, et al. Focusing of X-ray free-electron laser pulses with reflective optics. Nat Photon (2013) 7(1):43–7. doi:10.1038/Nphoton.2012.306
10. Chalupsky J, Juha L, Kuba J, Cihelka J, Hajkova V, Koptyaev S, et al. Characteristics of focused soft X-ray free-electron laser beam determined by ablation of organic molecular solids. Opt express (2007) 15(10):6036–43. doi:10.1364/Oe.15.006036
11. Kim J, Kim HY, Park J, Kim S, Kim S, Rah S, et al. Focusing X-ray free-electron laser pulses using kirkpatrick-baez mirrors at the nci hutch of the pal-xfel. J Synchrotron Radiat (2018) 25:289–92. doi:10.1107/s1600577517016186
12. Yumoto H, Koyama T, Matsuyama S, Kohmura Y, Yamauchi K, Ishikawa T, et al. Ellipsoidal mirror for two-dimensional 100-nm focusing in hard X-ray region. Sci Rep (2017) 7(1):16408. Epub 2017/11/29. doi:10.1038/s41598-017-16468-1
13. Matsuyama S, Inoue T, Yamada J, Kim J, Yumoto H, Inubushi Y, et al. Nanofocusing of X-ray free-electron laser using wavefront-corrected multilayer focusing mirrors. Sci Rep (2018) 8(1):17440. doi:10.1038/s41598-018-35611-0
14. Yumoto H, Inubushi Y, Osaka T, Inoue I, Koyama T, Tono K, et al. Nanofocusing optics for an X-ray free-electron laser generating an extreme intensity of 100 ew/Cm(2) using total reflection mirrors. Appl Sci (Basel) (2020) 10(7):2611. ARTN 2611. doi:10.3390/app10072611
15. Keitel B, Plonjes E, Kreis S, Kuhlmann M, Tiedtke K, Mey T, et al. Hartmann wavefront sensors and their application at flash. J Synchrotron Radiat (2016) 23:43–9. doi:10.1107/s1600577515020354
16. Berujon S, Ziegler E, Cojocaru R, Martin T “Development of a hard X-ray wavefront sensor for the EuXFEL,” in Proc. SPIE 10237, Advances in X-ray Free-Electron Lasers Instrumentation IV, 102370K, Prague, Czech Republic, 24 May 2017 (2017). doi:10.1117/12.2269452
17. Nagler B, Aquila A, Boutet S, Galtier EC, Hashim A, Hunter MS, et al. Focal spot and wavefront sensing of an X-ray free electron laser using ronchi shearing interferometry. Sci Rep (2017) 7, 13698. doi:10.1038/s41598-017-13710-8
18. Liu Y, Seaberg M, Zhu D, Krzywinski J, Seiboth F, Hardin C, et al. High-accuracy wavefront sensing for X-ray free electron lasers. Optica (2018) 5(8):967. doi:10.1364/optica.5.000967
19. Seaberg M, Cojocaru R, Berujon S, Ziegler E, Jaggi A, Krempasky J, et al. Wavefront sensing at X-ray free-electron lasers. J Synchrotron Radiat (2019) 26:1115–26. doi:10.1107/S1600577519005721
Keywords: x-ray optics, diagnostics, free electron laser, KB mirrors, beamline
Citation: Tong Y, Fan J, Nie Y, Guo Z, Gao Z, Yuan X, He B, Chen J, Zhang D, Luan H, Zhang J, Lu D, Xie M, Cheng P, Feng C, Liu T, Deng H, Liu B, Liu Z and Jiang H (2022) Kirkpatrick-Baez mirrors commissioning for coherent scattering and imaging endstation at SXFEL. Front. Phys. 10:977957. doi: 10.3389/fphy.2022.977957
Received: 25 June 2022; Accepted: 02 August 2022;
Published: 30 August 2022.
Edited by:
Qiushi Huang, Tongji University, ChinaReviewed by:
Manoj Tiwari, Raja Ramanna Centre for Advanced Technology, IndiaYinpeng Zhong, Institute of Advanced Science Facilities, Shenzhen, China
Copyright © 2022 Tong, Fan, Nie, Guo, Gao, Yuan, He, Chen, Zhang, Luan, Zhang, Lu, Xie, Cheng, Feng, Liu, Deng, Liu, Liu and Jiang. This is an open-access article distributed under the terms of the Creative Commons Attribution License (CC BY). The use, distribution or reproduction in other forums is permitted, provided the original author(s) and the copyright owner(s) are credited and that the original publication in this journal is cited, in accordance with accepted academic practice. No use, distribution or reproduction is permitted which does not comply with these terms.
*Correspondence: Huaidong Jiang, amlhbmdoZEBzaGFuZ2hhaXRlY2guZWR1LmNu
 Yajun Tong
 Jiadong Fan1
 Zichen Gao
 Difei Zhang
 Donghao Lu
 Chao Feng
 Tao Liu

