 M. A. Shukhtina
 V. A. Sergeev1
94% of researchers rate our articles as excellent or good
Learn more about the work of our research integrity team to safeguard the quality of each article we publish.
Find out more
BRIEF RESEARCH REPORT article
Front. Phys., 29 August 2022
Sec. Space Physics
Volume 10 - 2022 | https://doi.org/10.3389/fphy.2022.977286
Recently we proposed a spatio-temporal model of auroral absorption for isolated substorms based on linear prediction filter technique, which describes the precipitation effects as a sum of properly weighted and time-delayed contributions of short dipolarizations/injections inferred from magnetic MPB index. Here we apply a similar approach to a more general and practically important type of continuous activity including substorms clusters, which is accompanied by intense energetic electron precipitation lasting for many hours and may affect ozone concentration and climate. Unexpectedly, in spite of very different geophysical background, the derived precipitation response to unit-scale injection appeared almost identical to that obtained for isolated substorms. Significant part of absorption variance during active non-storm periods turns out to be the result of superposition of previous injections with short memory less than 4 h. Our results indicate that, while the injection efficiency is roughly the same, large difference in precipitated fluxes and ionospheric response between two different types of activity is mostly provided by a more frequent appearance and increased intensities of dipolarizations/injections during active periods. In both event types dipolarizations are the decisive factor which determines energetic electron precipitation.
Except for rare solar particle events, intense sporadic energetic electron precipitation (EEP) from the radiation belts controls the D-region ionization and other related effects in the auroral zone. Particularly, the auroral absorption (A) (or cosmic noise absorption, CNA) in the D region, suitably monitored by riometer network, is produced by precipitated energetic (∼30–300 keV) electrons [3,4]. EEP is formed by the combination of multiscale processes of particle energization and electron scattering to the loss cone in the magnetosphere, contributed by the wave-particle interactions, particle drifts and slow radial diffusion in the inner magnetosphere. Globally, the substorm-related particle injections are of special importance for EEP (e.g. [5–10]), though quantitative representation of their large-scale effects on substorm time scale still remains a challenge. There are a few basic reasons for that. The first is that substorms combine the processes of different time-scales and origins, including multiple minute-scale plasma injections from the tail, hour-scale magnetic drifts in the inner magnetosphere and more slow modulations of outer radiation belt content etc. Secondly, substorm-related precipitation and ionization display a complicated spatial dynamics, which combines the elements of ordered and irregular behavior. Thirdly, a difficult problem is the choice of easily-available injection proxies suitable to organize data and perform empirical modeling and practical applications.
Recently a new empirical approach was suggested (see [1], hereafter Paper 1, and [11]) to reconstruct the dynamical pattern of electron precipitation during substorms of different complexity and intensity. Its core elements are: (1) choice of substorm injection as basic process whose intensity is evaluated based on dipolarization amplitude; (2) choice of midlatitude MPB index [12] as dipolarization proxy to drive the model; (3) use of linear prediction filter (LPF) technique (e.g. [13]) to reconstruct the response to unit-scale injection and, then, obtain the global response by summation of properly weighted and time-delayed contributions of particular injections. This approach was realized and successfully tested in Paper 1 for a collection of 220 isolated substorms using riometers in the middle of auroral zone (at Corrected Geomagnetic Latitudes, CGL ∼670), and later these response functions were confirmed approximately valid for CGL between 630 and 690 [11].
However, it is yet unclear whether the obtained response functions and the approach itself may be effectively applied during disturbed conditions. Indeed, a number of studies claim that magnitudes of substorm-associated energetic electron precipitation and auroral absorption depend on the preceding activity ranging from hours up to several days [2,14–19]. Particularly, some reports state that substorm clusters (also known under the names of recurrent substorms, compound substorms, etc.) show significantly larger flux increases than single substorm events do [2]. Whether this might be related to long memory of radiation belt fluxes, or larger efficiency, or intensity, or frequency of substorm injections - remains unclear. This problem is addressed in our brief research report.
Our aim here is to derive empirical response functions for the auroral absorption and test the LPF approach during long active periods containing clustered substorms during non-storm times. Starting from Tsurutani and Gonzales [20] this class of disturbances attracted large attention, because of their appearance during high-speed solar wind streams (HSS) and stream interaction regions and remarkable association with the major radiation belt flux increases [21,22] and EEP enhancements [14,15,23]. According to [23] “On average, the flux of >30 keV electrons is enhanced by a factor of ∼10 during the passage of the high-speed stream at all geographic longitudes”, which explains their importance for space weather and climate [24]. Particularly, Seppala et al. [25] presented numerical simulations to show that such substorm clusters can affect ozone concentration in the atmosphere. By comparing the response functions derived during active conditions with those previously reconstructed for isolated substorms we can compare their efficiencies in these strongly different geophysical conditions and discuss the role of injections and ‘long memory’ in energetic electron precipitation.
Like in Paper 1, we derive the function of energetic electron precipitation response to the unit scale injection by comparing the time series of ‘injection amplitude’ ΔTi and cosmic noise absorption Ai, both taken at 5 min resolution. Based on close coupling between substorm injections and dipolarizations in the magnetosphere [10,26,27], we use midlatitude MPB index to characterize the injection strength. Originally MPB (measured in nT2) was designed by [12] as a proxy of the ground effect of current in dipolarization-related substorm current wedge (SCW). At the time ti we regard the difference ΔTi = MPB1/2 (ti+5min)- MPB1/2 (ti) as a measure of concurrent elementary injection (negative differences are replaced by zeroes).
Similar to Paper1, CNA value Ai at each time ti was presented as a sum of responses to all injections in the interval (ti-4h, ti+1 h), the subsequent hour being kept for accuracy control:
where j = i + k-12.
To facilitate comparisons with results of Paper 1 where the response functions were obtained in the coordinate system rotating with the station, here we use a similar approach. Specifically, a sequence of 60 absorption values Ai was considered for each injection. However, if in Paper 1 for each day and for particular riometer we treated only one sequence in which the station was inside the particular 2-h MLT bin at the substorm onset t0, now we regard all sequences corresponding to each of 24 5-min tis in this 2-h bin. When taking 1 h before this interval and 4 hours after we obtain a sequence of 84 rows (like Equation 1) to the matrix equation system. In total, the matrix ΔT and vector A include contributions from all active days at our disposal.
After solving the matrix equation A = ΔT • F we obtain the desired linear prediction filter F (LPF, or the response function), which characterizes the contributions to Ai from unit scale injections ΔTj distributed in time between ti-4h and ti+1 h. The LPF is constructed separately for each riometer and for each 2 h-wide MLT bin of riometer location.
For this study we mainly use observations from riometers of the Canadian N-S Churchill line covering the latitudes from Pinawa (CGL∼60.2o) till Rank (72.5o), with an emphasis laid on ISL riometer (63.8o) in the middle of auroral zone (see Supplementary Figure S1).
The collection of active intervals was selected visually based on AL records during years 2003–2005. Their duration varied from 7 h to 4 days, each containing a number of AL activations (at least three substorms separated by less than 3 hours) exceeding 500 nT in absolute magnitude. Solar particle events and large storms were excluded. Stack plots of AL and SYMH indexes in Figure 1C, D give an overview of this activity, which was accompanied by rather intense auroral absorption shown by the black trace of ISL riometer record in panel A. Only 11 longest active intervals covering the full days without big gaps in ISL data are shown for illustration in Figure 1. The difference between active time dataset and isolated substorms dataset is very significant. (For comparison given below, we use 15 full days of CNA data from our data base for isolated substorms referred to the 8–10 MLT sector, not shown.) The daily medians are: |AL| = 294 vs 20 nT, SYMH = −36 nT vs −10nT, IMFBz = −1.3 nT vs −0.1nT, solar wind velocity 575 km/s vs 370 km/s, these values being rather typical for continuous active conditions according to Partamies et al. [17] and Meredith et al. [23]. According to statistical results of [28] a 25 nT decrease in SYMH causes the oval expansion by 1.90 which approximately corresponds to oval center displacement from GIL to ISL (by 2.50).
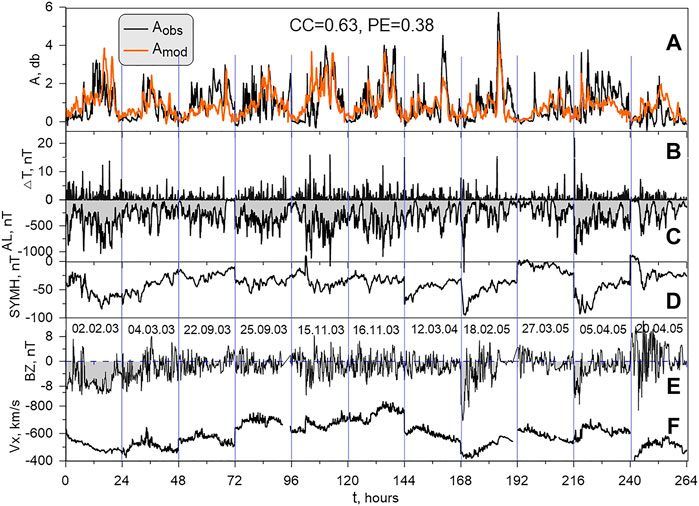
FIGURE 1. Stack plots of variables during selected 11 full-day active periods at 5 min resolution. From top to bottom: (A)-absorption values observed at ISL (black) compared with predicted absorption values (orange trace); (B)- dipolarization intensity estimated from MPB index, used to drive the model; (C,D) AL and SYMH indices for these days; (E)- IMF BZ, (F)- solar wind velocity. Dates are indicated in panel (E).
An overview of response functions F for Churchill line riometers is presented in Figure 2 for the morning - pre-noon MLT sector, which is known as the statistical region of most strong absorption [3,14]. Similar results for other MLT sectors are presented in Supplementary Figures S2, S3. Thick grey curves (marked as iSBS in the legend) show the LPFs obtained for isolated substorms in Paper 1 at stations in the middle of auroral zone (∼670). These iSBS response functions are most similar to the active time LPFs obtained in the middle of expanded auroral zone, like Gil (blue, at 66.30) and, especially, ISL (red, at 63.80). The latter one shows the largest LPF magnitude and the best correlation (between observed and predicted absorption values, see CC in the legend) among all Churchill line riometers except Pinawa. Note that the correlations for ISL and Pinawa are almost the same (just a little lower) as for iSBS. The agreement also includes similar shapes and consistent time delays. We specially emphasize a similar time delay progressing with the MLT, which is connected with the eastward drift of injected energetic electrons and, therefore, nicely illustrates the injection-related origin of response functions reconstructed by the LPF method.
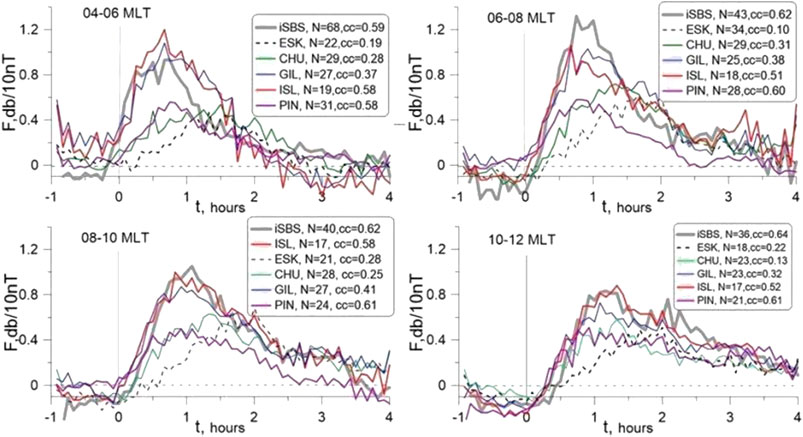
FIGURE 2. Response functions for active periods in the pre-noon sector at different Churchill line riometers (colored lines) together with response function for isolated substorms (thick grey line, from Paper1) in the middle of auroral zone. The number of intervals used in the LPF derivation (N) and correlation coefficient (cc) between predicted and observed absorption values are shown in the legend. t corresponds to the time delay after contributing dipolarization.
An important feature of active periods concerns the subauroral station (PIN, CGL = 60.20), whose response function is well-phased with ISL response although the peak magnitude is ∼1.5 times lower. Its predicted absorption values show a good correlation with the observed ones. Accordingly, the EEP displays a rather regular and predictable behavior in the equatorward half of the oval. By the contrast, at poleward stations (CHU and ESK with CGLs 68.60 and 70.80) the LPF peak amplitude is still significant, but the correlation falls down. Also the peak response is progressively delayed, by ∼1 h at ESK compared to the middle of auroral oval. The RAN (72.50) filters are not shown, as they demonstrate very low LPF magnitudes and negligible predictability, as expected close to the poleward termination of EEP precipitation region.
Figure 3 shows the ISL response functions derived from the dataset of active periods. When the ISL data are scarce, we also added MCM riometer data (CGL 64.30, almost the same as for ISL but at different longitude), to characterize the LPF variability. Besides N and cc in the legend (the same as in Figure 2) the correlation coefficients between these LPFs for iSBS and for active times are also shown near the top of vertical line at t = 0. As a rule, the shapes and delays are similar for these two datasets, but the amplitude may somewhat differ for some MLT bins. Comparing to the response functions for isolated substorms (grey curves), we confirm their similarity in LPF shape, delay, and magnitude while both of them show significant changes with the MLT. The difference between active and isolated substorms datasets is generally comparable to the differences between ISL and ISL + MCM datasets, most probably, being of statistical origin. Within this margin no systematic significant differences are discovered in the injection response functions between continuous activity including substorm clusters and the isolated substorms developing on quiet background.
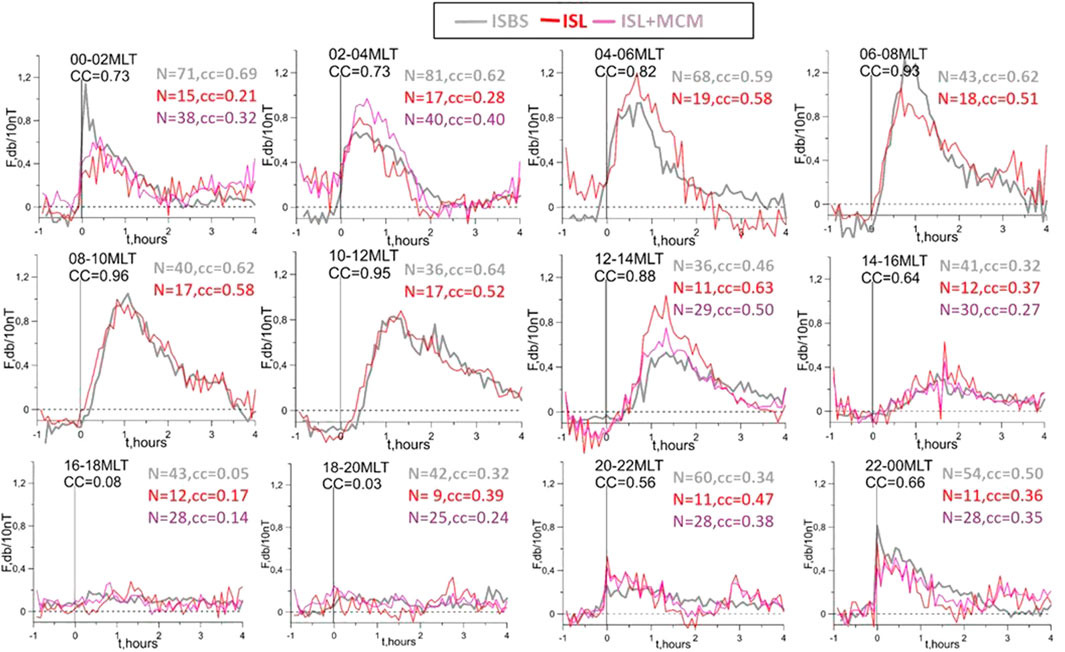
FIGURE 3. Summary of response functions reconstructed for isolated substorms (at ∼67o CGL) and for active period (at ∼64o) in all MLT bins. Besides N and cc in the legend (the same as in Figure 2) the correlation coefficients between LPFs for iSBS and for active times are also shown near the top of vertical line at t = 0.
As regards the latitudinal differences in other MLT sectors (see Supplementary Figures S2, S3), they are mostly similar to those found in the pre-noon sector. In particular, in the near-midnight sector where a second absorption peak is observed in statistical distributions [6,14], most of abovementioned conclusions about latitudinal variations hold true, although the correlation is lower than in the pre-noon sector. Similar results were also obtained for isolated substorms, e.g., [11]. We believe, that lower correlation reflects a more variable and structured precipitation in the nightside sector as have been documented in previous studies (e.g. [7]).
Finally, the LPFs for all MLT bins have been used to reconstruct the auroral absorption based on dipolarizations inferred from the MPB index, which is shown in Figure 1B. The result is illustrated in panel A. As seen from comparison of predicted and observed auroral absorption, during the variable active periods many sharp precipitation peaks are reproduced by the model, together with the slower but significant variations of precipitation background. The prediction quality metrics for the entire 11 - day period are CC = 0.63 and PE = 0.38, which is a reasonably high level taking into account high (5 min) temporal resolution. During another, 5-days-long active period containing ∼60 substorms (previously considered also by [8,25]), a similar level of CC and PE values have been obtained in Nikolaev et al. [11] (see their Figure 4) using response functions derived for isolated substorm dataset. This may serve as independent test of our results. Whereas there are still some peaks in Figure 1A which are not reproduced by the model, so detailed case study analysis of their origin requires future efforts.
1) We constructed linear prediction filters (LPFs, or response functions) linking auroral absorption with the properly weighted and time-delayed short dipolarization (as given by (MPB)1/2 increments taken on 5min timescale) for long-duration active conditions. Such activity is characterized by continuously disturbed auroral zone (daily median |AL| of 300 nT), moderate ring current (-SYMH of a few tens of nT), occurs during fast solar wind episodes, with V > 550 km/s and negative (fluctuating) IMF BZ, and includes substorm clusters. The MLT pattern of LPFs reproduces well-known morphological features such as the main pre-noon and secondary nightside precipitation maxima as well as wide evening minimum. The largest response amplitude occurs in the middle of auroral zone (64-65oCGLat), here and at equatorward stations the response is more regular and predictable, as different from the poleward half of auroral oval. The precipitation response function definitely characterizes the substorm injections: it is controlled by the nightside dipolarizations (by the construction), and the major EEP dynamics is consistent with the eastward drift of precipitating energetic electron cloud. The latter was firmly established in previous conjugate observations in the ionosphere and magnetosphere [5,7,29] and from analyses of eastward drift of auroral absorption events [4].
2) Response functions obtained during isolated substorms and those derived for active periods are very similar in their shapes, time delays and magnitudes, if we compare the results obtained in the middle of auroral oval (in the middle of expanded oval at ∼64–650 during active periods and at ∼670 CGLat during isolated substorms on quiet background). This has a few important implications. First, this consistence indicates the robustness of LPF procedure and of the derived response functions; consistence between LPFs obtained in different regions and for different instruments, e.g. LPFs for auroral absorption measured in Canada and for D-region ionization measured by the EISCAT radar has been demonstrated by Stepanov et al.[30], see their Figure 3. Secondly, the approximate “universality” of response functions is a good news for practical applications of LPF method for prediction of precipitation dynamics.
3) Not only the LPFs are surprisingly stable, their prediction quality is roughly the same for both activity types considered. Currently the auroral absorption for both isolated and clustered substorms can be predicted at the level of CC∼0.65 and PE about 0.3–0.4 (i.e., 30–40% of precipitated flux variance is predicted). Although these numbers formally do not look as a great result, we remind that this was obtained for 5min resolution data, whereas only 70% of variance in the global EEP flux can be predicted on daily scale by the recent models [19]. Also, besides the dipolarization (substorm current wedge) intensity which is reflected in the MPB index, the peak magnitude of auroral absorption substantially depends on the wedge width [11] which is not taken into account in our modeling. We also have to remind about inherent structuredness and variability of the electron precipitation (e.g. [31]) which limit the level of possible prediction. In Paper 1 we showed that correlation between CNA measured by identical facilities at two neighboring stations is ∼0.7 (Figure 2C of Paper 1). With these comments the obtained prediction quality can be evaluated rather optimistically.
4) The abovementioned results may have interesting physical implications. By its construction, the LPF response function amplitude represents the efficiency of unit scale dipolarization/injection in producing the EEP. Surprising stability of the response magnitudes during quiet (isolated substorms) and disturbed (active period including the substorm clusters) conditions implies that injection efficiency stays roughly the same. This may suggest that the enhanced occurrence frequency or/and injection amplitudes are the main factors which provide the large enhancement of energetic electron precipitation during continuously active periods, compared to the isolated substorms occurring on quiet background. We emphasize that not only absorption peaks, but also relatively long-duration variations of the auroral absorption seen in Figure 1A are reproduced by the cumulative effect of substorm injections with the response function having a short memory (3–4 h).
These observations raise a question concerning the role of ‘long memory’ effects on the EEP intensity which has been widely discussed in the recent literature [2,14,15,17–19].
Whereas the outer radiation belt (ORB) content undoubtedly changes by the orders of magnitude and relaxes on the timescale of days (e.g. [32]), we believe that the energy range and the actual source of the injected electrons are important factors to be considered when discussing the problem. As regards the energetic electrons trapped in the ORB and inner plasma sheet region (6-10 Re), it was shown that the memory of the past acceleration can be relatively long (days) for relativistic electrons, whereas it is much shorter (hours) for the 30–100 keV electrons with important remark that the memory decreases with the increasing distance (e.g. [18,33,34]). The energy range 30–100 keV of precipitated electrons is responsible for the bulk of auroral absorption effects. As concerns the source region, the injected electrons can either come from the plasma sheet (be transported with the BBFs and accelerated) or be taken from the outer radiation belt population, penetrate through the flank part of BBF and be additionally accelerated during flow braking stage (e.g. [35]). In the first case the influence of long-term variations of the ORB content may be minimal.
Recently Nikolaev et al. [11] included the expected ORB fluxes when investigating the factors controlling the peak amplitude of the auroral absorption during substorms. Indeed, they found some influence which appeared to be a secondary factor after the intensity and azimuthal width of the substorm current wedge. Further investigations are required to clarify this problem.
To conclude, for long active periods containing the substorm clusters we derived the response functions characterizing the dipolarization/injection-related component of energetic electron precipitation from the Canadian riometer data. The response functions are robustly reconstructed, they appeared to be surprisingly similar to the ones derived for isolated substorms during relatively quiet periods. Long-duration intense electron precipitation appears to be reproduced by the cumulative effect of substorm injections using only short memory (4 h) response functions.
Our results indicate that, while the injection efficiency is roughly the same, large difference in precipitated fluxes and ionospheric response between two different types of activity is mostly provided by a more frequent appearance and increased intensities of dipolarizations/injections during active periods.
Publicly available datasets were analyzed in this study. This data can be found here: University of Calgary Space Physics Data portal (http://data.phys.ucalgary.ca/sort_by_project/GO-Canada/GO-Rio/txt), Solar wind data and activity indices are available from https://omniweb.gsfc.nasa.gov/.
MS conceived the idea of this paper, processed the data, wrote/edited the text. VS set the problem, contributed to the idea and wrote/edited the text. DR was responsible for the quality check and reprocessing of riometer absorption data.
This research was supported by Russian Science Foundation grant N 22–27-00169.
UofC Space Physics Data Portal activity was undertaken with the financial support of the Canadian Space Agency. The riometer data are available via https://data-portal.phys.ucalgary.ca/go_rio/.
The authors declare that the research was conducted in the absence of any commercial or financial relationships that could be construed as a potential conflict of interest.
All claims expressed in this article are solely those of the authors and do not necessarily represent those of their affiliated organizations, or those of the publisher, the editors and the reviewers. Any product that may be evaluated in this article, or claim that may be made by its manufacturer, is not guaranteed or endorsed by the publisher.
The Supplementary Material for this article can be found online at: https://www.frontiersin.org/articles/10.3389/fphy.2022.977286/full#supplementary-material
1. Sergeev VA, Shukhtina MA, Stepanov NA, Rogov DD, Nikolaev AV, Spanswick E, et al. Toward the reconstruction of substorm-related dynamical pattern of the radiowave auroral absorption. Space Weather (2020) 18:e2019SW002385. doi:10.1029/2019SW002385
2. Rodger CJ, Cresswell‐Moorcock K, Clilverd MA. Nature's Grand Experiment: Linkage between magnetospheric convection and the radiation belts. J Geophys Res Space Phys (2016) 121:171–89. doi:10.1002/2015JA021537
3. Hargreaves JK. Auroral absorption of HF radio waves in the ionosphere: A review of results from the first decade of riometry. Proc IEEE (1969) 57(8):1348–73. doi:10.1109/proc.1969.7275
4. Kellerman AC. Trapped electron energy inferred from cosmic noise absorption signals through drift-time analysis in empiricalelectric and semi-empirical magnetic fields. JGR Space Phys (2021) 126:e2020JA028887. doi:10.1029/2020JA028887
5. Parks GK. The acceleration and precipitation of Van Allen outer zone energetic electrons. J Geophys Res (1970) 75(19):3802–16. doi:10.1029/JA075i019p03802
6. Berkey FT, Driatskiy VM, Henriksen K, Hultqvist B, Jelly DH, Shchuka TI, et al. A synoptic investigation of particle precipitation dynamics for 60 substorms in IQSY (1964–1965) and IASY (1969). Planet Space Sci (1974) 22(2):255–307. doi:10.1016/0032-0633(74)90028-2
7. Spanswick E, Donovan E, Friedel R, Korth A. Ground based identification of dispersionless electron injections. Geophys Res Lett (2007) 34:L03101. doi:10.1029/2006GL028329
8. Beharrell MJ, Honary F, Rodger CJ, Clilverd MA. Substorm-induced energetic electron precipitation: Morphology and prediction. J Geophys Res Space Phys (2015) 120:2993–3008. doi:10.1002/2014JA020632
9. Turner DL, Fennell JF, Blake JB, Claudepierre SG, Clemmons JH, Jaynes AN, et al. Multipoint observations of energetic particle injections and substorm activity during a conjunction between Magnetospheric Multiscale (MMS) and Van Allen Probes. JGR Space Phys (2017) 122(11):504. 481–11. doi:10.1002/2017JA024554
10. Gabrielse C, Spanswick E, Artemyev A, Nishimura Y, Runov A, Lyons L, et al. Utilizing the Heliophysics/Geospace System Observatory to understand particle injections: Their scale sizes and propagation directions. JGR Space Phys (2019) 124:5584–609. doi:10.1029/2018JA025588
11. Nikolaev AV, Sergeev VA, Shukhtina MA, Spanswick E, Rogov DD, Stepanov NA. Study of substorm-related auroral absorption: Latitudinal width and factors affecting the peak intensity of energetic electron precipitation. JGR Space Phys (2021) 126:e2021JA029779. doi:10.1029/2021JA029779
12. McPherron RL, Chu X. The mid-latitude positive bay and the MPB index of substorm activity. Space Sci Rev (2017) 206:91–122. doi:10.1007/s11214-016-0316-6
13. Baker DN, McPherron RL, Cayton TE, Klebesadel RW. Linear prediction filter analysis of relativistic electron properties at 6.6 RE. J Geophys Res (1990) 95(A9):15133–40. doi:10.1029/JA095iA09p15133
14. Kavanagh AJ, Honary F, Donovan EF, Ulich T, Denton MH. Key features of >30 keV electron precipitation during high speed solar wind streams: A superposed epoch analysis. J Geophys Res (2012) 117:A00L09. doi:10.1029/2011JA017320
15. Grandin M, Aikio AT, Kozlovsky A, Ulich T, Raita T. Cosmic radio noise absorption in the high-latitude ionosphere during solar wind high-speed streams. J Geophys Res Space Phys (2017) 122:5203–23. doi:10.1002/2017JA023923
16. Rodger CJ, Hendry AT, Clilverd MA, Forsyth C, Morley SK. Examination of radiation belt dynamics during substorm clusters: Activity drivers and dependencies of trapped flux enhancements. JGR Space Phys (2022) 127:e2021JA030003. doi:10.1029/2021JA030003
17. Partamies N, Tesema F, Bland E, Heino E, Nesse Tyss_y H, Kallelid E. Electron precipitation characteristics during isolated, compound, and multi-night substorm events. Ann Geophys (2021) 39:69–83. doi:10.5194/angeo-39-69-2021
18. Stepanov NA, Sergeev VA, Sormakov DA, Andreeva VA, Dubyagin SV, Ganushkina N, et al. Superthermal proton and electron fluxes in the plasma sheet transition region and their dependence on solar wind parameters. J Geophys Res Space Phys (2021) 126:e2020JA028580. doi:10.1029/2020JA028580
19. Tyssøy HN, Partamies N, Babu EM, Smith-Johnsen C, Salice J. The predictive capabilities of the auroral electrojet index for medium energy electron precipitation. Front Astron Space Sci (2021) 8:714146. doi:10.3389/fspas.2021.714146
20. Tsurutani BT, Gonzalez WD. The cause of high-intensity long-duration continuous AE activity (HILDCAAs): Interplanetary alfven wave trains. Planet Space Sci (1987) 35:405–12. doi:10.1016/0032-0633(87)90097-3
21. Borovsky JE, Denton MH. Differences between CME-driven storms and CIR-driven storms. J Geophys Res (2006) 111:A07S08. doi:10.1029/2005JA011447
22. Kilpua EKJ, Hietala H, Turner DL, Koskinen HEJ, Pulkkinen TI, Rodriguez JV, et al. Unraveling the drivers of the storm time radiation belt response. Geophys Res Lett (2015) 42:3076–84. doi:10.1002/2015GL063542
23. Meredith NP, Horne RB, Lam MM, Denton MH, Borovsky JE, Green JC. Energetic electron precipitation during high-speed solar wind stream driven storms. J Geophys Res (2011) 116:A05223. doi:10.1029/2010JA016293
24. Rozanov E, Calisto M, Egorova T, Peter T, Schmutz W. Influence of the precipitating energetic particles on atmospheric chemistry and climate. Surv Geophys (2012) 33(3):483–501. doi:10.1007/s10712-012-9192-0
25. Seppala A, Clilverd MA, Beharrell MJ, Rodger CJ, Verronen PT, Andersson ME, et al. Substorm-induced energetic electron precipitation: Impact on atmospheric chemistry. Geophys Res Lett (2015) 42:8172–6. doi:10.1002/2015GL065523
26. Turner DL, Fennell JF, Blake JB, Clemmons JH, Mauk BH, Cohen IJ, et al. Energy limits of electron acceleration in the plasma sheet during substorms: A case study with the magnetospheric multiscale (mms) mission. Geophys Res Lett (2016) 43:7785–94. doi:10.1002/2016GL069691
27. Nagai T, Shinohara I, Singer HJ, Rodriguez J, Onsager TG. Proton and electron injection path at geosynchronous altitude. J Geophys Res Space Phys (2019) 124:4083–103. doi:10.1029/2018JA026281
28. Milan SE, Hutchinson J, Boakes PD, Hubert B. Influences on the radius of the auroral oval. Ann Geophys (2009) 27:2913–24. doi:10.5194/angeo-27-2913-2009
30. Stepanov NA, Sergeev VA, Shukhtina MA, Ogawa Y, Chu X, Rogov DD. Ionospheric electron density and conductance changes in the auroral zone during substorms. J Geophys Res Space Phys (2021) 126:e2021JA029572. doi:10.1029/2021JA029572
31. Makarevitch RA, Honary F, McCrea IW, Howells VSC. Imaging riometer observations of drifting absorption patches in the morning sector. Ann Geophys (2004) 22:3461–78. doi:10.5194/angeo-22-3461-2004
29. Kavanagh AJ, Kosch MJ, Honary F, Senior A, Marple SR, Woodfield EE, McCrea IW. The statistical dependence of auroral absorption on geomagnetic and solar wind parameters. Ann Geophys (2004) 22:877–87. doi:10.5194/angeo-22-877-2004
32. Claudepierre SG, Ma Q, Bortnik J, O'Brien TP, Fennell JF, Blake JB. Empirically estimated electron lifetimes in the Earth's radiation belts: Van Allen Probe observations. Geophys Res Lett (2020) 47:e2019GL086053. doi:10.1029/2019GL086053
33. Boynton RJ, Balikhin MA, Billings SA, Reeves GD, Ganushkina N, Gedalin M, et al. The analysis of electron fluxes at geosynchronous orbit employing a NARMAX approach. J Geophys Res Space Phys (2013) 118:1500–13. doi:10.1002/jgra.50192
34. Denton MH, Taylor MGGT, Rodriguez JV, Henderson MG. Extension of an empirical electron flux model from 6 to 20 Earthradii using Cluster/RAPIDobservations. Space Weather (2019) 17:778–92. doi:10.1029/2018sw002121
Keywords: energetic electron precipitation, substorms, dipolarizations, injections, linear prediction filters
Citation: Shukhtina MA, Sergeev VA and Rogov DD (2022) Dipolarization-induced energetic electron precipitation during continuously active periods and isolated substorms. Front. Phys. 10:977286. doi: 10.3389/fphy.2022.977286
Received: 24 June 2022; Accepted: 01 August 2022;
Published: 29 August 2022.
Edited by:
Mike Lockwood, University of Reading, United KingdomReviewed by:
Yusuke Ebihara, Kyoto University, JapanCopyright © 2022 Shukhtina, Sergeev and Rogov. This is an open-access article distributed under the terms of the Creative Commons Attribution License (CC BY). The use, distribution or reproduction in other forums is permitted, provided the original author(s) and the copyright owner(s) are credited and that the original publication in this journal is cited, in accordance with accepted academic practice. No use, distribution or reproduction is permitted which does not comply with these terms.
*Correspondence: M. A. Shukhtina, bWFyaWEuc2h1a2h0QGdtYWlsLmNvbQ==
Disclaimer: All claims expressed in this article are solely those of the authors and do not necessarily represent those of their affiliated organizations, or those of the publisher, the editors and the reviewers. Any product that may be evaluated in this article or claim that may be made by its manufacturer is not guaranteed or endorsed by the publisher.
Research integrity at Frontiers
Learn more about the work of our research integrity team to safeguard the quality of each article we publish.