- 1Shenzhen Key Laboratory of Marine IntelliSensing and Computation, Institute for Ocean Engineering, Shenzhen International Graduate School, Tsinghua University, Shenzhen, China
- 2Guangdong Research Center of Polarization Imaging and Measurement Engineering Technology, Institute of Biopharmaceutical and Health Engineering, Shenzhen International Graduate School, Tsinghua University, Shenzhen, China
The convergent illuminating beam is the key factor during the individual measurement of suspended particles in aquatic suspensions. When the illuminating beam propagates in the suspension, the particle scattering in the optical path may destroy the convergence of the illuminating beam, especially in suspensions with a high particle concentration. In this paper, using the Monte Carlo simulation, the convergence of the illuminating beam is investigated by changing the physical properties of particles, such as size and concentration, and the optical path length of the illuminating beam. A dimensionless quantity, as the product of the scattering coefficient of suspension and the optical path length, is found to determine the achievement of the convergent beam. Moreover, an individual measurement setup based on the convergence of the illuminating beam is used to measure polystyrene microspheres with different concentrations. The experiment results are consistent with those of the simulations. Furthermore, improvement strategies are proposed and proved to effectively keep the convergence of the illuminating beam in turbid water. The results in this work can provide clues for designing a similar optical apparatus used in aquatic environment monitoring.
Introduction
Suspended particles are the vital components of the natural water ecosystem, and they play an important role in the biogeochemical exchanges, ecological balance, and carbon cycling [1, 2]. Different suspended particles have different backscattering characteristics and potential contributions, which can affect the analysis and interpretation of remote sensing [3]. Indeed, there are many kinds of suspended particles mixed in natural water. The standard method of particle analysis always employs microscopy examination or molecular analysis [4, 5]. These methods generally need to transfer samples to the laboratory for manual inspection, leading to low time resolution and a relatively long analysis time. In addition, the detail of interactions occurring in the water ecosystem may lose during the laboratory experiments [5]. Therefore, it is highly significant to achieve the in situ fine classifications of suspended particles and further investigate their temporal and spatial variations [6].
The optical scattering technique is extensively used in the in situ detection of the suspended particles in the aquatic suspensions due to the non-invading and high resolution. A turbidimeter is used to measure the degree to which the suspension obstructs the propagation of light beam and further to evaluate the water quality, which is based on the side scattering measurement of the suspension [7]. Scattering of the suspension has a directional variability quantitatively described by the volume scattering function (VSF), and the commercial product, LISST-VSF, can achieve underwater measurements of VSF [8]. Moreover, the particle backscattering coefficient can be obtained using ECO-BB9 [9]. However, for these probers, the scattering volume is a little far from the illuminating and receiving interfaces, which means that the light has to propagate a certain distance in the suspension before and after the scattering in the scattering volume. The scattering on these optical paths would change the direction of the light, which leads to an underestimate of the size of the scattering volume, especially for the suspensions with a high particle concentration. Many researchers have investigated the influences of different scattering coefficients in the propagation of parallel light by Monte Carlo simulation [10, 11]. However, there are few reports on the propagation of the convergent light beam in the suspensions.
Recently, a polarized light scattering technology (PLST) has been developed and is used to achieve the in situ fine classifications of suspended particles [12–14]. The PLST can non-destructively monitor the physiological state changes of algal cells [13, 14], which can provide a powerful tool for the management of harmful blooms. Also, an underwater prototype based on the PLST has been developed, and it has successfully achieved the monitoring of particle changes in natural water [12]. However, the PLST needs the convergent beam obtained by the lens to illuminate the target particle, and this is a common obstacle in practical applications. First, the convergent beam enables the high-density energy to illuminate the particle to obtain the signals with a high signal-to-noise ratio (SNR). Second, the convergent beam limits the scattering volume and ensures the individual measurement of suspended particles [14]. However, similar to the optical tools mentioned above [7–9], the convergence of the beam suffers from particle scattering in water, which would possibly limit the application of the PLST. It is necessary to investigate the convergent light beam which is subjected to the constraints of the suspension’s physical properties and the measurement manner. Furthermore, the practical strategy to broaden the application of the PLST is desired.
In this paper, the convergence of the illuminating beam in the particle suspension is investigated. The influences of physical properties of the particles, such as size, concentration, and the optical path, on the convergent beam are explored based on Monte Carlo simulation. Furthermore, experiments on suspensions with different particle concentrations are conducted by using the individual measurement setup. The linearity of the particle concentration and the measured particle number, and the low level of the measured background are two indicators of the individual measurement setup. Experiment results are quite consistent with the simulation results. In addition, a dimensionless quantity, the product of the scattering coefficient and the optical path length, is shown to unite the influence factors, which gives the criterion to access the convergence of the beam. Finally, the improvement strategies based on these results to improve the setup are proposed, and the experimental results encourage us to apply the strategies to promote the application of the individual measurement of suspended particles in turbid water.
Methods
Experimental setup
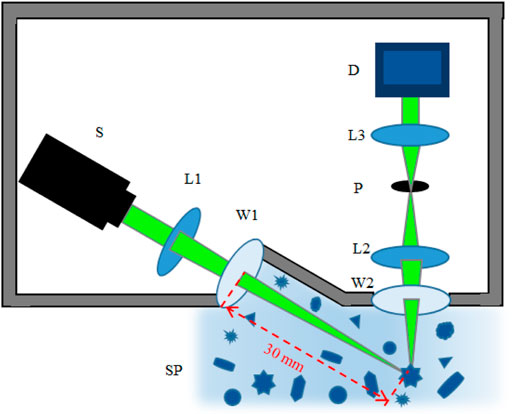
The schematic diagram of the experimental setup is shown in Figure 1, which can individually measure the scattered light of suspended particles [12]. The 520 nm continuous wave laser (S) is used as the illuminating light source with a 4 mm diameter beam size and a 0.7 W maximal output power. The illuminating light beam passes through the lens (L1) and the transparent window (W1) and then is focused into a small spot at the focal point. Such a convergent beam effectively enlarges the energy density of the light illuminated on the individual particles in the sample pool (SP). The suspension is stirred by a magnetic stirrer to keep the particles suspended. Particularly, the distance between the focal spot and W1 is about 30 mm, shown as the red dashed line. Once the suspended particle passes through the convergent beam in SP, it will be illuminated. Only the scattered light of the particles in the detection volume can pass through the receiving optical system which consists of the other transparent window (W2), the lens 2 (L2), and a 100-micron pinhole (P). The detection volume and the pinhole are an object–image relationship. Behind the pinhole, there is a short focal length lens (L3) to convert the scattered light to a parallel light beam before entering the photo detector (D). Note that both the illuminating beam and received light suffer from the scattering in the suspension when they respectively propagate after W1 and before W2.
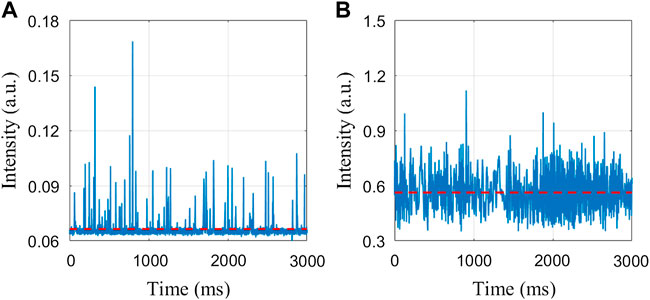
In the individual measurement, if a single suspended particle passes through the scattering volume, which is determined by the focal spot and the detection volume, its scattered light contributes to the signal. When there are no particles in the scattering volume, the electronic noise, environmental light, and the scattering of water will contribute to the background, but the background is much smaller than the signal. Therefore, the signals are a series of temporal pulses. Furthermore, we can calculate the number of suspended particles in unit time, which should be linear with the concentration of the particles in the suspensions for the individual measurement. Meanwhile, the low level of the background is also an effective indicator of the individual measurement. Otherwise, if the scattering volume is too big or the concentration of the particles is too high, there is at least one particle in the scattering volume, which means that the background would be high and there would be no obvious temporal pulse.
Computing and analytical methods
The effective scattering cross-section (
Moreover, the scattering coefficient (
Generally, the achievement of convergent beam mainly depends on
Results
Measurement of suspensions in different concentrations
To check the influence of the particle concentration on the convergence of light beam and further on the individual measurement of suspended particles, we carry out experiments on suspensions with different particle concentrations. Herein, the aquatic suspensions consisting of 3 μm polystyrene microspheres (PM) with a refractive index of 1.59 are used as samples. First, a low concentration of PM (4
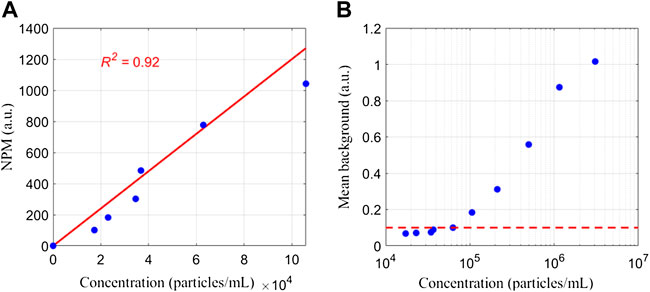
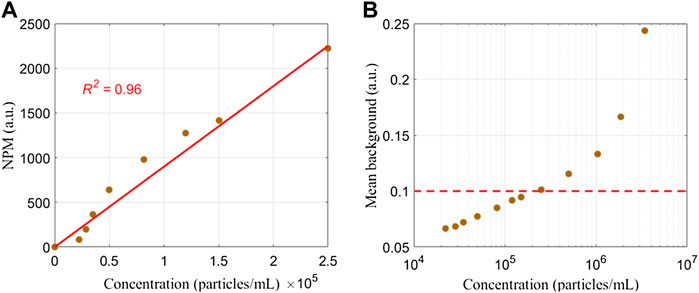
Subsequently, different concentrations of PM are measured and the corresponding numbers of suspended particles detected in 3 min (NPM) are recorded, as shown in Figure 3A. Notably, when the concentration is lower than 105 particles/ml, the NPM can increase linearly with the increase of concentration. However, when the concentration increases and becomes higher than 105 particles/ml, the increase of NPM clearly becomes gentle. Correspondingly, the measured mean backgrounds of different concentrations of PM are shown in Figure 3B. The mean backgrounds stay at similar values when the concentration of PM is low. However, the background starts to increase when the concentration of PM approaches 105 particles/ml and becomes larger than 0.18 after the concentration of PM is larger than 105 particles/ml. For simplicity, we set 0.10 as the threshold (red dashed line in Figure 3B). From Figure 3, the influence of the low concentration of suspended particles on the individual measurement can be ignored, which implies that the convergence of the illuminating light beam may not be affected either. However, the mean background will increase rapidly when the concentration is higher than 105 particles/ml.
The concentration of PM in the suspension affects the individual measurement in a complex manner. There is a threshold concentration (about 105 particles/ml). When the concentration of PM is larger than this threshold, the scattering of suspended particles in the optical path of the illuminating beam will destroy the individual measurement in some way. The destructiveness can be indicated by the linear relationship between the NPM and the concentration of PM, and the mean background. Since the convergence of the illuminating beam plays a vital role in the individual measurement, one can imagine that the convergence of the illuminating beam may be no longer valid for the cases with a concentration of PM larger than the threshold concentration.
When there is more than one particle in the light beam, we will get interference and speckle image on any plane. However, for the experimental setup in Figure 1, only the light scattered by the particle in the scattering volume can be received, which may be interference by the very close particles in the light beam. If there is more than one particle in the scattering volume on average, the individual particle measurement is not valid, and the signals would be like those in Figure 2B. Therefore, the particle concentration should be seriously considered to ensure that the light beam statistically illuminates one particle.
Results of the Monte Carlo simulations
To investigate how the convergence of the illuminating beam is affected, we use the Monte Carlo simulation to mimic the light propagation and scattering in the suspensions. The Monte Carlo simulation has been widely used to study the behavior of photons as they propagate through complex media [16, 17], and its principles are clearly described elsewhere [18]. Herein, Monte Carlo simulation is used to simulate the effects of different factors on the convergent beam, including size and concentration of suspended particles, scattering coefficient of the suspension, and optical path length of the illuminating beam before the focal spot in the suspension.
The geometric model of the convergent beam is set in Figure 4A. In accordance with the experiment setup, the radius of the lens (rin) is set as 2.0 mm. The wavelength of the incident light is 520 nm. The total number of photons is 109 with a normal distribution in the incident area. The incident photons would statistically undergo propagation and scattering. Some of them will eventually pass through the optical path in suspension and finally arrive at the receiving plane, and the area distribution of the collected photons can be evaluated, and the full width at half-maximum (FWHM) of the distribution can also be obtained. In this work, we use FWHM to reflect the size of the convergent beam and further estimate the situation of the convergence of the light beam after the particle scattering in the suspension. The refractive indexes of the medium and suspended particles are respectively 1.33 and 1.59.
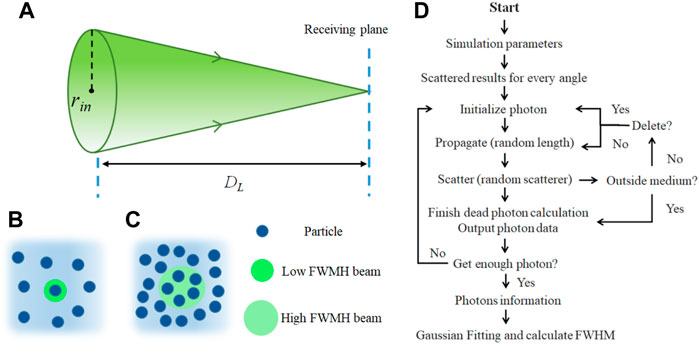
FIGURE 4. (A) Simulation model of the convergence of light beam; (B) and (C) situations of the low-FWHM beam and the high FWHM beam; (D) framework of the Monte Carlo simulation.
If the FWHM of the convergent beam is low, the convergent beam statistically illuminates one particle, as shown in Figure 4B. A larger FWHM means that the convergent beam would have the opportunity to illuminate more particles with less energy density, which leads to a low SNR, as shown in Figure 4C. According to the signals in Figure 2, a large FWHM will generally disable the individual measurement of suspended particles.
The framework of the Monte Carlo simulation used in this research is illustrated in Figure 4D [16]. The multilayered light scattering and transport algorithms follow the public code [17]. First, we need to set the mentioned necessary simulation parameters, including rin, μs, σs, DL, the number of photons and their wavelength, and the refractive indexes of the medium and suspended particles. Herein, the focal distance and the thickness of the medium are set as the same values which can represent the optical path length, i.e., DL. The scattering functions of spheres for every angle are calculated and stored in the memory as a database to reduce the computation time. Then, the photon is initialized, propagates, and scatters until it is outside the medium. The program will output the photon information once all photons are calculated. Finally, we can get the Gaussian distribution of the collected photons and further obtain the FWHM of the distribution. The phase changes due to the propagation and scattering of each photon are also traced and considered after arriving at the receiving plane and superposing with other photons, which includes the interference effect between particles.
We have known that particle scattering will redirect the light [15]. Different concentrations of spherical particles in different sizes are simulated, as shown in Figure 5A. The concentration of particles largely affects the FWHM, which changes significantly with the particle sizes. However, each of them has a turning point of concentration before which FWHM stays low and grows gently, but after that, FWHM rapidly increases with concentration. The turning point is related to the particle sizes, and it is smaller when the particle size is bigger. Especially, the turning point of 3 μm diameter particles is at about 105 particles/ml, which is quite consistent with the experiment result in Figure 3.
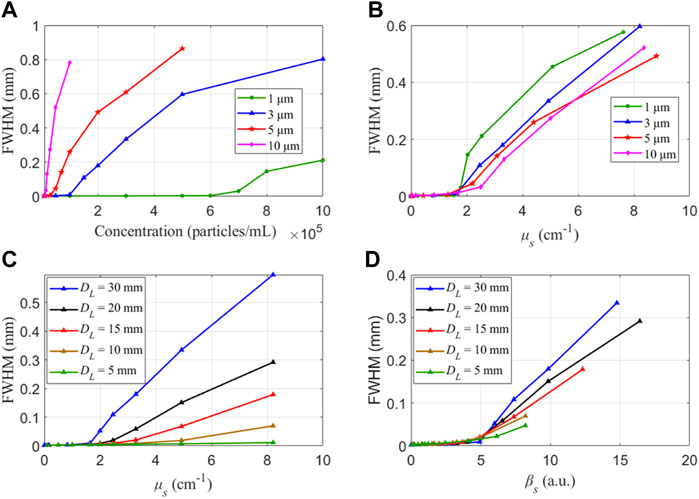
FIGURE 5. Influences of different factors on the FWHM. (A) Different concentrations and sizes; (B) different μs and sizes; (C) different μs and DL; (D) Different βs and DL.
The scattering coefficient μs is determined by the concentration and diameter of a sphere as shown in Eq. 2, so we can combine these two factors by using
Subsequently, we simulate the changes of FWHM in different DL and μs of the suspension, as shown in Figure 5C. It is notable that FWHM almost stays low and grows negligibly for a small μs but increases very fast for a large μs. However, the turning points
Till now, we can judge whether the convergence of the illuminating beam can be maintained by the use of
Discussion
From the experimental results in Figures 2, 3 and simulation results in Figure 5, the particle scattering in the suspension will enlarge the FWHM of the illuminating beam, which will increase the scattering volume. The disablement of the individual measurement can be understood in different aspects. First, the energy density of the illuminating beam on the sectional area will decay as the square of the FWHM, so the scattering intensity originating from the individual particles is much weakened. Second, the scattering volume will increase as the third power of FWHM, which leads to a similar increase in the number of illuminated particles. Therefore, the bulk scattering intensity from the scattering volume accordingly increases. Finally, we cannot get the pulses with enough SNR but only a high-level signal which can be severed as the background in Figure 2B.
According to Figure 5, we can adjust DL in the suspension to ensure βs less than 5 and facilitate the individual measurement. Practically, for the experiment setup in Figure 1, when the concentration of suspended particles is too high, suspended particles can destruct the convergence of the illuminating beam during its propagation in the optical path between the W1 and the focus point. Therefore, it is necessary to shorten DL to improve the original experiment setup, which can be achieved by two strategies including tube sampling and shielding.
Tube sampling strategy
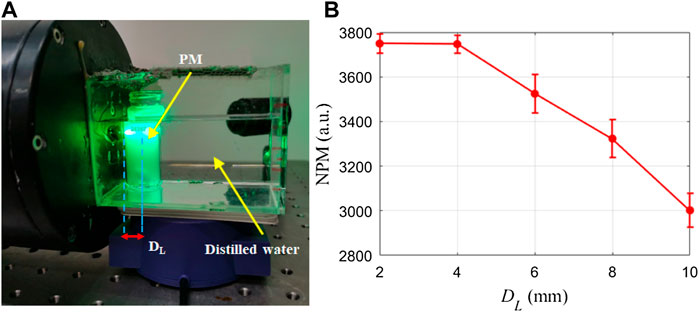
The key point of this strategy is that we use a small tube or a similar container to contain the suspension and leave only distilled water in the sampling pool. Then, we change the location of the tube along the illuminating beam to shorten DL, and a series of experiments are carried out for different DL to investigate the effect of this strategy. In practice, 5
Recall that it is hard to extract pulses with high SNR using the original experimental setup where DL is 30 mm. For the individual measurement using GB where DL is 4 mm, the NPM is much larger because the mean background is less than 0.1. This can be explained by the dramatic increase of FWHM of the illuminating beam after βs is larger than 5 in Figure 5D. Notably, the shortened DL can obviously promote the achievement of the individual measurement and the probing of the maximal NPM by ensuring the convergence of the illuminating beam. A future design may be practical if we could use a small-diameter tube to let the suspension flow through the scattering volume.
Shielding strategy
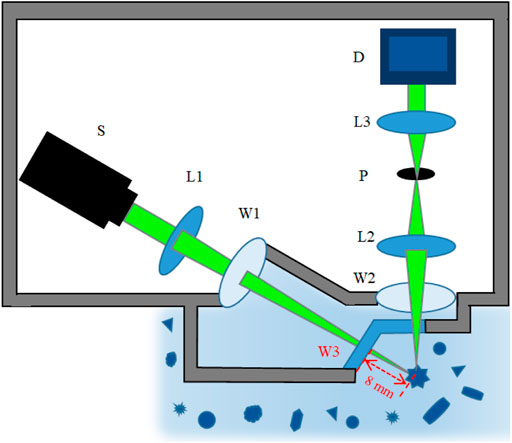
Furthermore, we also consider the emerging demand for the in situ detection of the suspended particle in aquatic environments [19–21]. Therefore, we propose the shielding strategy that the propagation path between the W1 and focus point is sealed and filled with distilled water, and the illuminating light and scattered light pass by a K9 glass window (W3), as shown in Figure 7. Now, compared with the original experimental setup in Figure 1, DL has been reduced from 30 to 8 mm.
Then, the concentration experiments of PM are carried out using the new setup, and the results are collected and shown in Figure 8A. The linearity range of NPM covers the particle concentration to 2
We notice that there is a slight difference in the slopes in Figures 3A, 8A, which may originate from different stirring speeds. In the experiment, the stirring speed has little effect on the convergence of the illuminating beam but can affect the movement velocity of suspended particles. Therefore, the accuracy control of the stirring speed can generally decrease the errors of the results. Herein, we use a continuously adjustable magnetic stirring apparatus with the range of 300–1,800 rpm (Topolino, IKA Works GmbH & Co. KG, Germany) to rotate the magnetic rotor. However, the magnetic stirring apparatus cannot show the specific speed. We first find a fixed location of the rotary knob to ensure that the magnetic rotor can stably rotate, and then we adjust the rotary knob to the fixed location for each experiment. It may lead to a slight difference in the stirring speed. Moreover, the Brownian motion of suspended particles and the fluctuations can be ignored because the Brownian motion is much slower than the stirring speed.
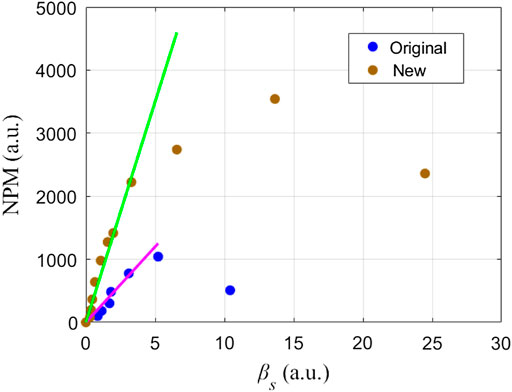
Then, we calculate βs based on the concentration experiments using Eq. 3, as shown in Figure 9. Impressively, NPM will linearly increase with the increase of βs when βs is less than 5, which is quite consistent with the simulation result. After that, the NPM loses the linearity with βs. Therefore, βs is an effective indicator to comprehensively demonstrate the achievement of the individual measurement and it can further reveal the convergence of the illuminating beam in the suspension.
As a dimensionless quantity, βs combines the physical properties of the suspension and the optical path length of the illuminating beam. According to the physical explanation of the scattering in turbid media, βs describes the logarithmic attenuation of the intensity suffered from the scattering in the suspensions [15]. In statistics, βs usually can be used to determine the multiple scattering times with the mean free path [18]. From the experimental results and simulation results, we can see that if the scattering occurs less than five times, the convergence of the illuminating beam can be kept effectively. Otherwise, the convergence of the illuminating beam will seriously suffer from particle scattering. These conclusions will help the optical design of the particle probers in the suspension.
For the natural water ecosystem, the suspended particles not only include the spherical particles but also the non-spherical particles. Also, the suspended particles in natural water may have diverse sizes, morphologies, materials, and pigments. The convergence of the illuminating beam in natural water is worth to investigating in the future. However, the investigation method used in this work would be beneficial and the conclusions may be suitable or at least instructive for natural water.
Conclusion
In this work, we study the convergence of the illuminating beam suffering from the scattering in the suspension and investigate the influence of the physical properties of the particles and the optical path length on the convergence. The achievement of the convergent beam is the key factor of the individual measurement, which has been proven to be powerful for the extensive study of water systems. Both an experimental setup based on the individual measurement and Monte Carlo simulations are used to explore the influences of different factors on the convergence of the light beam. The experiment results are quite consistent with the simulation results. The convergence of the illuminating beam would be free from the scattering in the suspension if βs is less than 5. Otherwise, the convergence would seriously suffer from the scattering in the suspension. This dimensionless quantity combines the physical properties of particles and the optical path length in the suspension. Based on these results, two strategies to ensure the convergence of the illuminating beam in the dense suspensions are proposed, and their validation experiments are carried out, which indeed effectively maintain the convergence of the illuminating beam and finally facilitate the individual measurement in higher turbid water. The results of this work would help the optical design of the future particle probers potentially used in aquatic environments.
Data availability statement
The original contributions presented in the study are included in the article/supplementary material; further inquiries can be directed to the corresponding author.
Author contributions
JL, HD, and ZG designed the study and developed the experiments. JL and HD performed the data analysis and wrote the first manuscript draft. RL and HM developed the manuscript concept. All authors contributed to revising the manuscript.
Funding
This research was funded by the Guangdong Development Project of Science and Technology (2020B1111040001), the National Key Research and Development Program of China (2018YFC1406600), the National Natural Science Foundation of China (NSFC) (41527901, 61975088), Shenzhen Key Laboratory of Marine IntelliSense and Computation under Contract ZDSYS20200811142605016, and Shenzhen-Hong Kong Joint Project (SGDX20201103095403017).
Conflict of interest
The authors declare that the research was conducted in the absence of any commercial or financial relationships that could be construed as a potential conflict of interest.
Publisher’s note
All claims expressed in this article are solely those of the authors and do not necessarily represent those of their affiliated organizations or those of the publisher, the editors, and the reviewers. Any product that may be evaluated in this article or claim that may be made by its manufacturer is not guaranteed or endorsed by the publisher.
References
1. Turner A, Millward GE. Suspended particles: Their role in estuarine biogeochemical cycles. Estuar Coast Shelf Sci (2002) 55(6):857–83. doi:10.1006/ecss.2002.1033
2. Pedrosa-Pàmies R, Conte MH, Weber JC, Johnson R. Carbon cycling in the Sargasso Sea water column: Insights from lipid biomarkers in suspended particles. Prog Oceanogr (2018) 168:248–78. doi:10.1016/j.pocean.2018.08.005
3. Stramski D, Boss E, Bogucki D, Voss KJ. The role of seawater constituents in light backscattering in the ocean. Prog Oceanogr (2004) 61(1):27–56. doi:10.1016/j.pocean.2004.07.001
4. Mishra S, Kulkarni MM, Verma A. High-resolution imaging and fast number estimation of suspended particles using dewetted polymer microlenses in a microfluidic channel. Micron (2021) 151:103148. doi:10.1016/j.micron.2021.103148
5. Ahn JH, Grant SB. Size distribution, sources, and seasonality of suspended particles in southern California marine bathing waters. Environ Sci Technol (2007) 41(3):695–702. doi:10.1021/es061960+
6. Li J, Chen T, Yang Z, Chen L, Liu P, Zhang Y, et al. Development of a buoy-borne underwater imaging system for in situ mesoplankton monitoring of coastal waters. IEEE J Oceanic Eng (2022) 47(1):88–110. doi:10.1109/JOE.2021.3106122
7. Bright C, Mager S, Horton S. Response of nephelometric turbidity to hydrodynamic particle size of fine suspended sediment. Int J Sediment Res (2020) 35(5):444–54. doi:10.1016/j.ijsrc.2020.03.006
8. Sandven H, Kristoffersen AS, Chen YC, Hamre B. In situ measurements of the volume scattering function with LISST-VSF and LISST-200x in extreme environments: Evaluation of instrument calibration and validity. Opt Express (2020) 28(25):37373–396. doi:10.1364/OE.411177
9. Sun D, Li Y, Wang Q, Gao J, Lv H, Le C, et al. Light scattering properties and their relation to the biogeochemical composition of turbid productive waters: A case study of lake taihu. Appl Opt (2009) 48(11):1979–89. doi:10.1364/AO.48.001979
10. Zhang L, Wang X, Sun M, Chai Y, Hao Z, Zhang C. Monte Carlo simulation for the light propagation in two-layered cylindrical biological tissues. J Mod Opt (2007) 54(10):1395–405. doi:10.1080/09500340601109289
11. Xu L, Li H, Xiao Z. Discussion on backscattered photon numbers and their scattering events in a turbid media. Acta Phys Sin (2008) 57(9):6030. doi:10.7498/aps.57.6030
12. Liao R, Li Q, Mao X. A prototype for detection of particles in sea water by using polarize-light scattering. In: Proceedings of the OCEANS; 17-20 June 2019; Marseille, France, 2019 (2019). doi:10.1109/OCEANSE.2019.8867414
13. Li J, Zou C, Liao R, Peng L, Wang H, Guo Z, et al. Characterization of intracellular structure changes of microcystis under sonication treatment by polarized light scattering. Biosensors (Basel) (2021) 11:279. doi:10.3390/bios11080279
14. Li J, Liao R, Tao Y, Zhuo Z, Liu Z, Deng H, et al. Probing the cyanobacterial microcystis gas vesicles after static pressure treatment: A potential in situ rapid method. Sensors (2020) 20:4170. doi:10.3390/s20154170
15. Bohren CF, Huffman DR. Absorption and scattering of light by small particles. New York: Wiley (1983).
16. Li P, Liu C, Li X, He H, Ma H. GPU acceleration of Monte Carlo simulations for polarized photon scattering in anisotropic turbid media. Appl Opt (2016) 55(27):7468–76. doi:10.1364/AO.55.007468
17. Wang L, Jacques S, Zheng L. MCML—Monte Carlo modeling of light transport in multi-layered tissues. Comput Methods Programs Biomed (1995) 47(2):131–46. doi:10.1016/0169-2607(95)01640-F
18. Yun T, Zeng N, Li W, Li D, Jiang X, Ma H. Monte Carlo simulation of polarized photon scattering in anisotropic media. Opt Express (2009) 17(19):16590–602. doi:10.1364/OE.17.016590
19. Li J, Liao R, Tao Y, Liu Z, Wang Y, Ma H. Evaluation for gas vesicles of sonicated cyanobacteria using polarized light scattering. Optik (2020) 216:164835. doi:10.1016/j.ijleo.2020.164835
20. Chen Y, Liao R, Li J, Zhou H, Wang H, Zhuo Z, et al. Monitoring particulate composition changes during the flocculation process using polarized light scattering. Appl Opt (2021) 60(32):10264–72. doi:10.1364/AO.440400
Keywords: convergent beam, suspended particles, optical apparatus, individual measurement, Monte Carlo simulation
Citation: Li J, Deng H, Guo Z, Liao R and Ma H (2022) Convergence of illuminating beams suffering from scattering during the individual measurement of suspended particles. Front. Phys. 10:975766. doi: 10.3389/fphy.2022.975766
Received: 22 June 2022; Accepted: 22 July 2022;
Published: 25 August 2022.
Edited by:
Nirmal Mazumder, Manipal Academy of Higher Education, IndiaReviewed by:
Dan Chicea, Lucian Blaga University of Sibiu, RomaniaDongmei Liu, South China Normal University, China
Copyright © 2022 Li, Deng, Guo, Liao and Ma. This is an open-access article distributed under the terms of the Creative Commons Attribution License (CC BY). The use, distribution or reproduction in other forums is permitted, provided the original author(s) and the copyright owner(s) are credited and that the original publication in this journal is cited, in accordance with accepted academic practice. No use, distribution or reproduction is permitted which does not comply with these terms.
*Correspondence: Ran Liao, bGlhby5yYW5Ac3oudHNpbmdodWEuZWR1LmNu
 Jiajin Li1,2
 Ran Liao
 Hui Ma